Fast Intro into the NDI GUI
Get to know the new GUI of Nexus Dashboard Insights
The GUI of Nexus Dashboard has undergone a style and look refresh with the latest release, 3.1. In this introduction, you will learn how to navigate it.
Step 1 - Overview
Log in to Nexus Dashboard. Given that you are logged in as an admin user, the first thing you will see is the Nexus Dashboard admin portal. From this portal, you can manage the Nexus Dashboard cluster, regardless of whether it is a physical one (as in this case) or a virtual one.
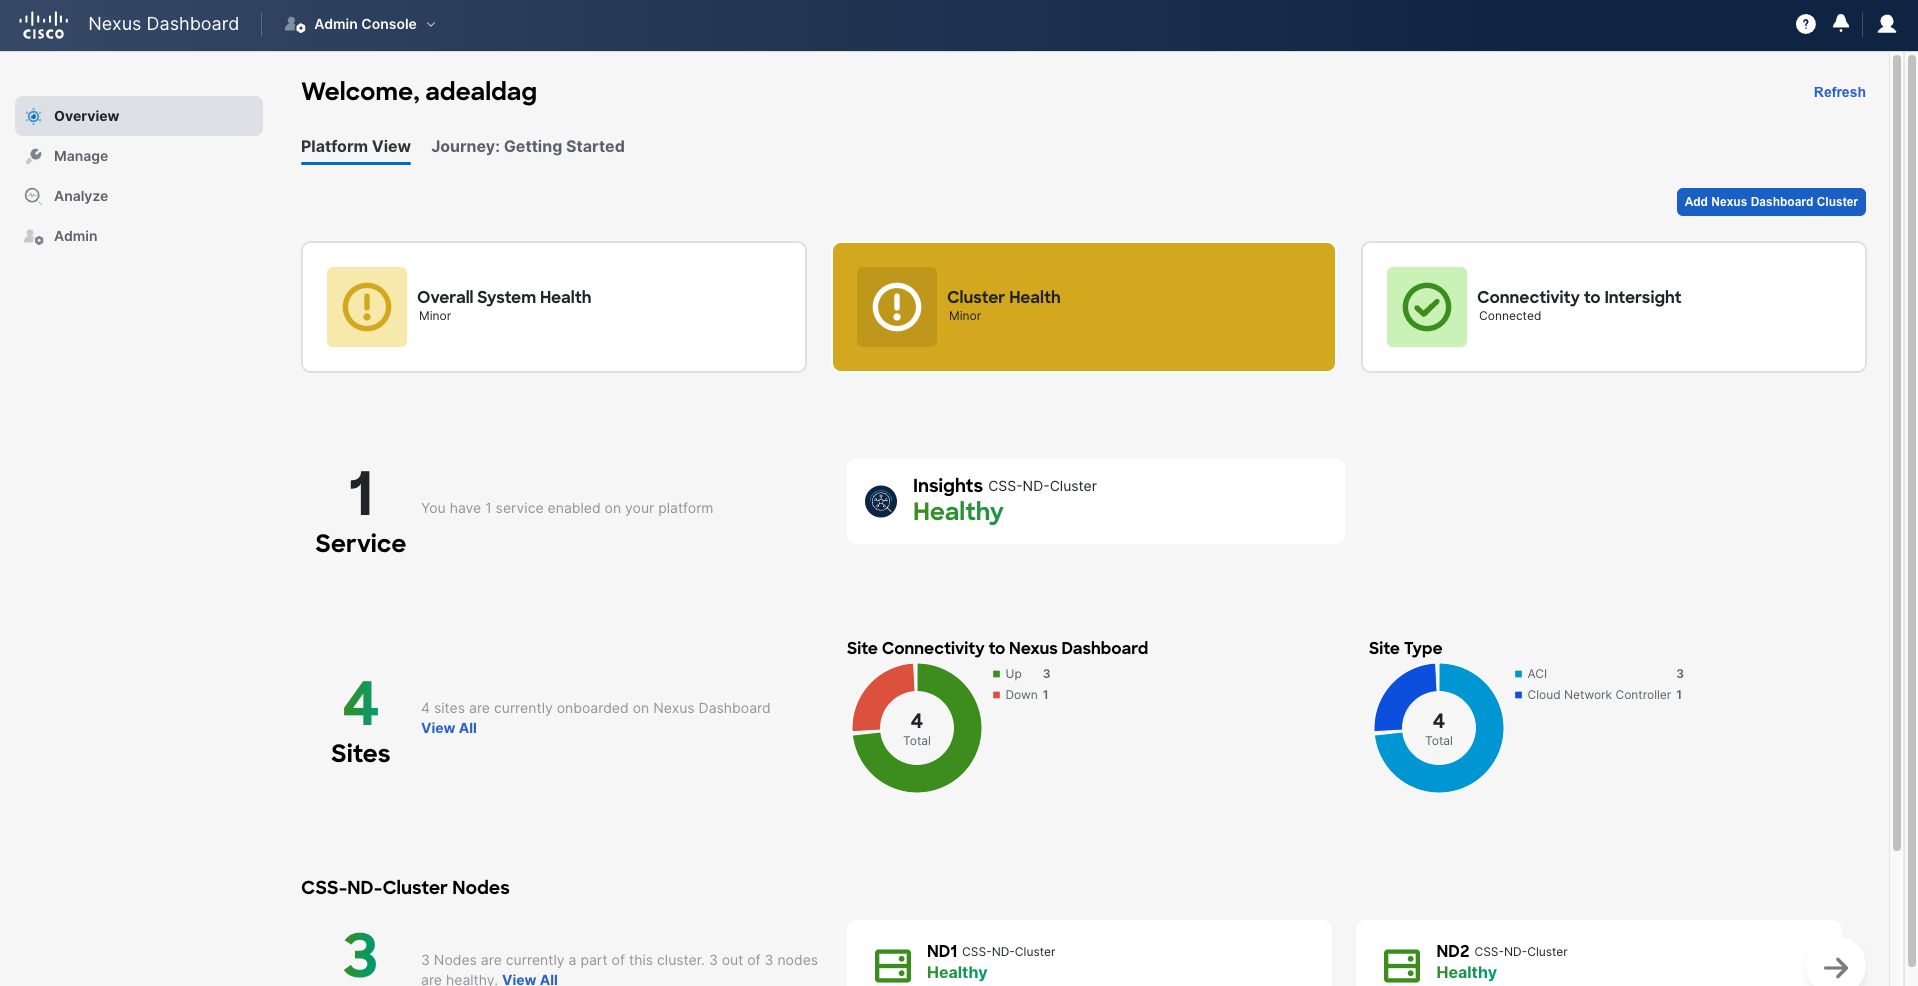
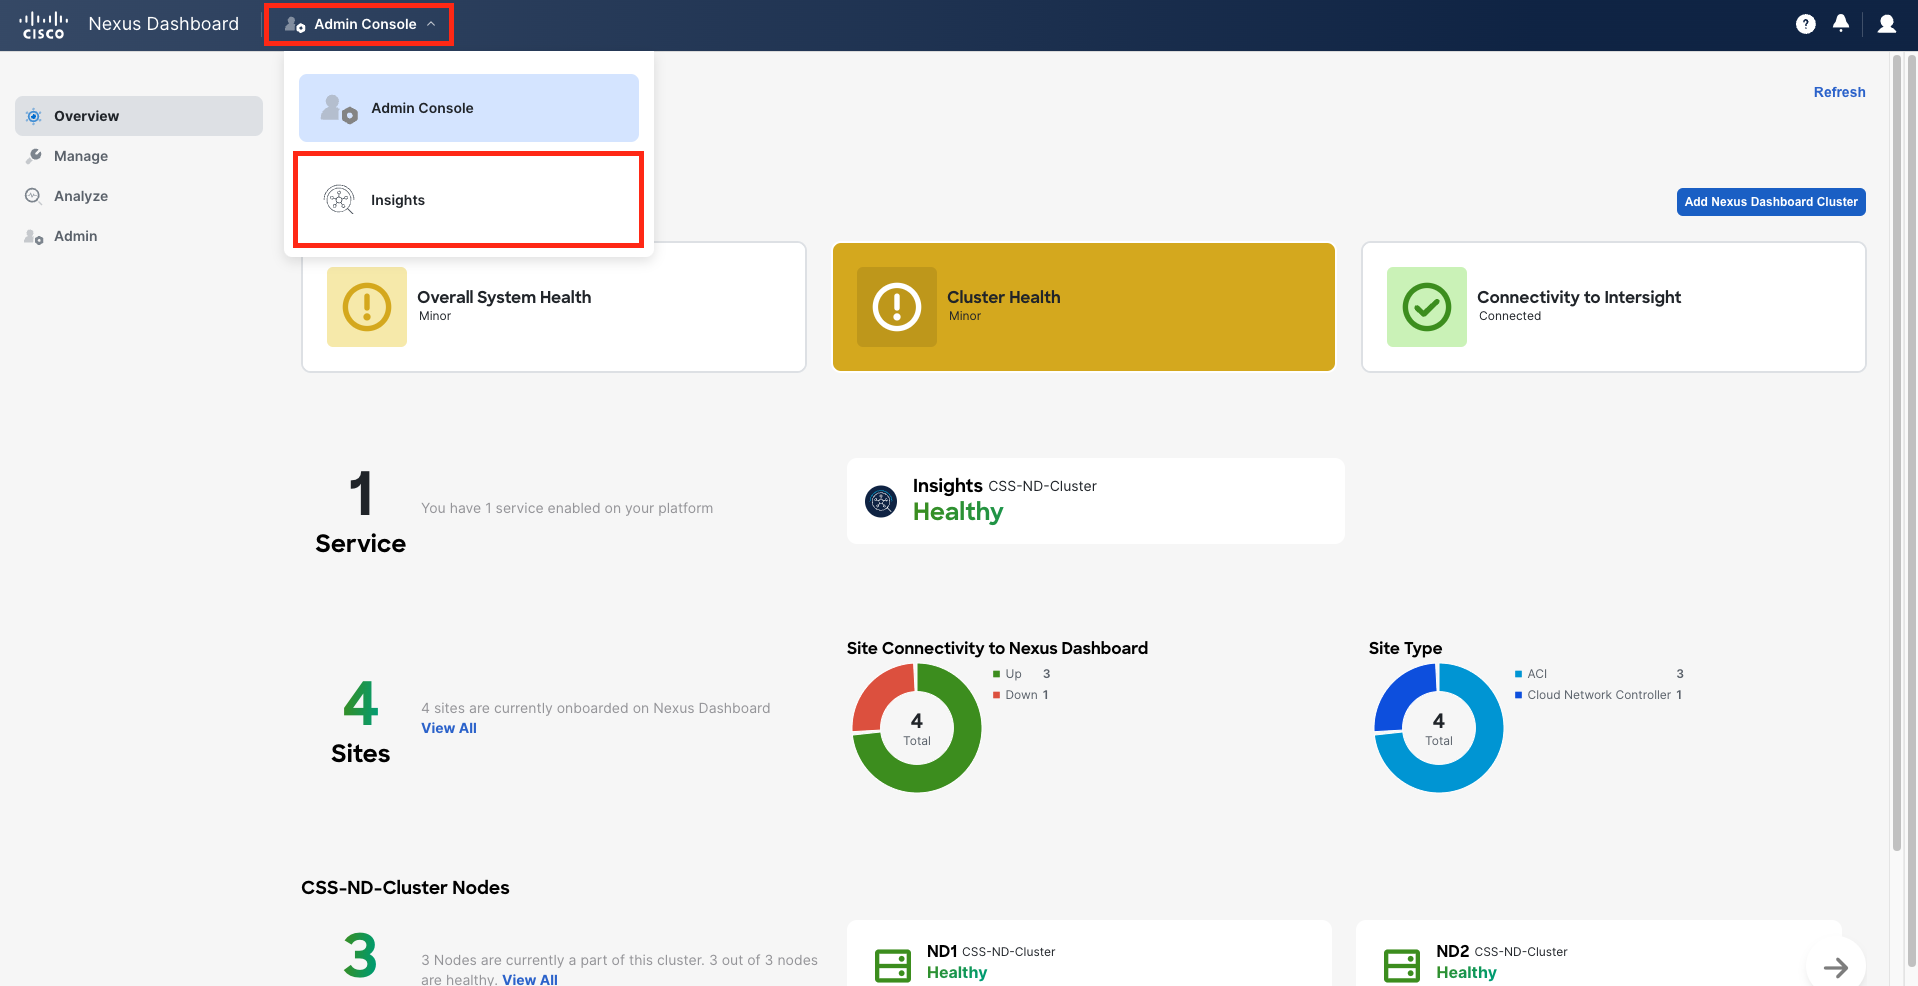
Nexus Dashboard Insights is a service that runs on top of Nexus Dashboard. You can navigate to Nexus Dashboard Insights using the dropdown in the top left corner. Note that for the rest of this lab, you won't need to return to the admin portal.
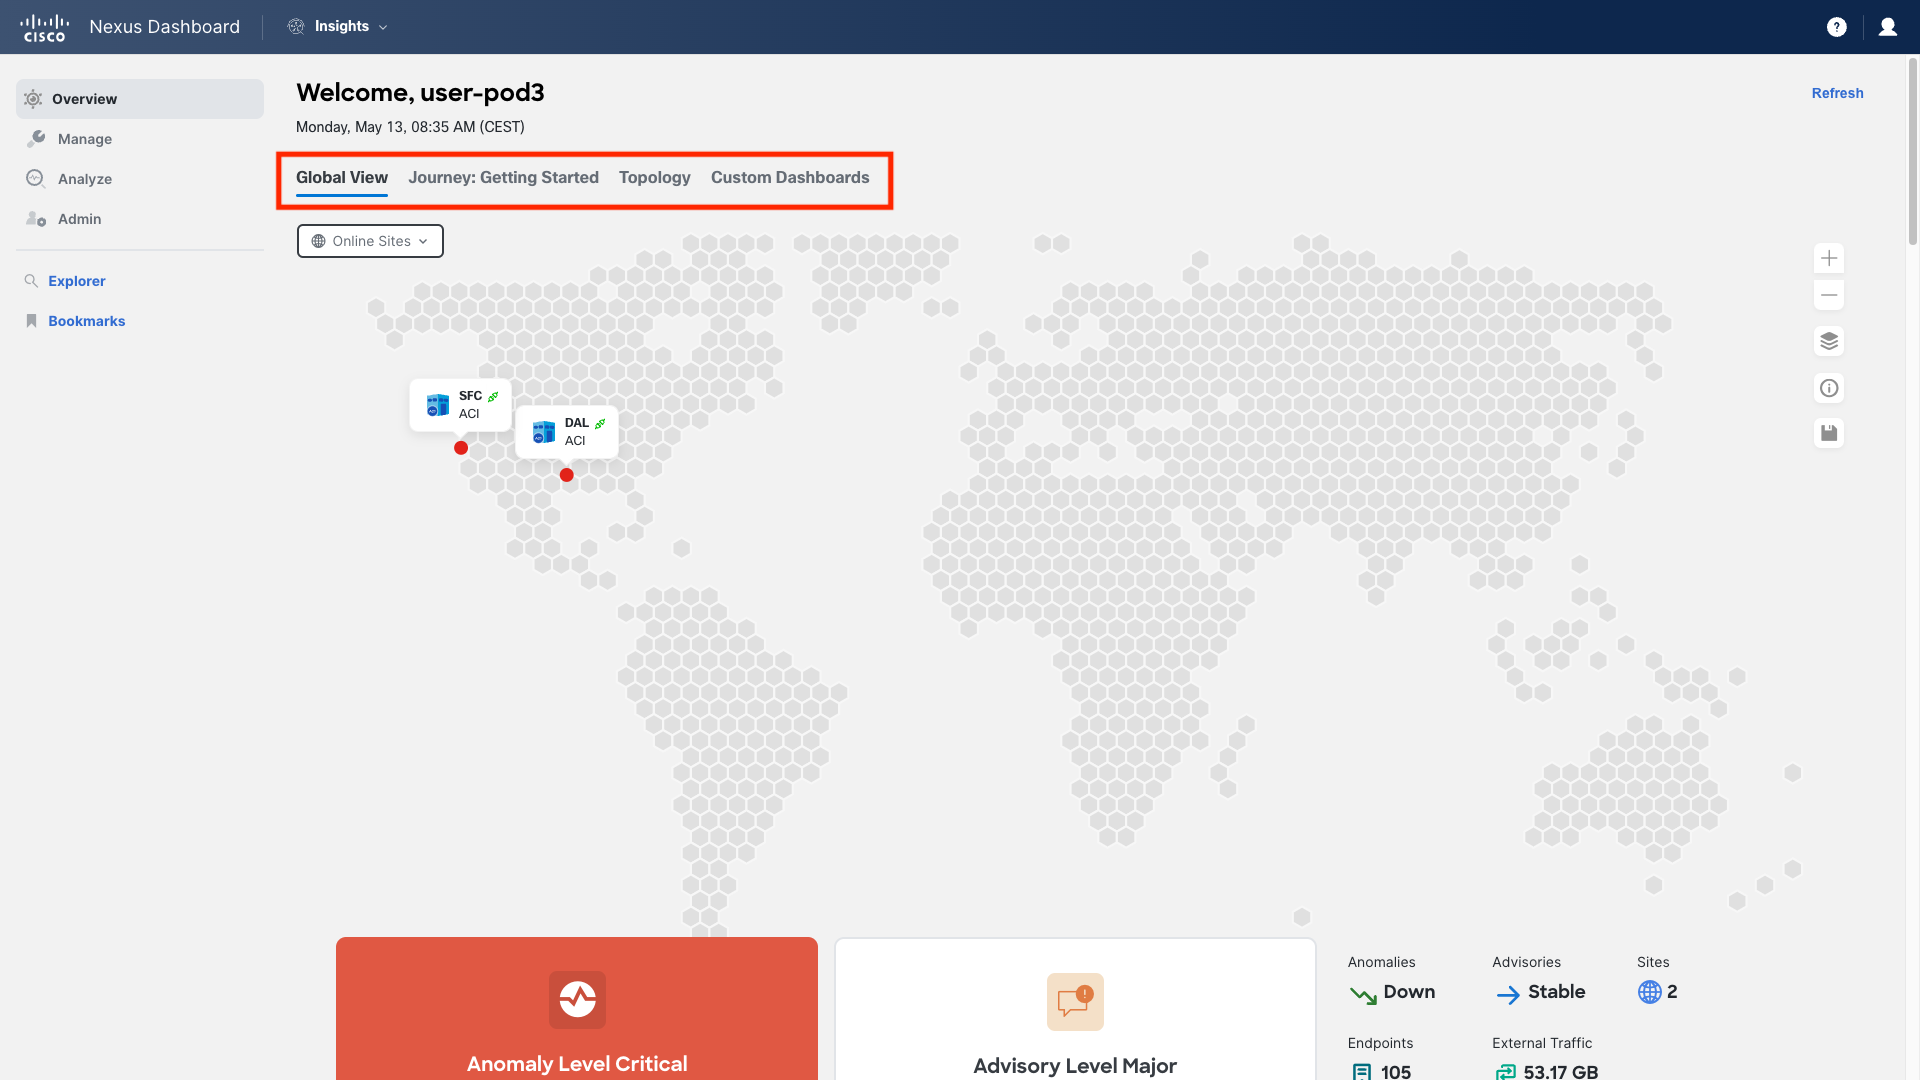
Now switch to Nexus Dashboard Insights. The main screen consists of four tabs: Global View, Journey: Getting Started, Topology and Custom Dashboards. You can come back at any time by clicking Overview in the left column menu. Let's first review the Global View.
Step 2 - Global View
Global View provides a high-level overview of your managed fabrics. Insights are compatible with ACI sites, NDFC fabrics, and standalone NX-OS devices. In our case, we will work exclusively with two ACI fabrics: DAL and SFC. Scrolling past the map view, you can check the counts of Anomalies and Advisories for all sites, observe how they are trending, glimpse into managed sites, or view sent/received external traffic. Optionally, you may click on a site in the map view to see only the relevant details for that site. All these details provide you with essential information about the overall state of your ACI fabric.
What are Anomalies and Advisories?
-
Nexus Dashboard Insights monitors various data sets from all nodes within the fabric and establishes baselines to identify "normal" behavior. Deviations from these baselines are flagged as Anomalies.
-
Advisories in Nexus Dashboard Insights detail the relevant impact through Field Notices, PSIRTs, EoL/EoS of Hardware and Software, and Best Practices. They offer recommendations to ensure your network is supported and operating under optimal conditions.
Global View should be constantly monitored by network operators. If looking into yet another monitoring page is not feasible, consider retrieving the status and anomalies count for each fabric via APIs; these metrics can then be imported into a centralized monitoring dashboard.
Keep scrolling down the page to get additional summarized information.
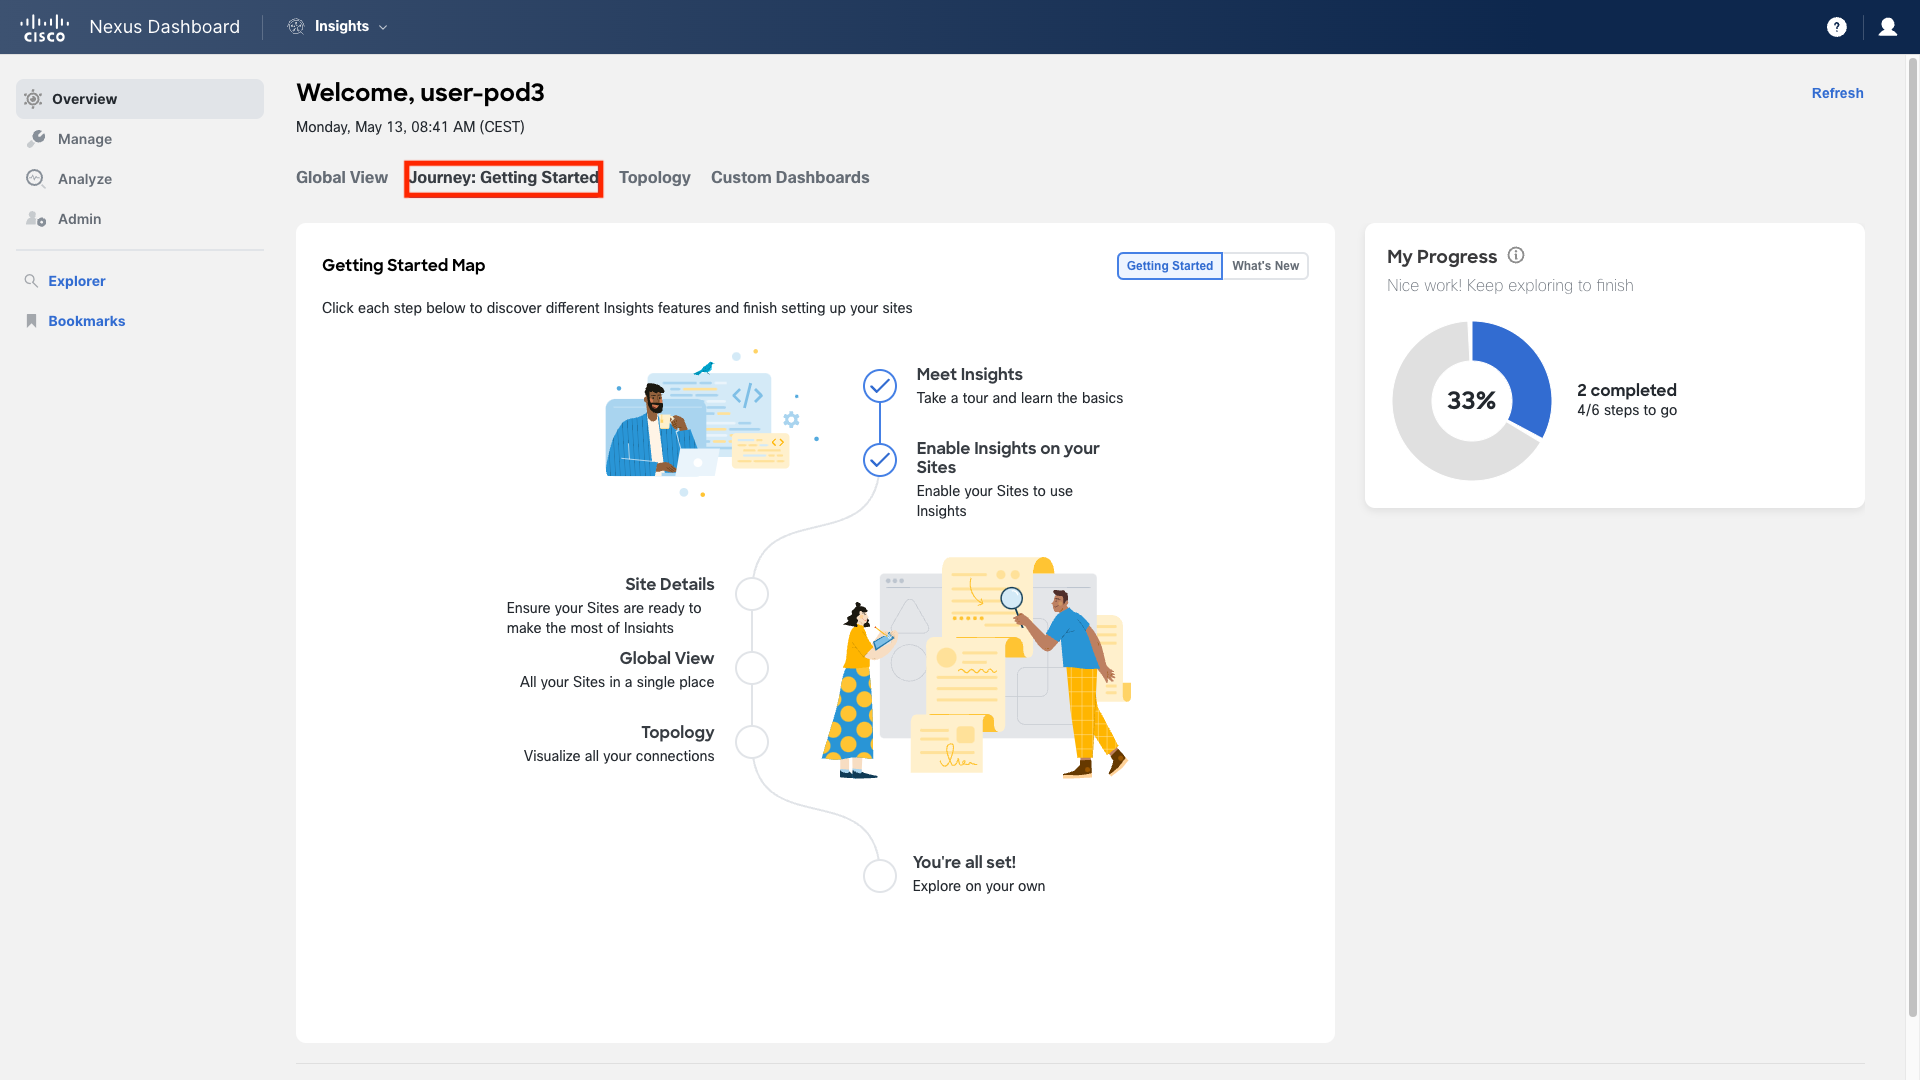
Step 3 - The Journey
Moving to the second tab: Journey: Getting Started. The Journey provides a guided tour of different Insights features and helps with their setup. Although we have already completed these initial steps for you, in your own environment, you would typically hover over the text in any step and click "Go" to be directed to the relevant interface for completion. You can also click "Tell Me More" for a detailed explanation of the step's purpose.
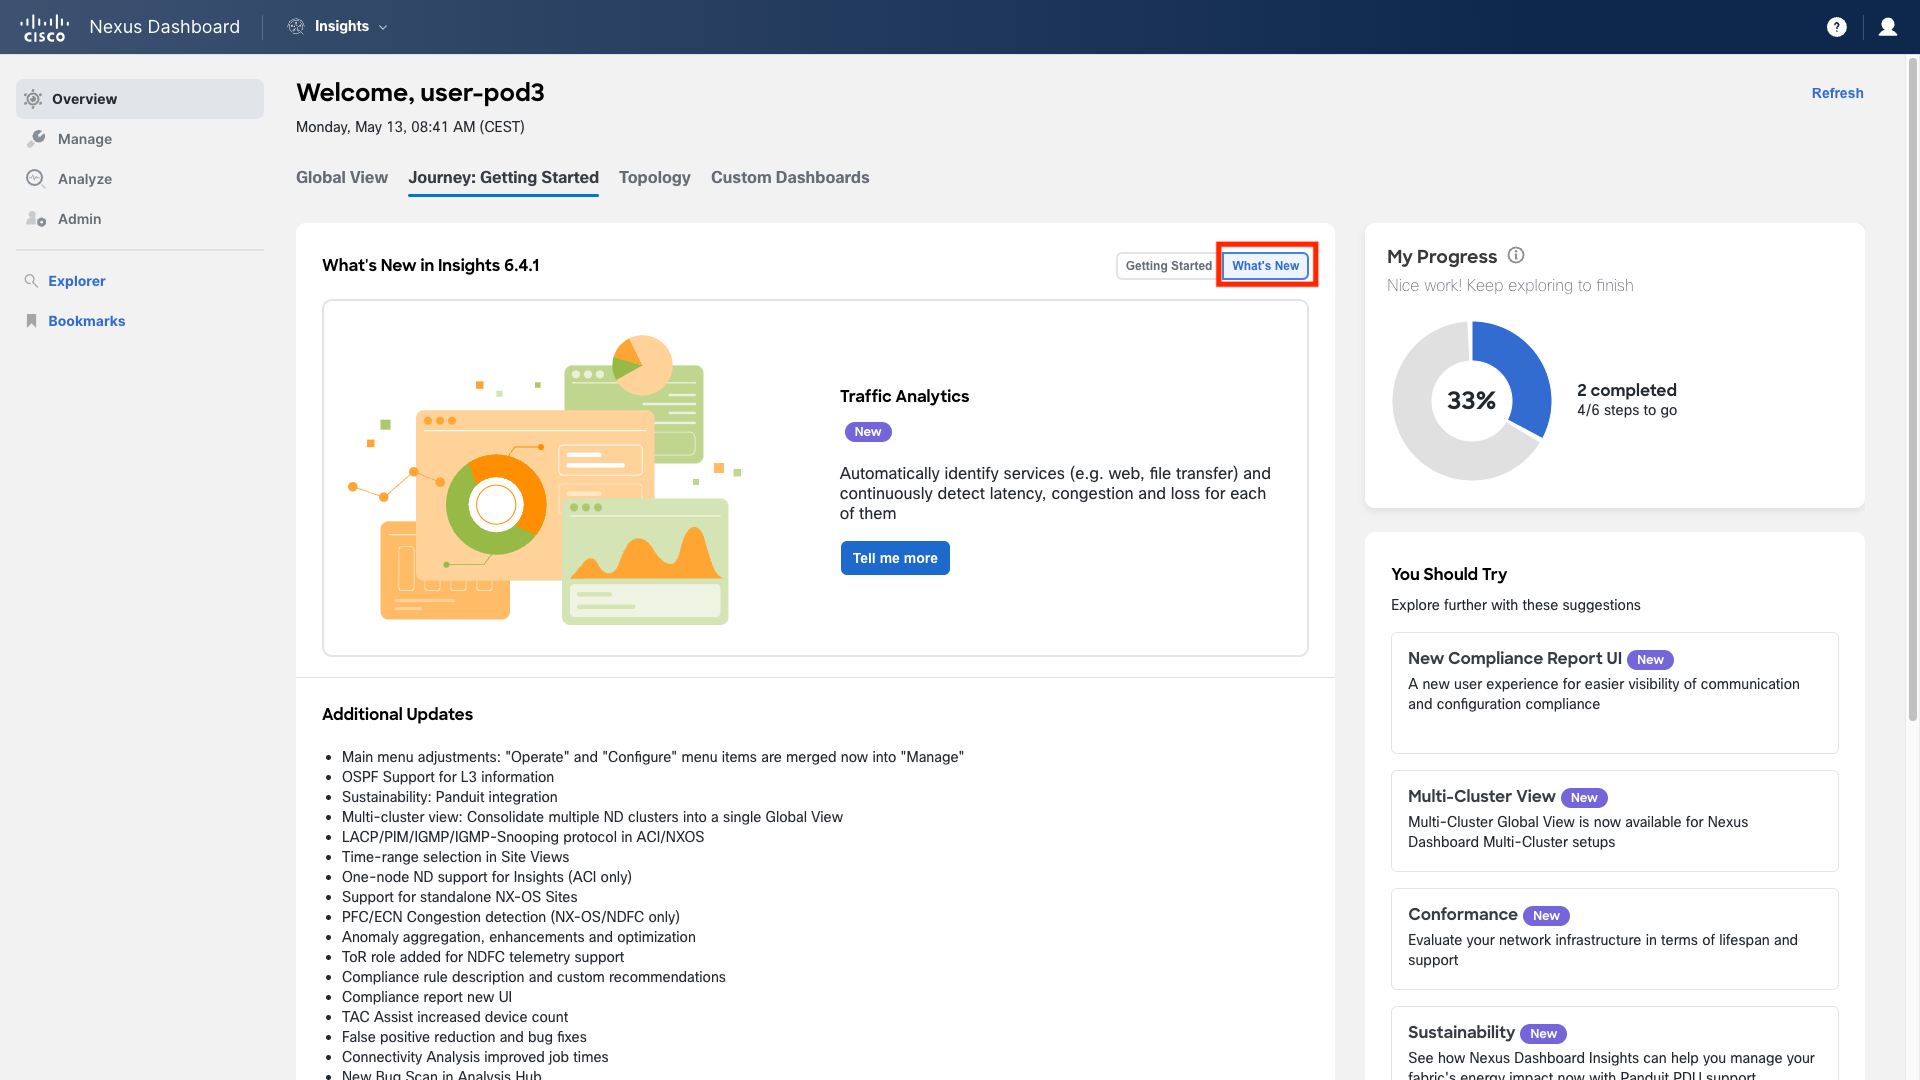
Additionally, you can switch to What's New to learn about the latest release's updates, new features, or improvements.
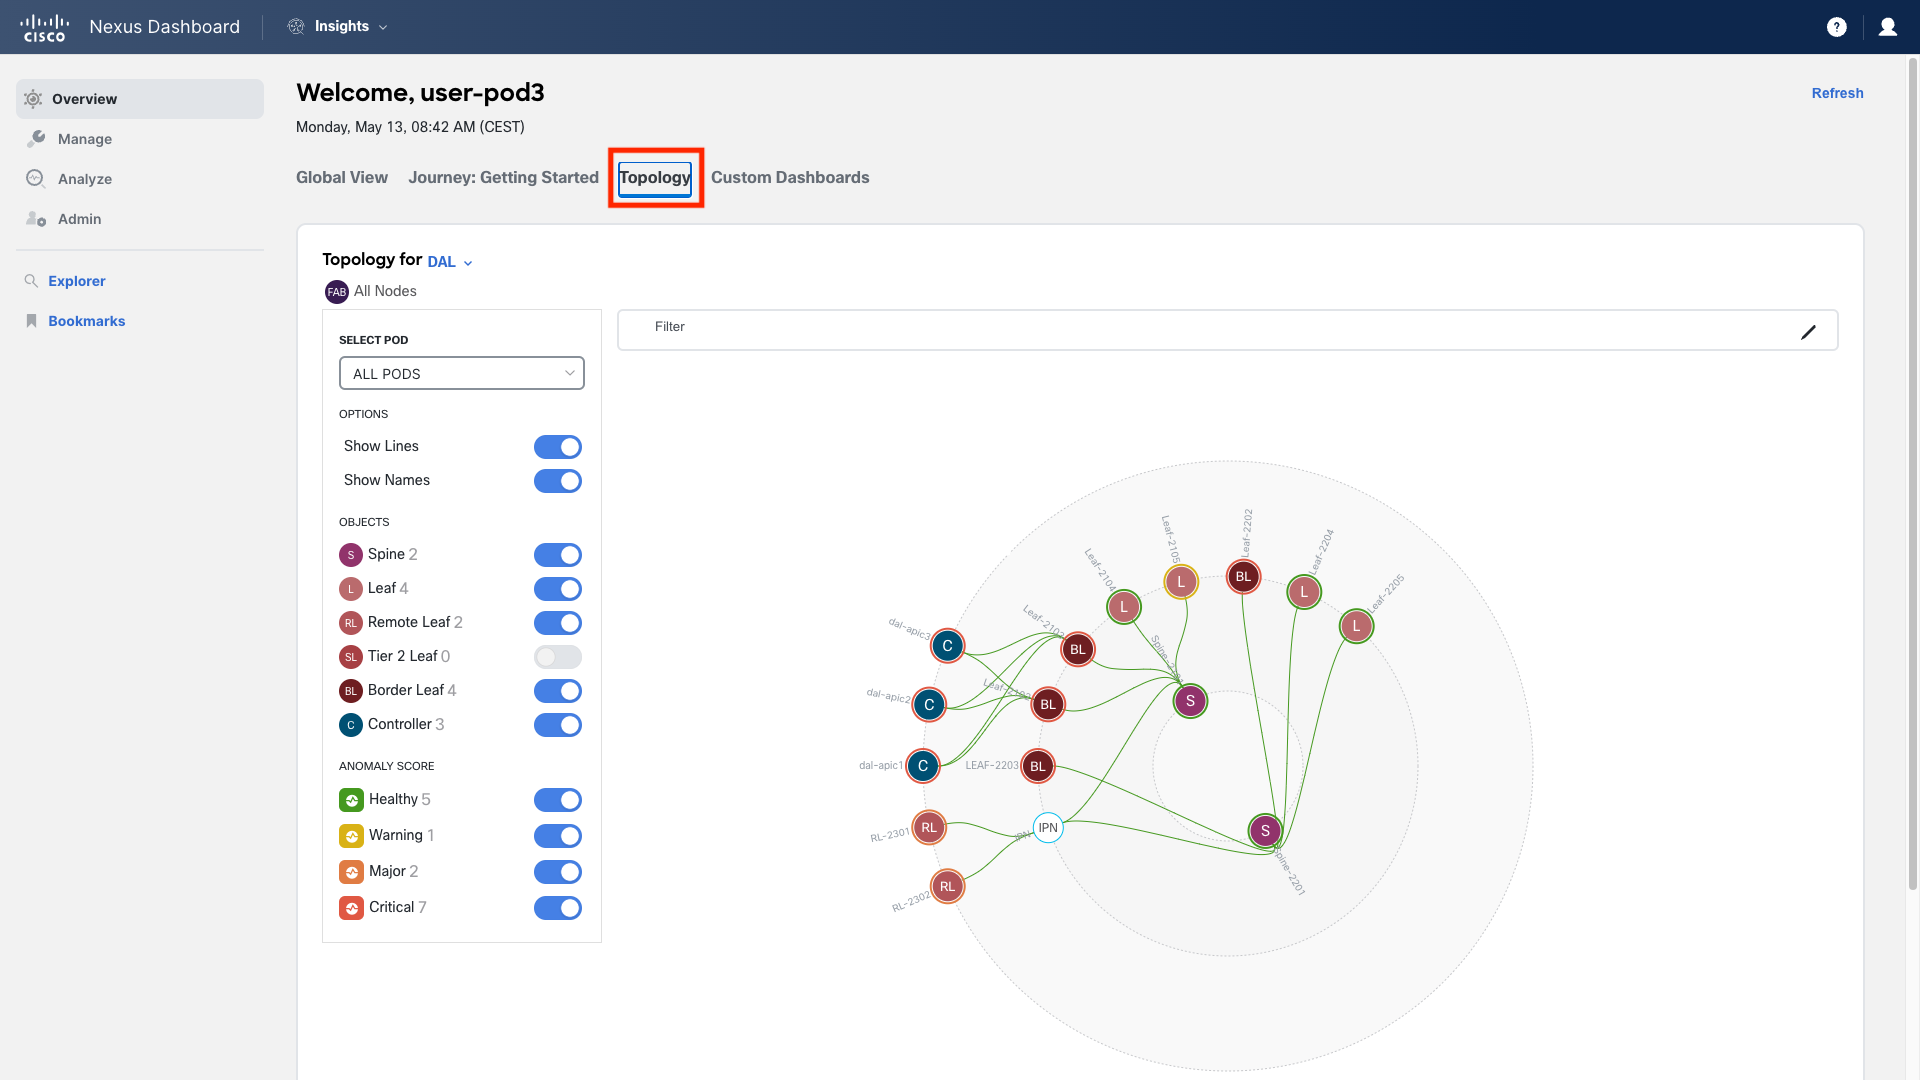
Step 4 - The Topology
Our third option in the Overview section is the Topology. This section illustrates how components are interconnected and even indicates where resources may be deployed. By clicking on any item in this view, you can quickly access more detailed information. You can also utilize the filter function in this view to perform tasks such as displaying where a specific resource is deployed. Give it a try now. In the filter bar, select the attribute Tenant and choose contains followed by pod-31, for instance. The view will update to show only those leaves where this tenant has been deployed.
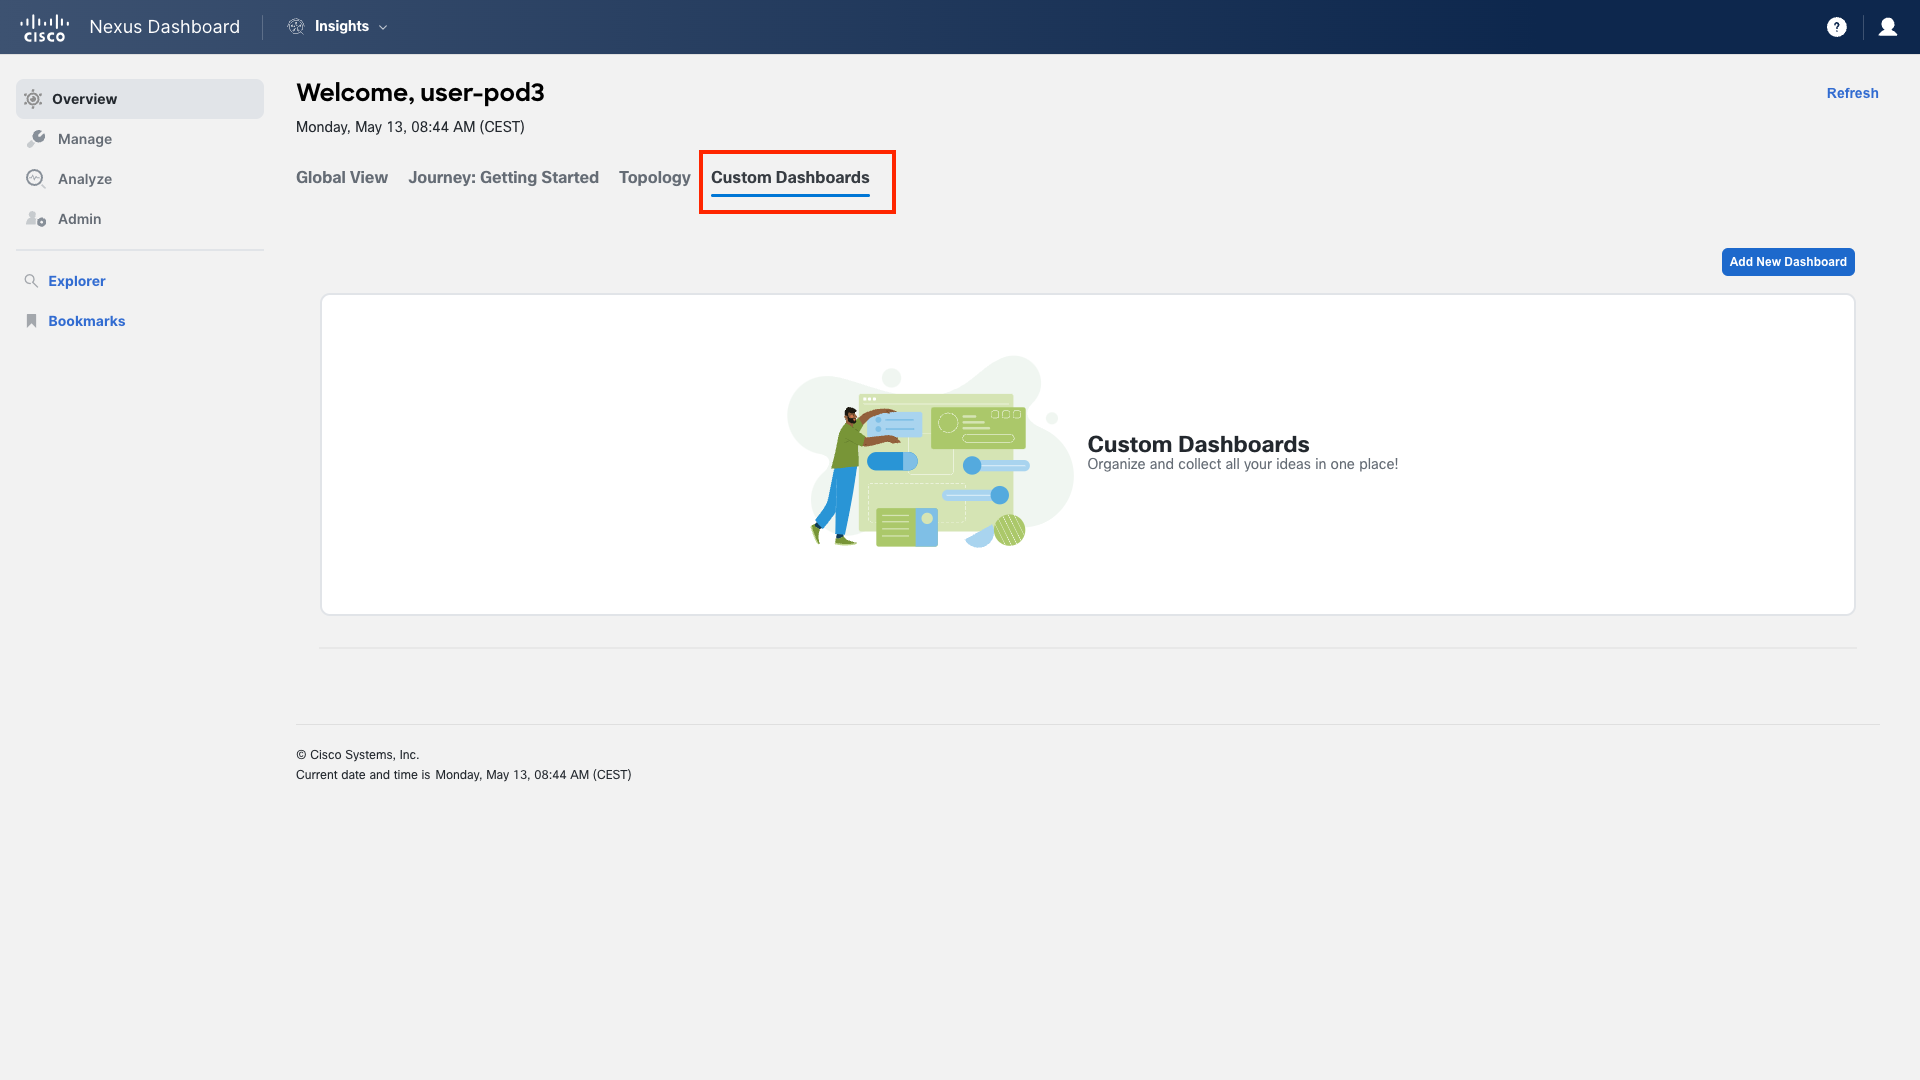
Step 5 - Custom Dashboards
Another important part of the daily routine is the Custom Dashboards within the Overview section. As you become more familiar with the Insights UI, you'll notice that a thumbtack icon signifies that you can add the item to your own custom dashboards. This can include nodes, interfaces, flows, anomalies, endpoints, and more. Custom Dashboards offer quick and easy access to the critical views of the network that you want readily available at your fingertips.
Extra Task
As you progress through this lab guide and perform the defined steps, build your Custom Dashboard with elements you find important or interesting. At the end of the lab, review what you have created. Start by naming your dashboard based on your POD ID (for example: "POD-01") by clicking on the Add New Dashboard button.
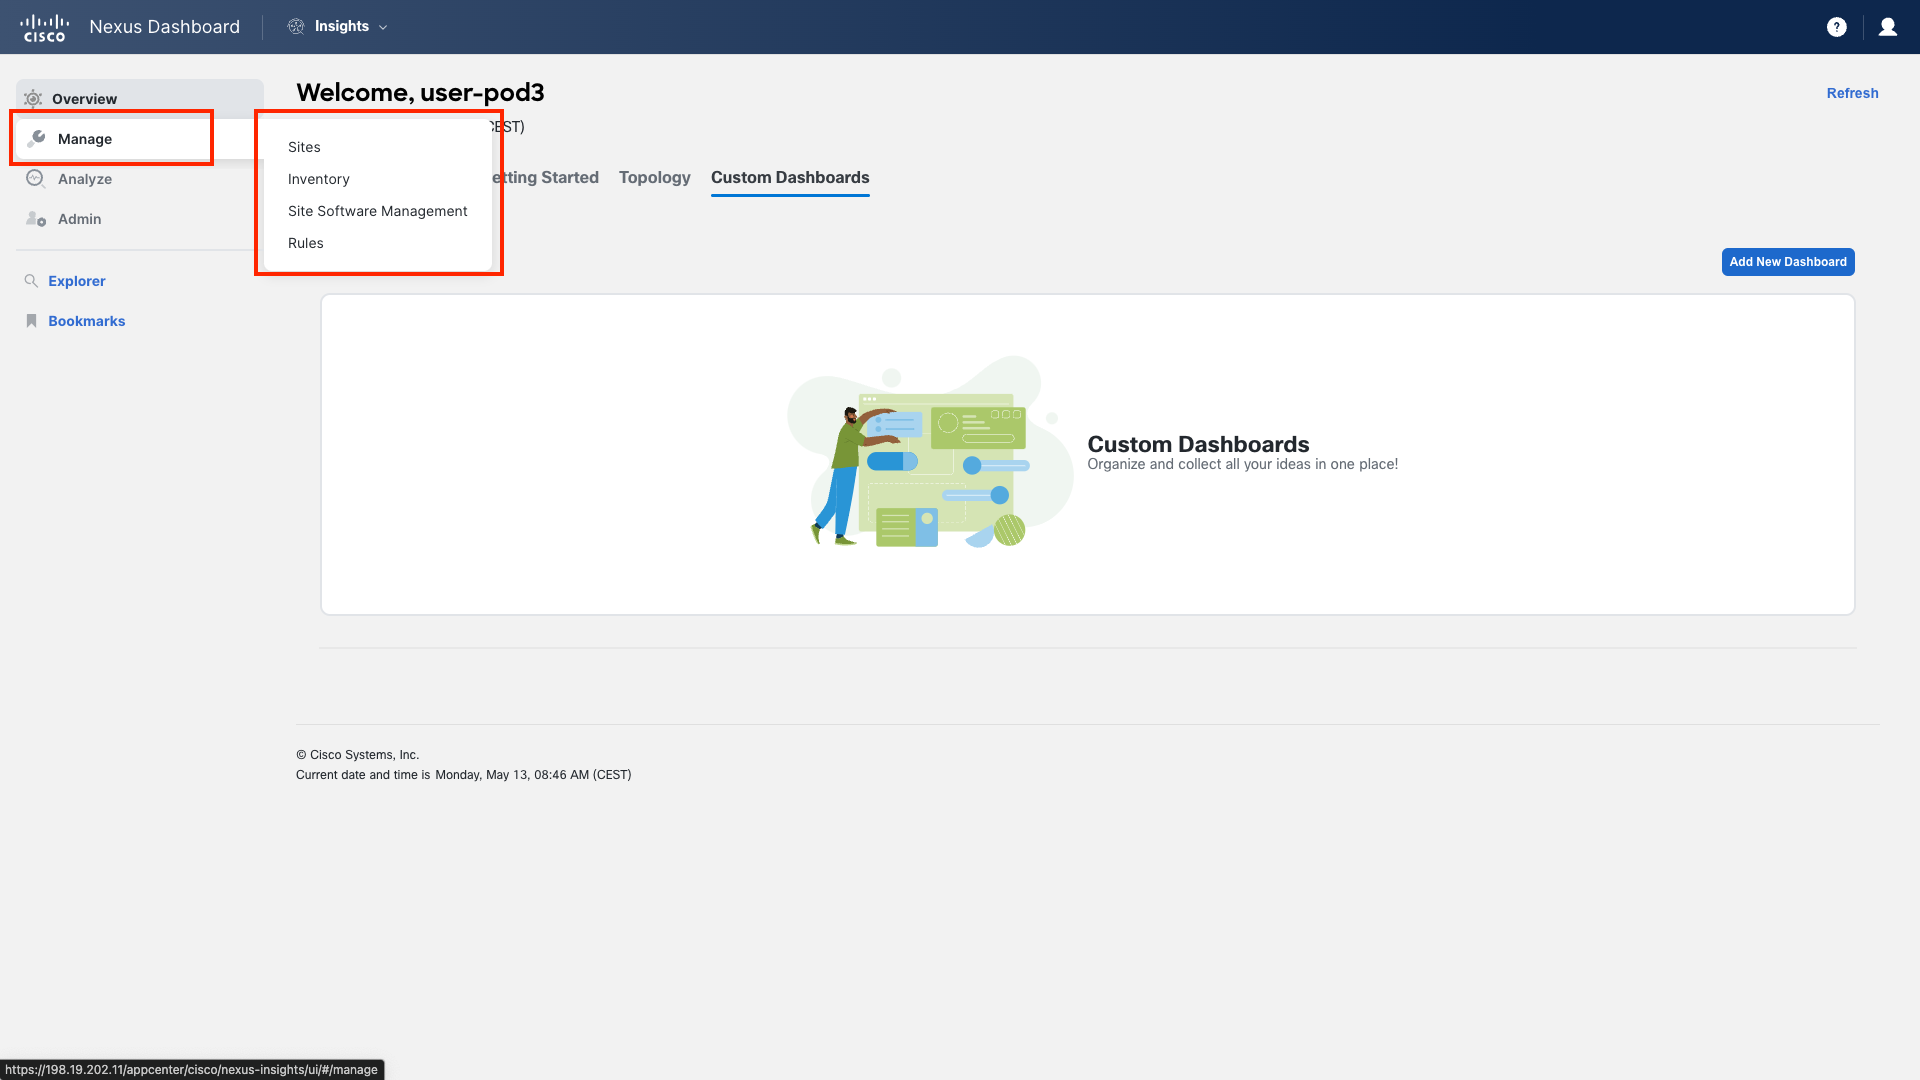
Step 6 - Manage
Continuing down the main menu, there is a section titled Manage. It consists of four subsections:
- Sites
- Inventory
- Site Software Management
- Rules
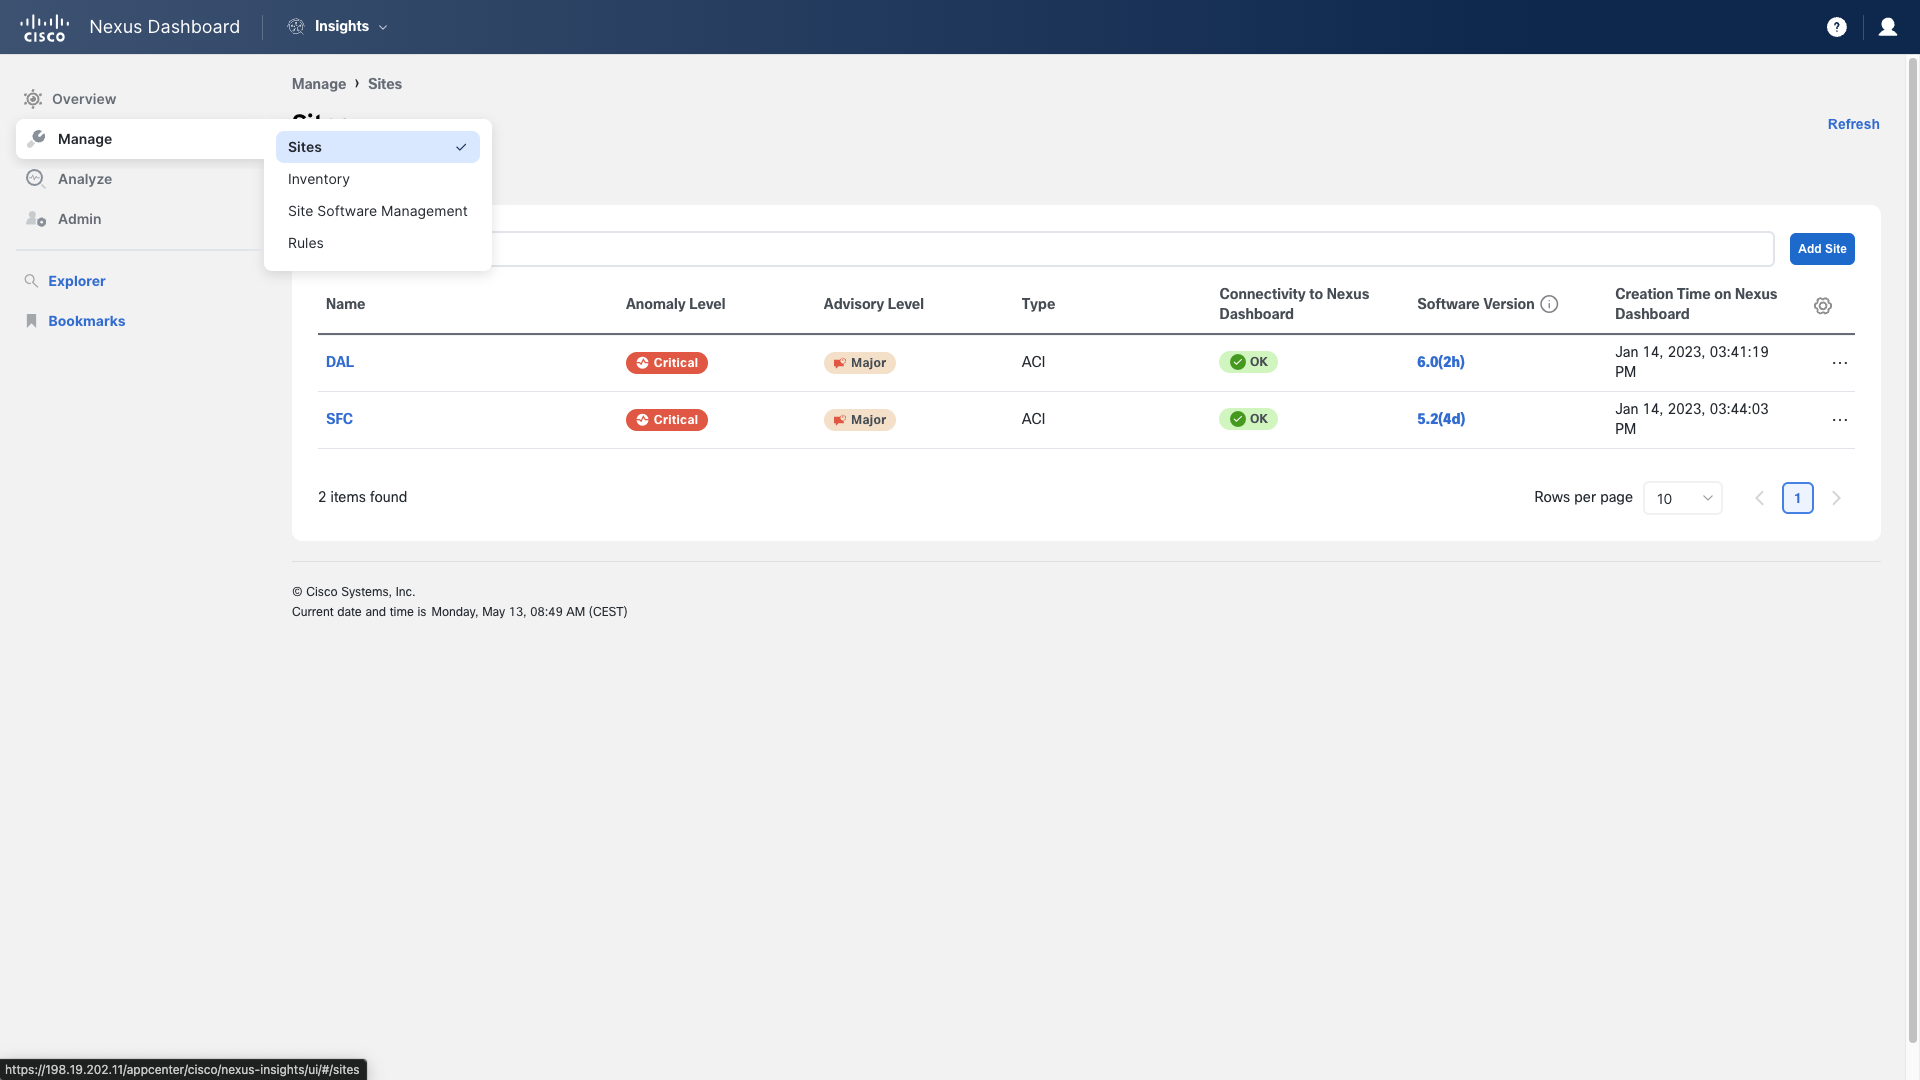
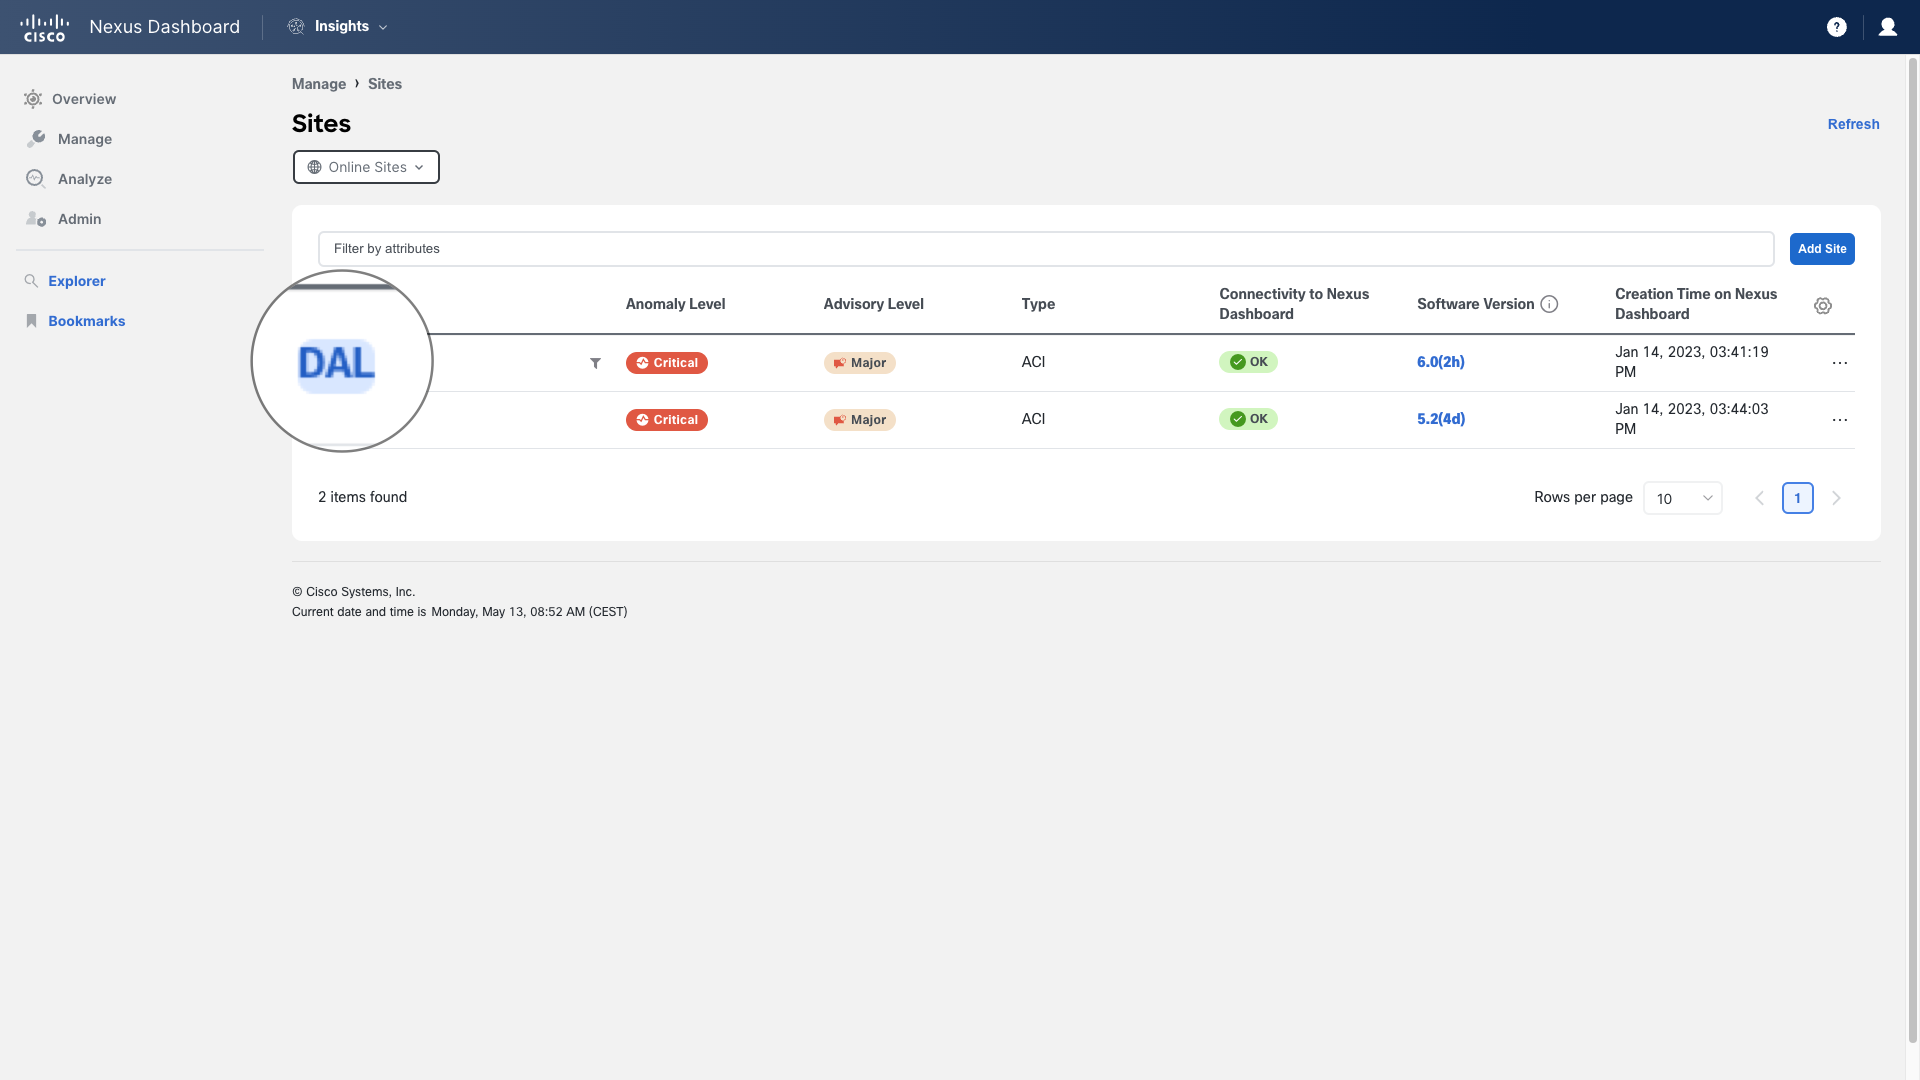
Step 7 - Sites
Let's start from Sites In our lab above we have two DC sites represented by DAL and SFC. You can see, they are ACI Fabrics and the versions of the code they are running.
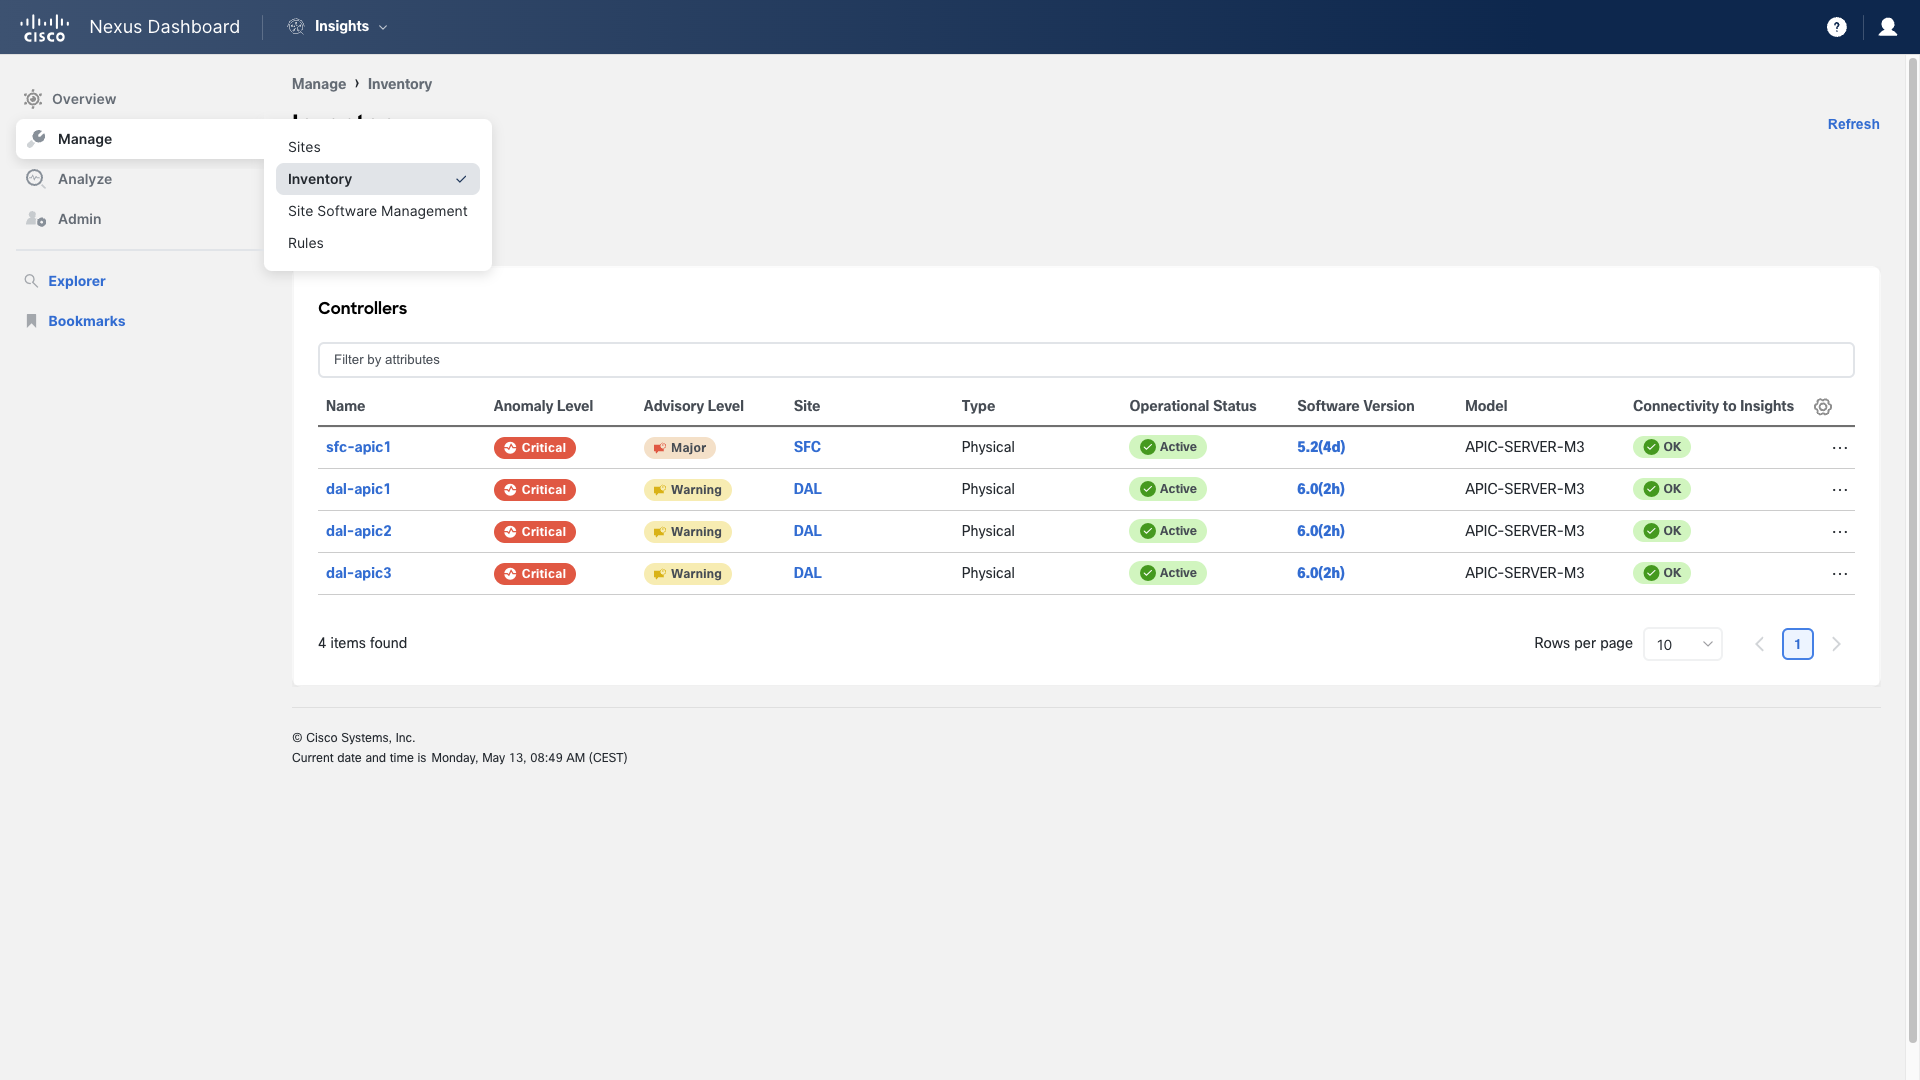
Step 8 - Inventory
In the Inventory section, items are grouped by Controllers (APIC only) and, in a separate tab, by Switches. This arrangement provides a quick way to view details such as model number, serial number, name, software version, and health status.
This is also a good time to introduce the filter function of NDI. In nearly every part of the UI, you will find a filter bar. Clicking in the filter bar will display a list of relevant attributes for the current view. You can filter using criteria such as "equals," "does not equal," "contains," or "does not contain." For practice, in the Switches inventory view, try filtering by the Model attribute to retrieve a list of all nodes that contain "FX2." Filters enable you to tailor NDI to display only the data you're most interested in at any given moment. Filters are quite powerful, allowing NDI to not only reveal a wealth of data but also to help you concentrate on immediate areas of interest.
Step 9 - Site Software Management
- Software Management allows for proactive firmware analysis of your fabrics before you proceed with an upgrade. We will delve into this feature in a separate use case later in this lab.
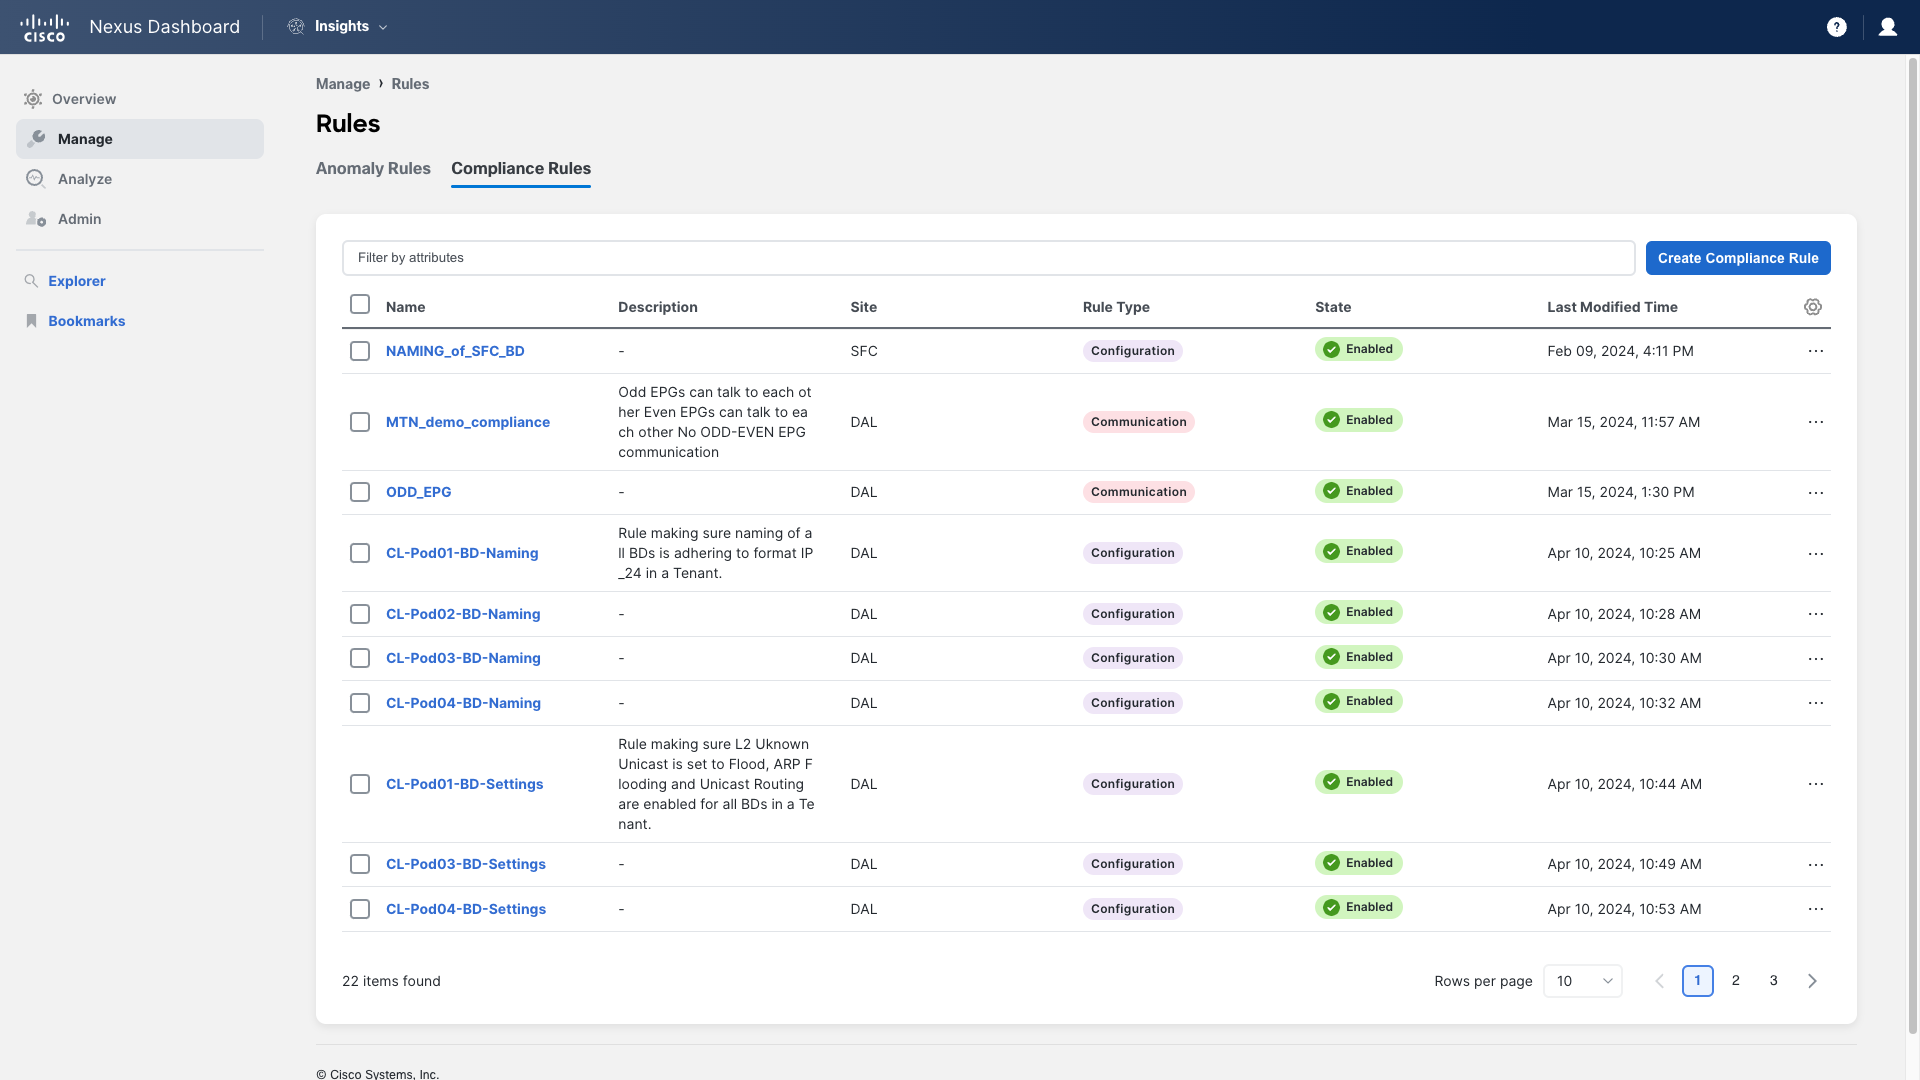
Step 10 - Rules
The Rules section is divided into two parts: Anomaly Rules and Compliance Rules. Here, you can configure rules that are utilized by other features. Anomaly rules enable you to define and identify anomalies you wish to exclude from your anomaly view by tagging those anomalies with an acknowledge flag. This provides control over what you consider significant and what you wish to minimize as noise.
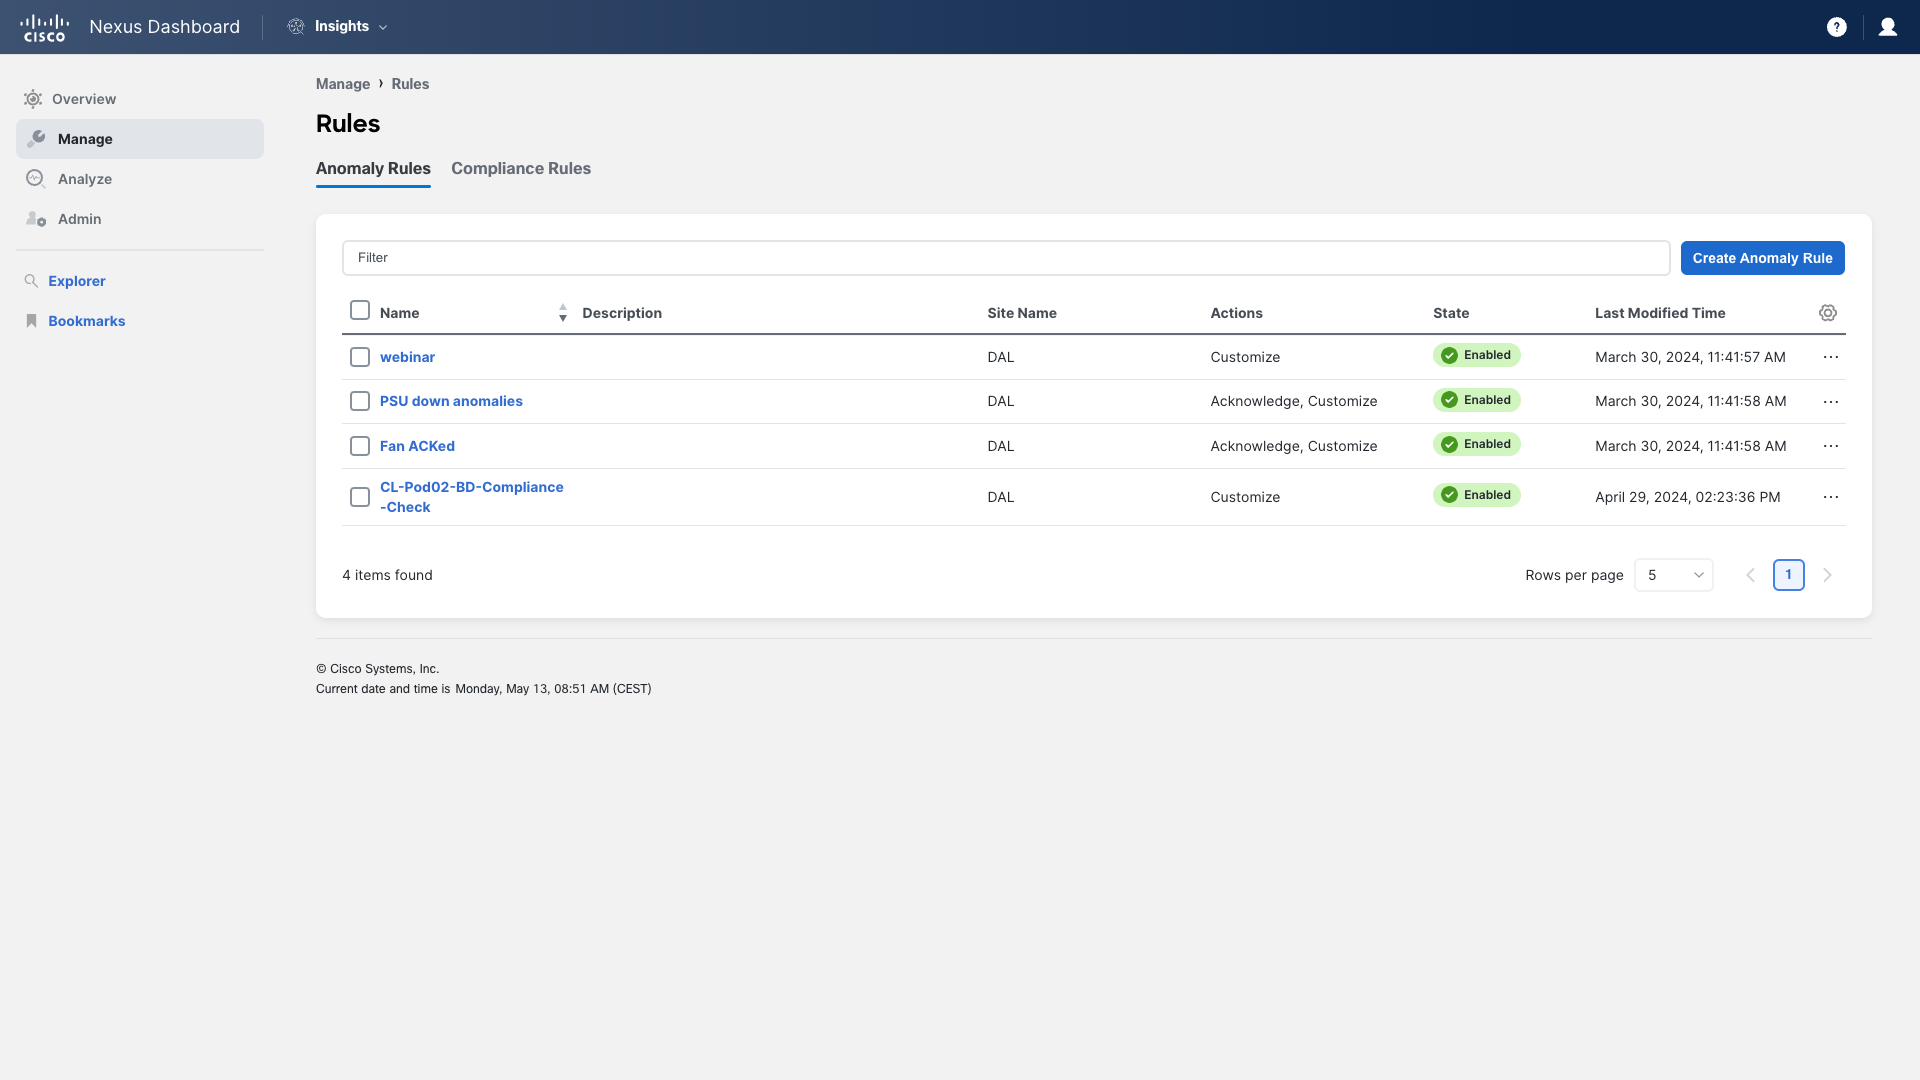
With Compliance rules, you can establish your "golden" configuration and communication template for your network and perform audits against it. We will explore this further in a separate use case later.
Step 11 Site Deep Dive
Let's return to the Sites view. In the Sites view, you can see all fabrics managed by Nexus Dashboard Insights. By clicking on the three dots on the right side, you have the options to edit the site, cross-launch to APIC with single sign-on, or view the system status for that site. Let's navigate to the DAL site by clicking on its name.
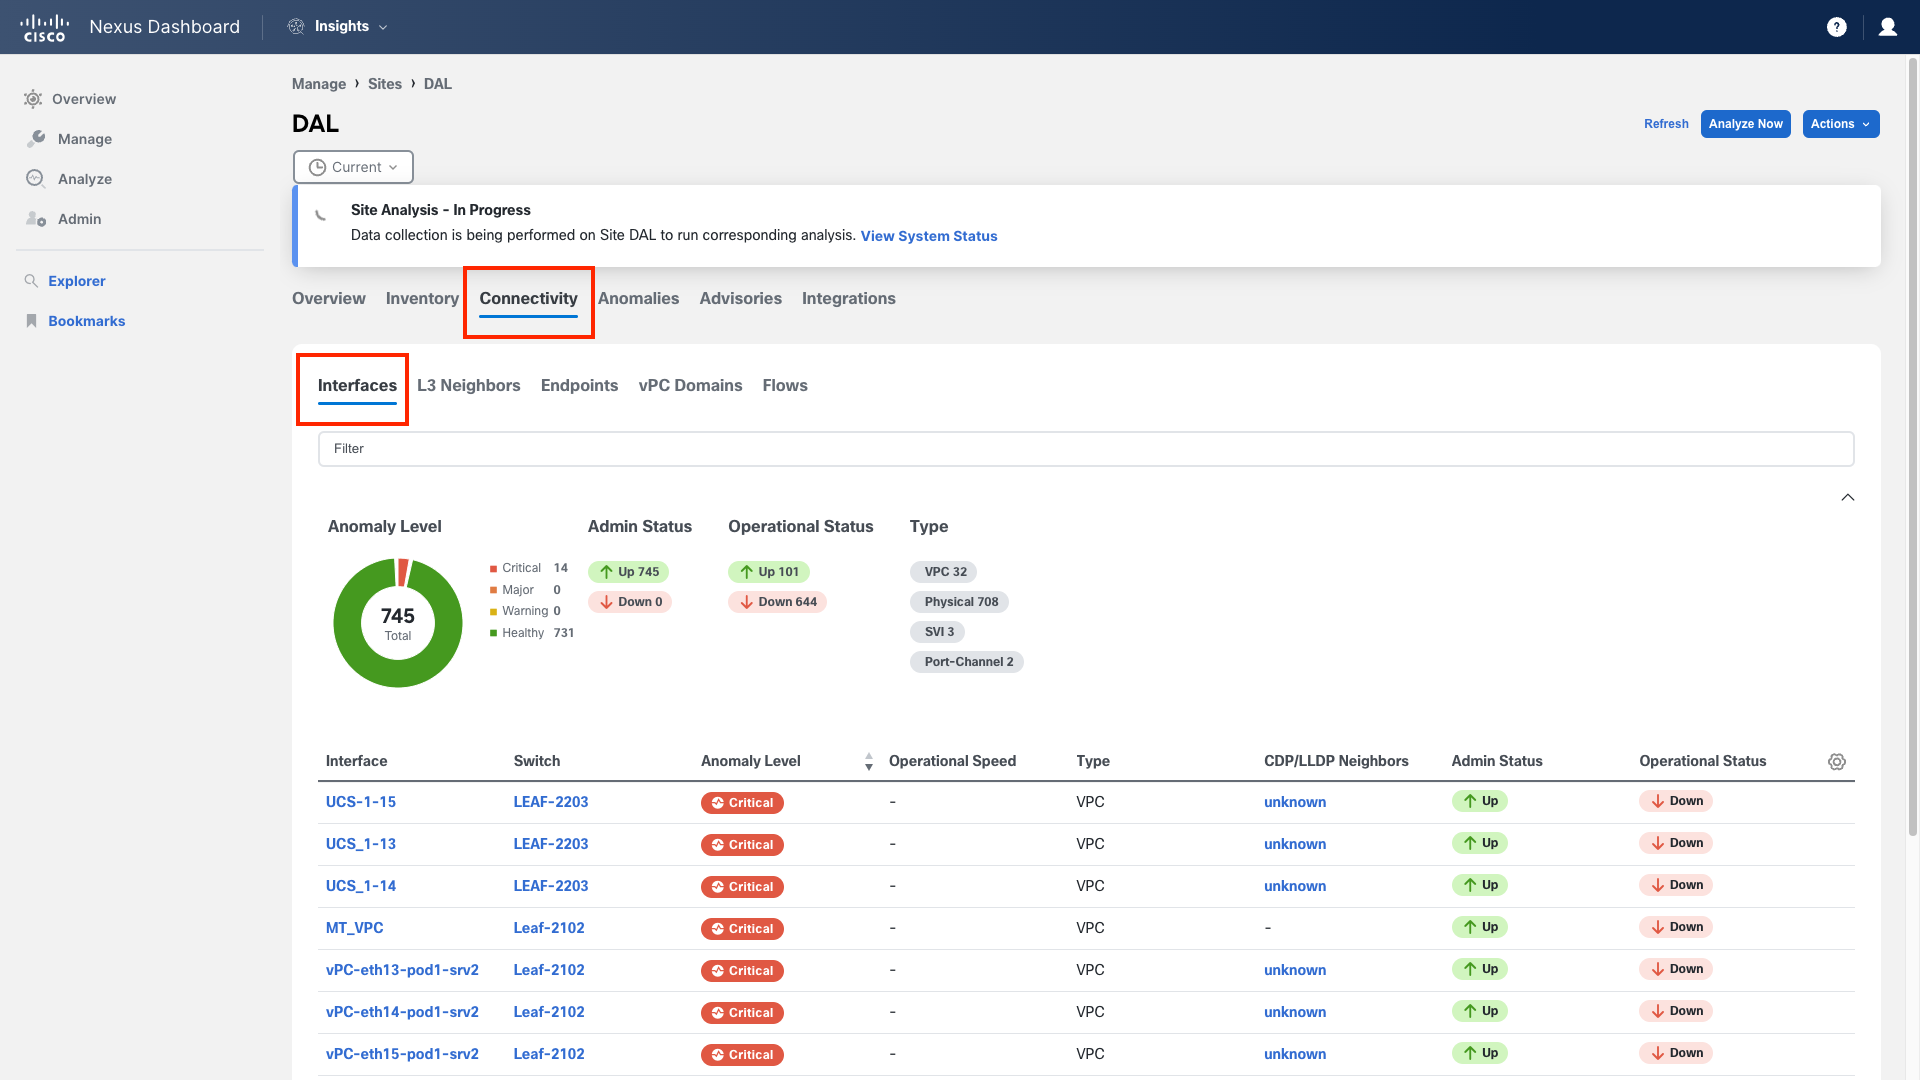
Under each site, you will find relevant tabs such as Overview, Inventory, Connectivity, Anomalies, Advisories, and Integrations. Each tab provides insights specific to that site, helping you to manage it more efficiently. For instance, under Connectivity, you can discover a range of information from individual port statuses to endpoint conditions, or you can investigate flows within your fabric.
Extra Task
Feel free to explore and familiarize yourself with the DAL ACI site, which you will use throughout the remainder of this lab.
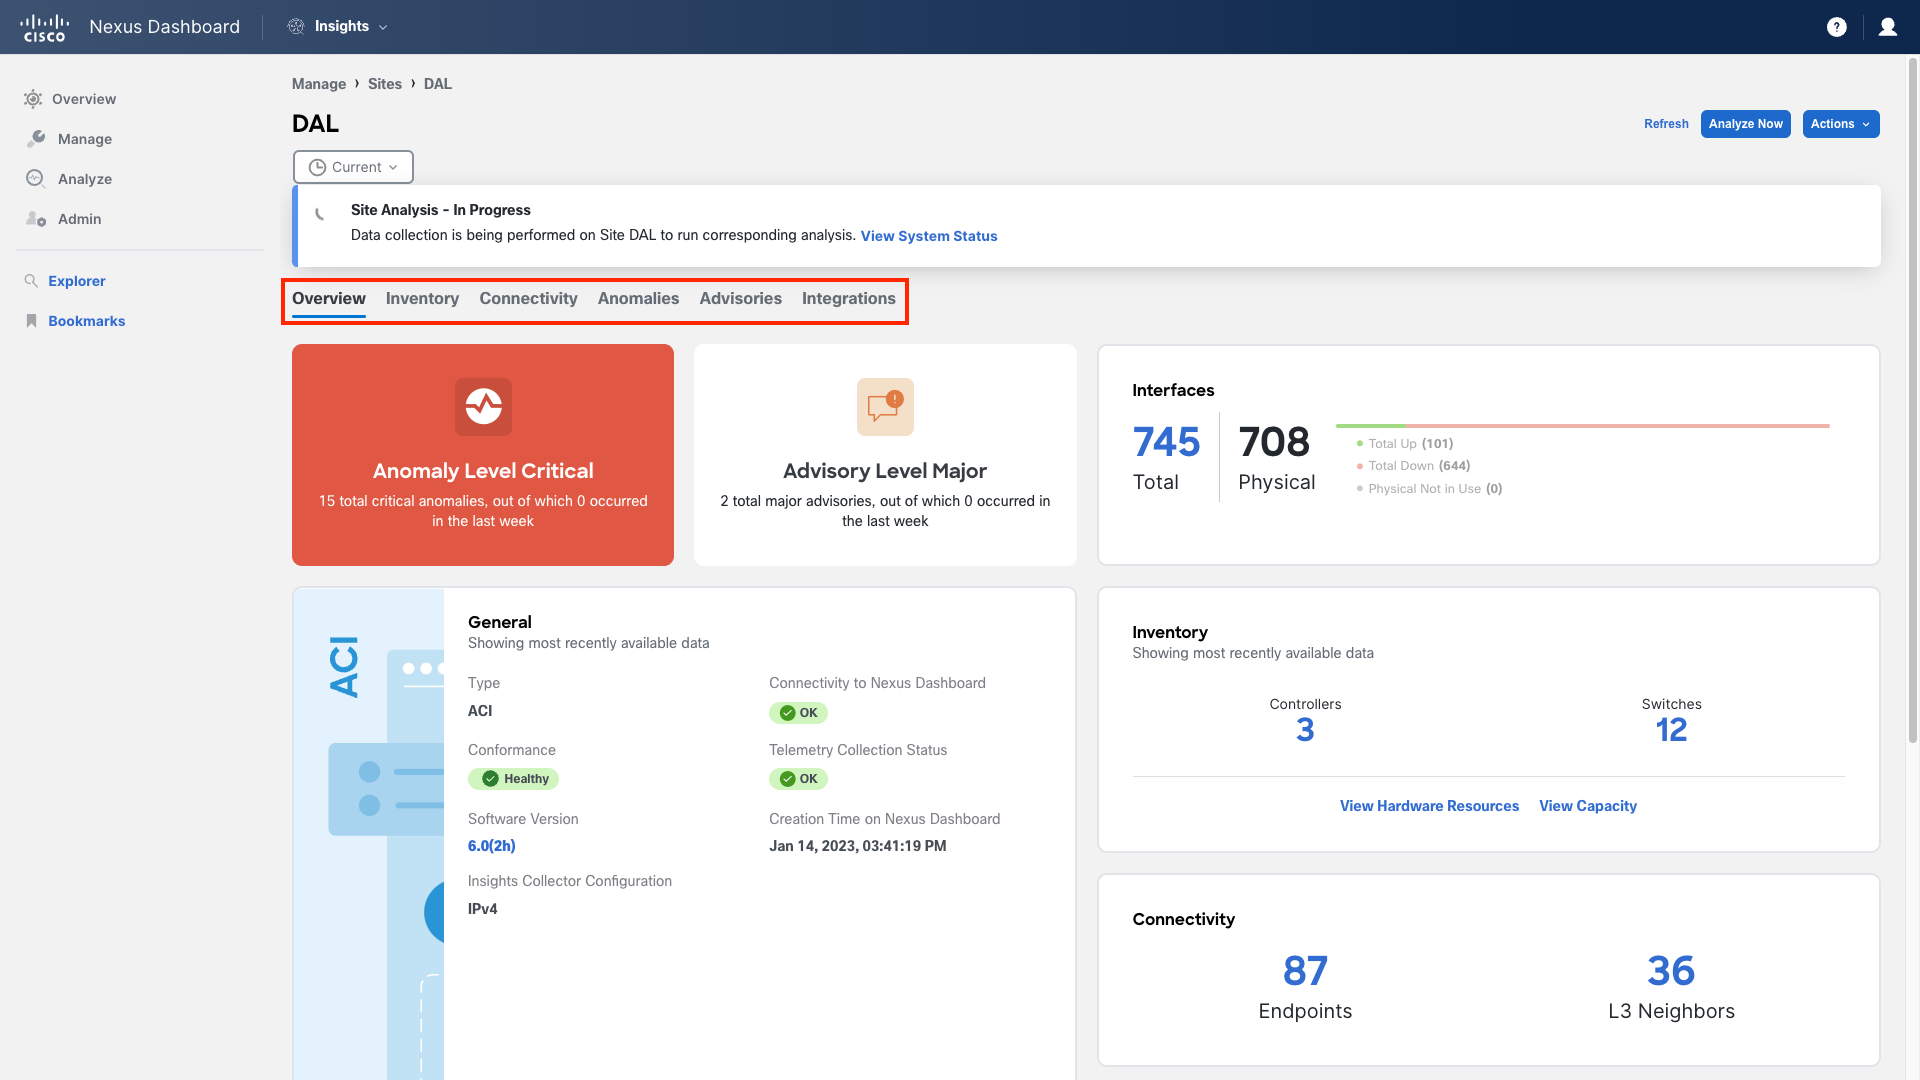
Here's our first detailed look at the DAL site. Navigate using the menus across the top or click on specific data points. Everything is interconnected within Insights.
From the blue Actions button in the top right corner you can access additional functions, as example: The System Status delivers crucial information about the state of various collections and streaming telemetry from the fabric, which most data shown in Nexus Dashboard Insights relies upon.
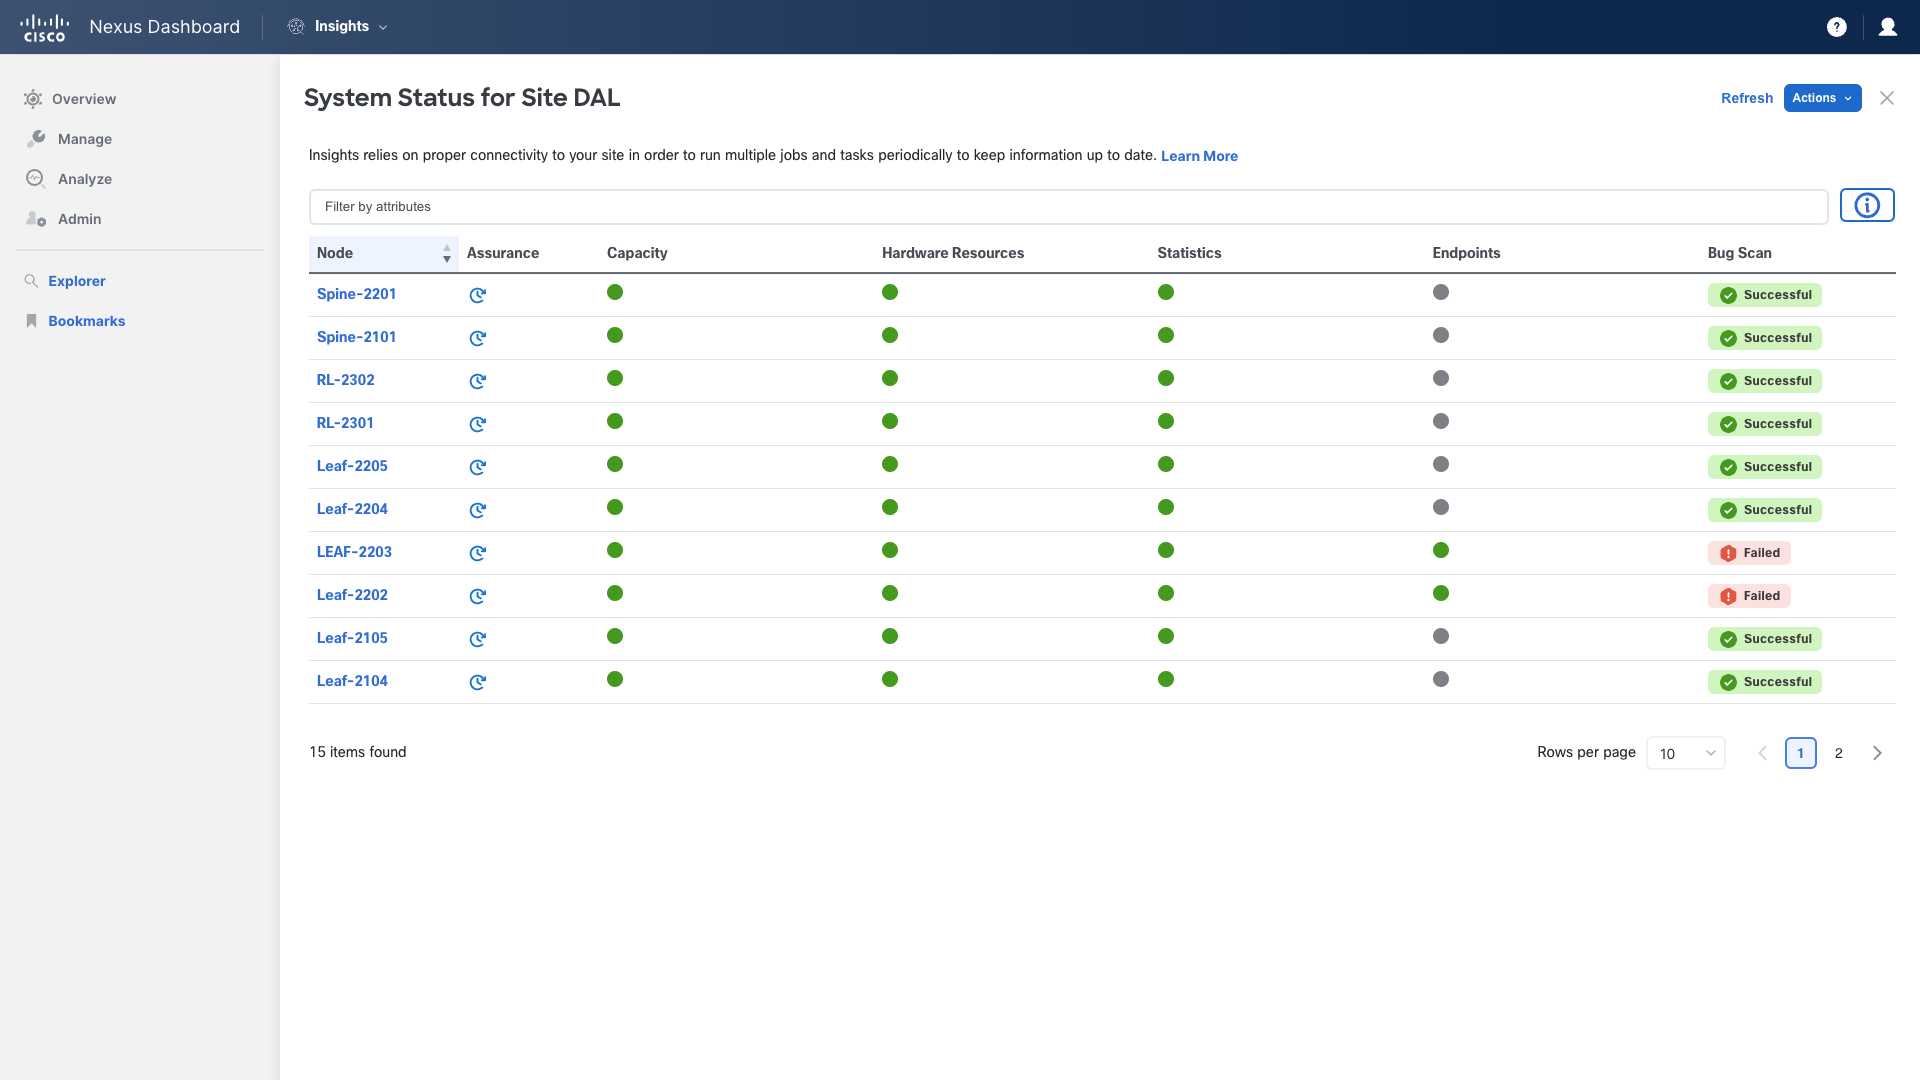
Don't get scared
If you notice that some devices are not receiving telemetry data, it could be because those devices have nothing to send. For example, endpoint telemetry data is sent only when there is an endpoint discovery, rediscovery, or flush.
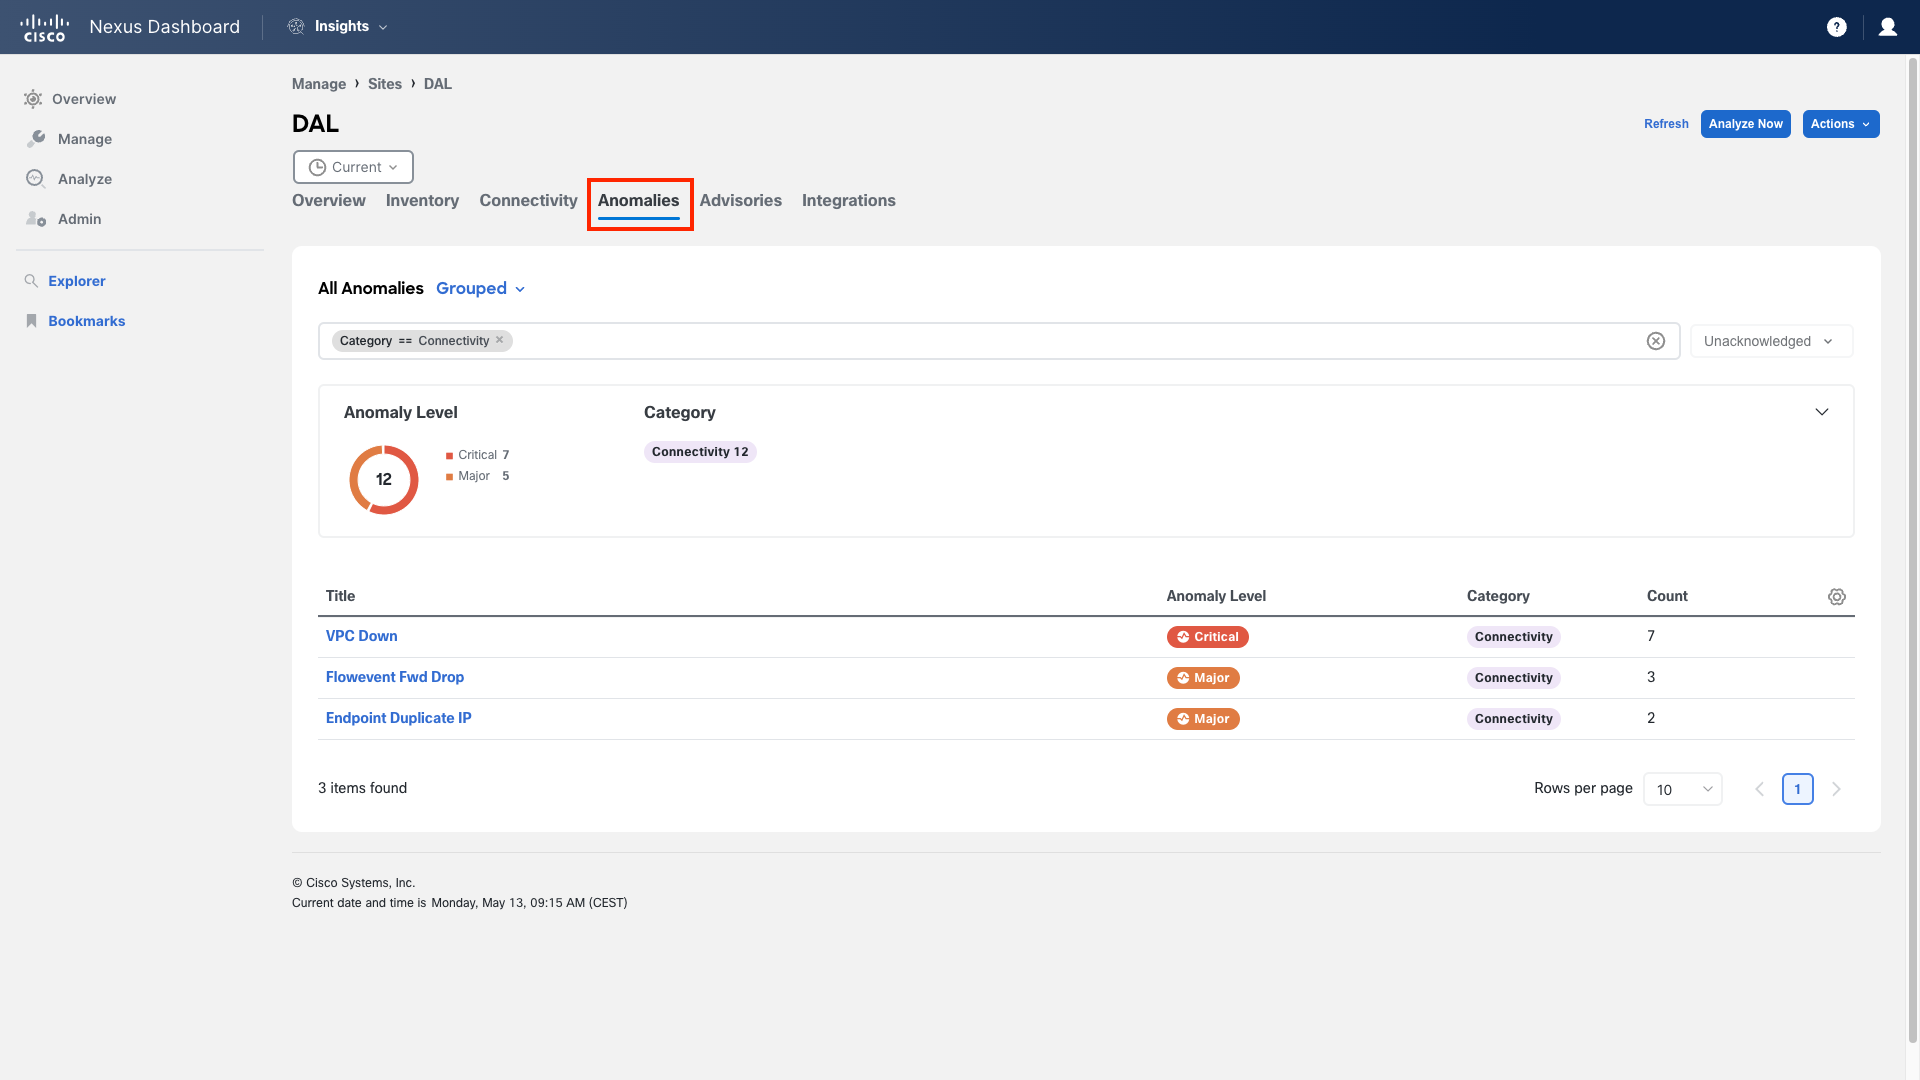
Step 12 Site Anomalies
The anomalies view is an area where you will likely spend a significant amount of time.
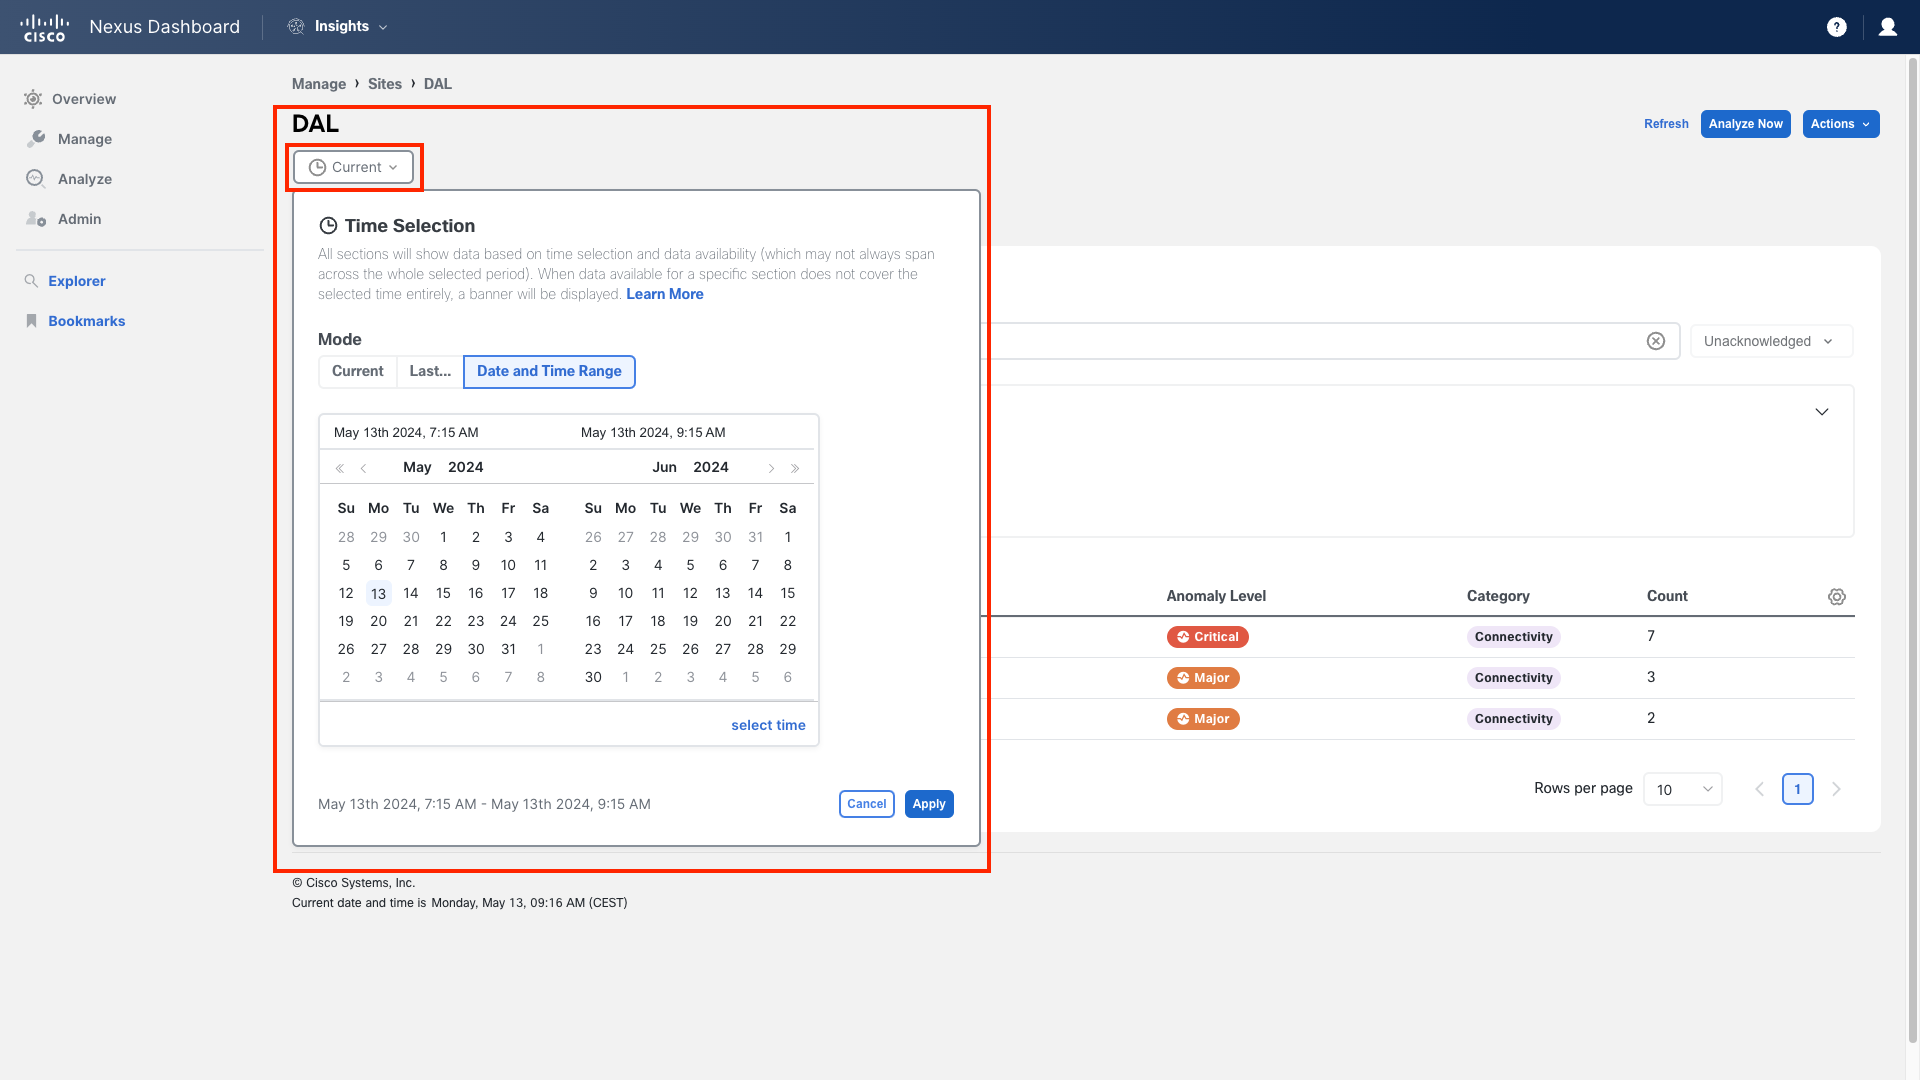
If you have experience with Nexus Dashboard prior to release 3.1, you'll recall that the selected time frame was an important part of the UI, with all displayed data defined by this time frame. This has changed with the new UI. Time-frame selection is now possible in those views and dashboards where it is most relevant, such as under a specific site when viewing Flows, Anomalies, or Advisories. This feature is useful when you need to identify a particular date or time range to display only the details you are interested in. Like filters, the time range is another way to adjust the level of detail that Insights will show you. Experiment by changing the time frame to better understand your options.
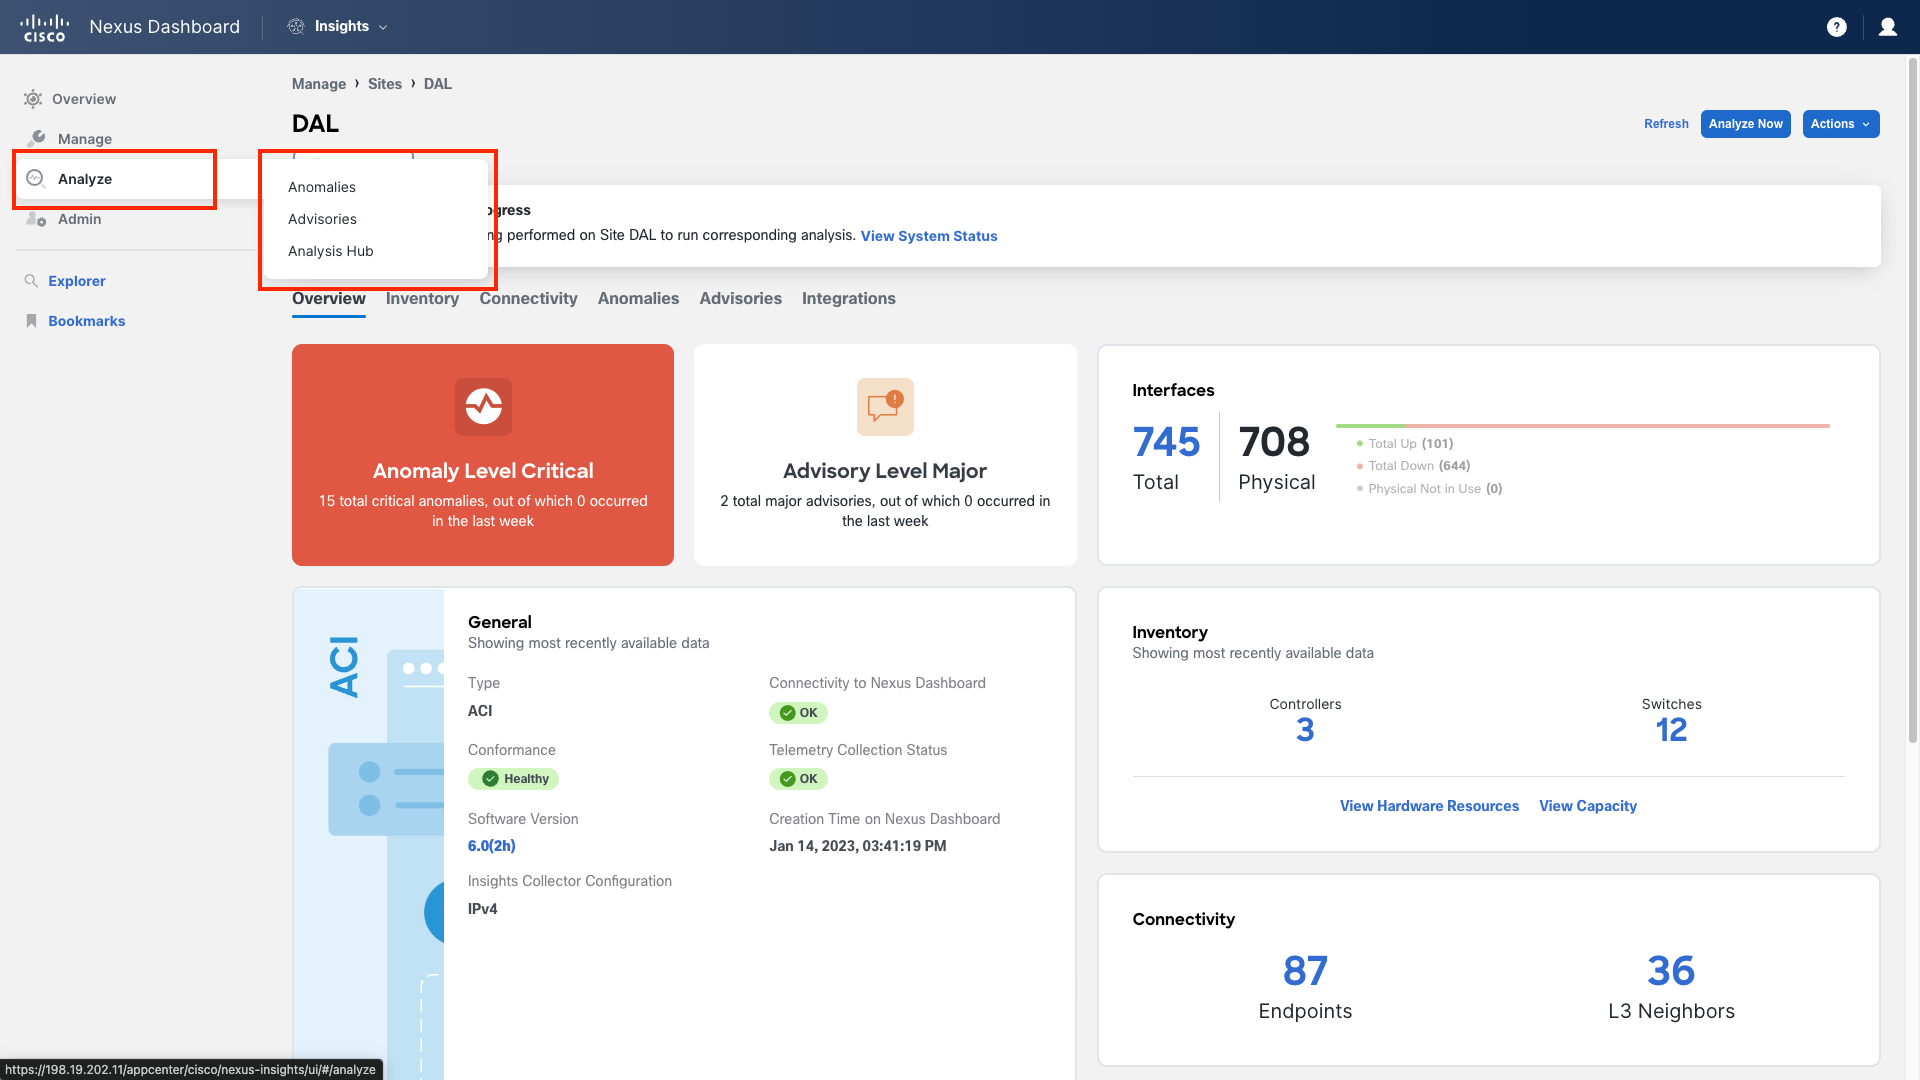
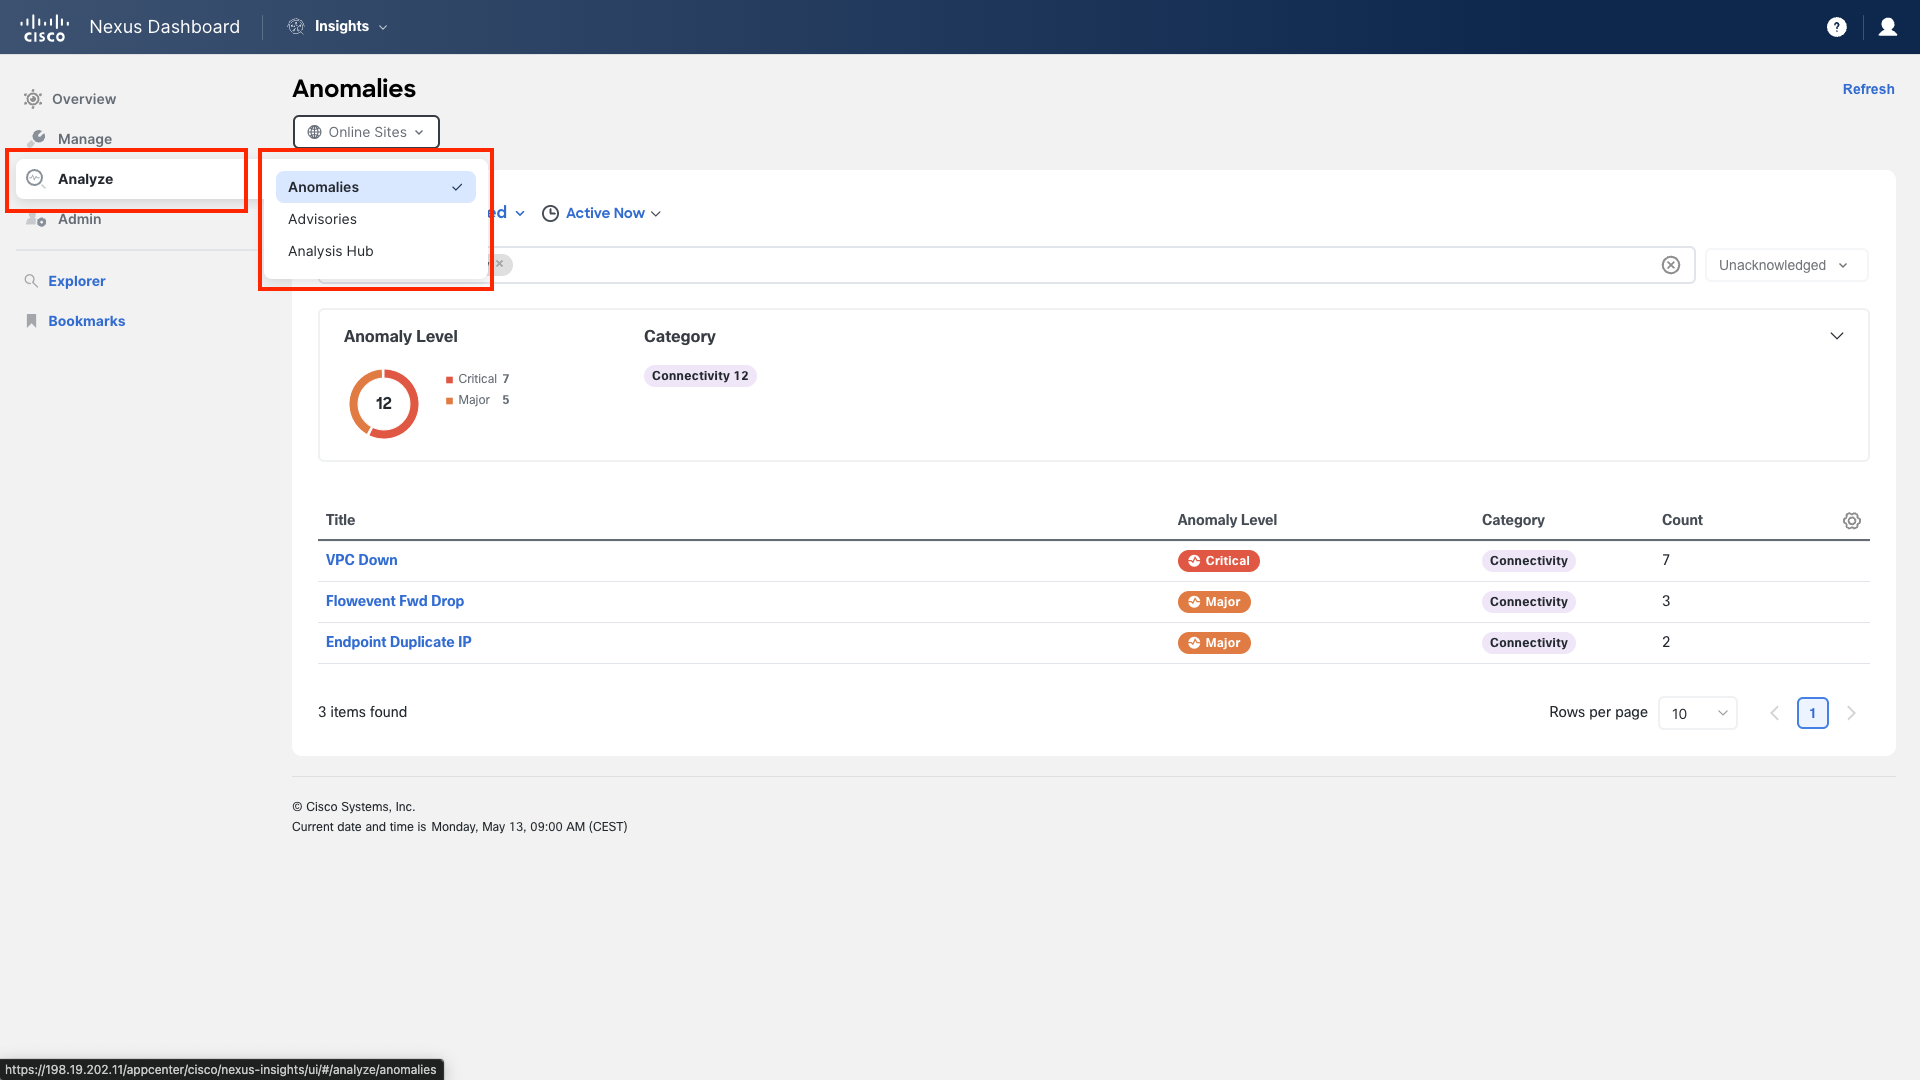
Step 13 - Analyze
The Analyze section is at the heart of Nexus Dashboard Insights. In addition to directly accessing views for Anomalies and Advisories, this is where you can discover highly valuable key capabilities within the Analysis Hub, such as Compliance, Conformance, Connectivity, Pre-Change, and Delta analysis. You will become familiar with these throughout this lab.
Step 14 - Anomalies
All anomalies identified across all sites onboarded into Nexus Dashboard Insights are displayed here. Users can filter, comment on, and acknowledge these anomalies from this view. You will test later during the lab.
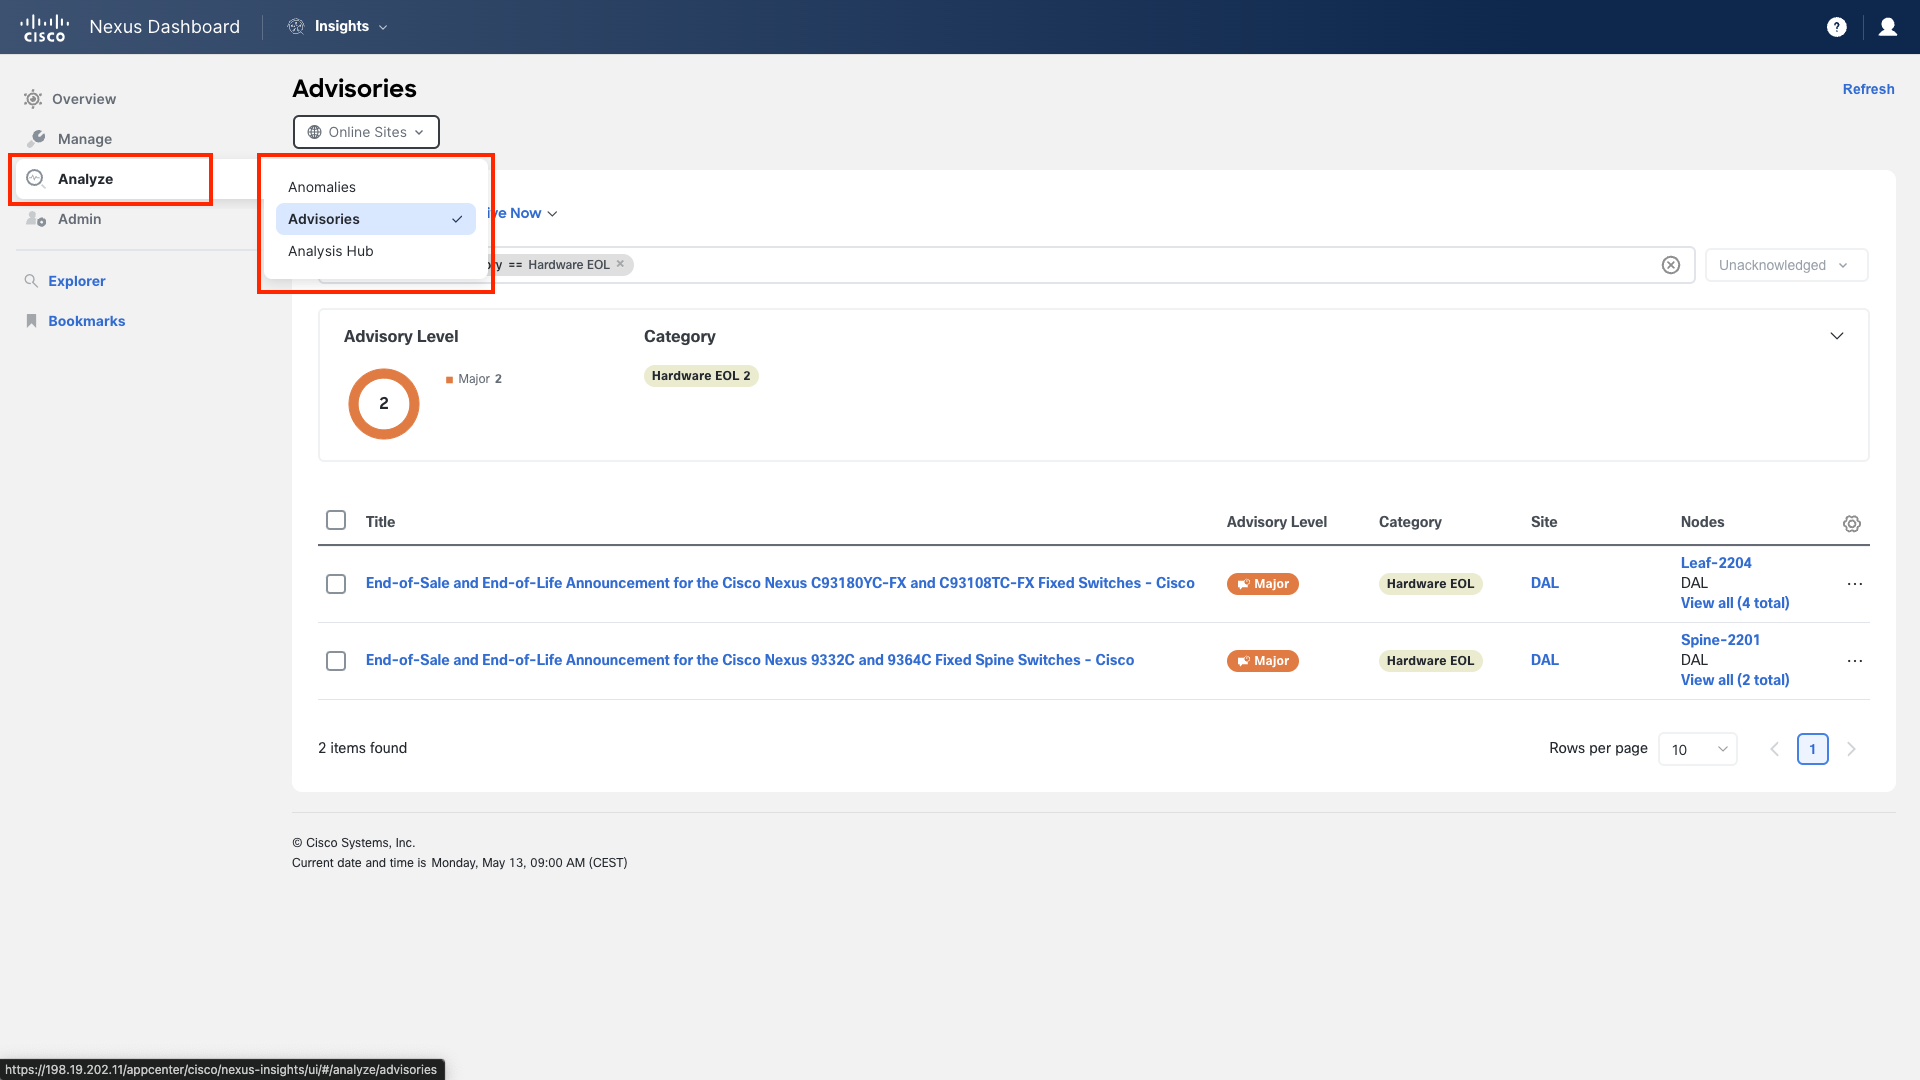
Step 15 - Advisories
Advisories assist us in quickly determining whether there is a significant security issue, advisory notice, or end-of-life announcement affecting our sites.
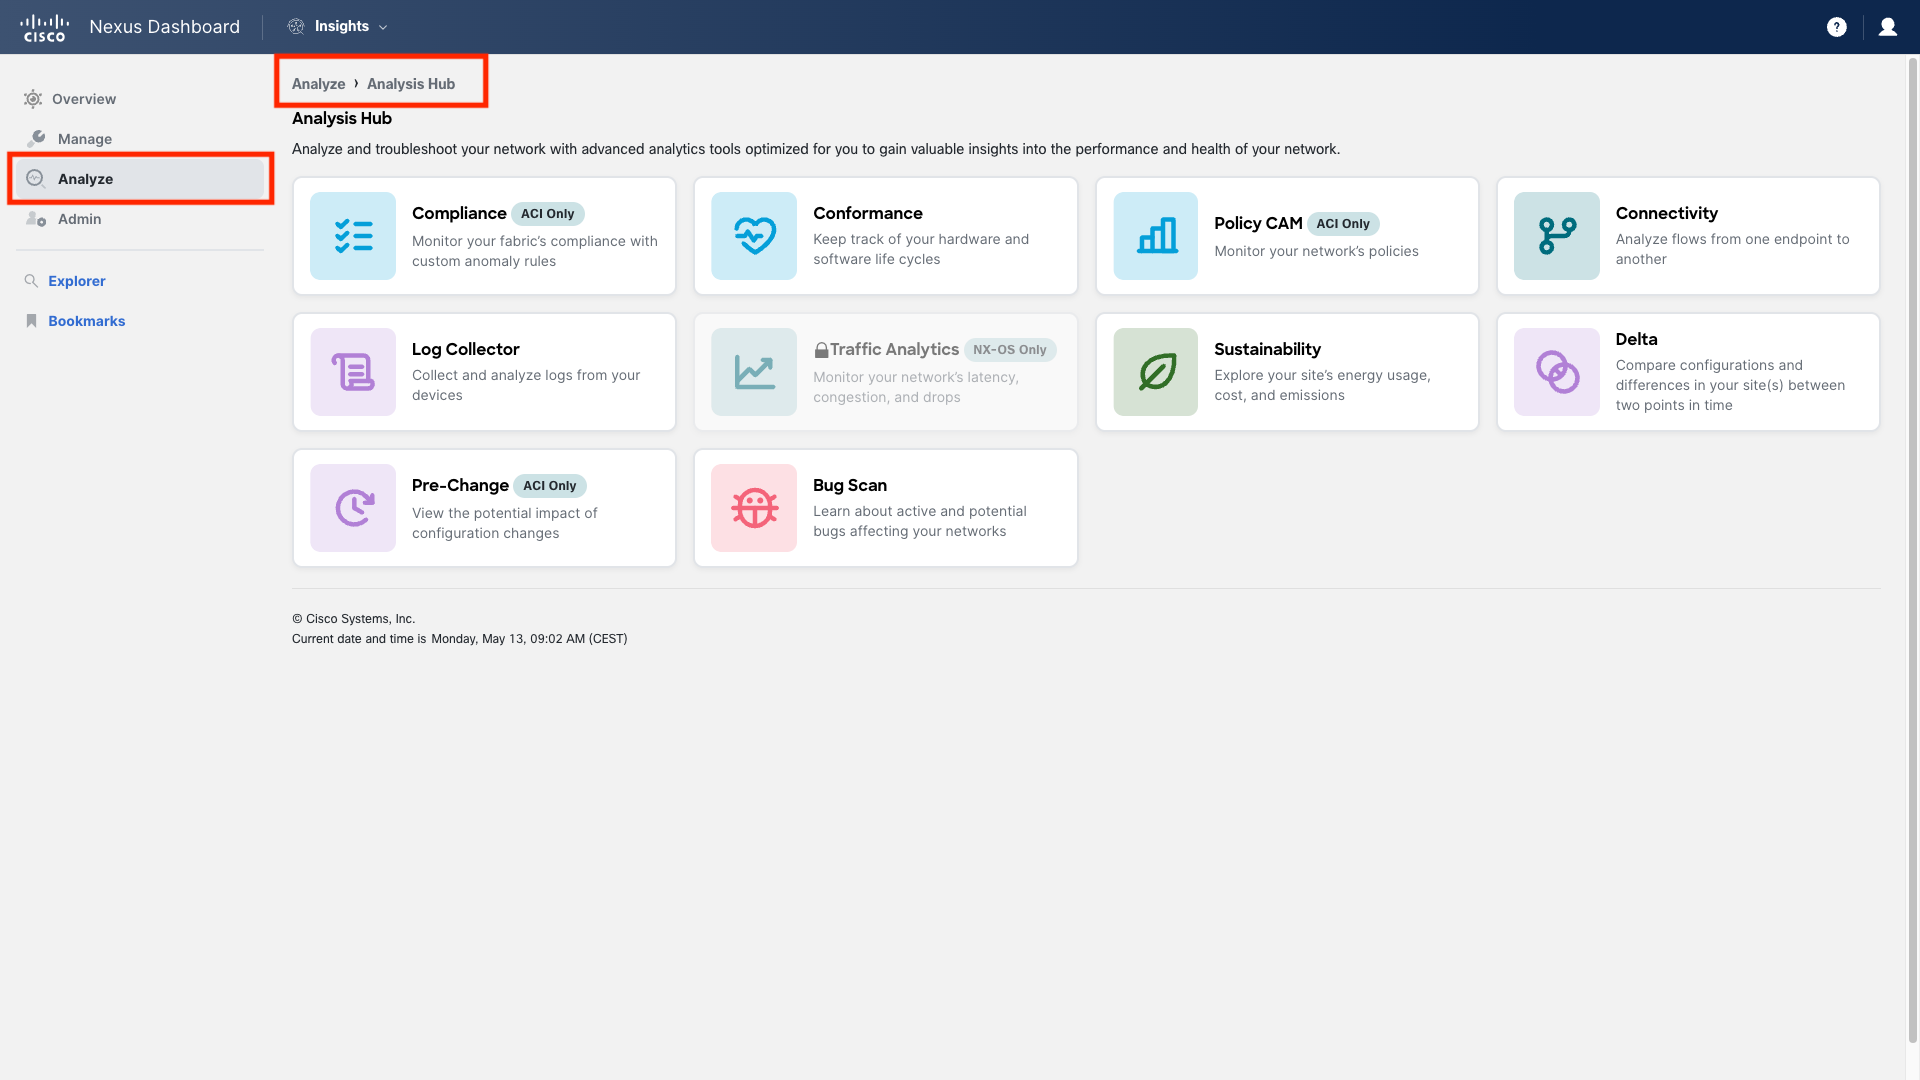
Step 16 - Analysis Hub
The Analysis Hub houses many of the advanced and correlated tools. These tools are crafted to utilize the diverse sources of telemetry gathered by Insights and apply analysis to enable more sophisticated actions. Throughout this lab, you will learn about use cases that take advantage of these capabilities.
Step 17 - Admin
The final major section is named Admin. This is where you can manage various features or the Nexus Dashboard Insights platform itself. The subsections include:
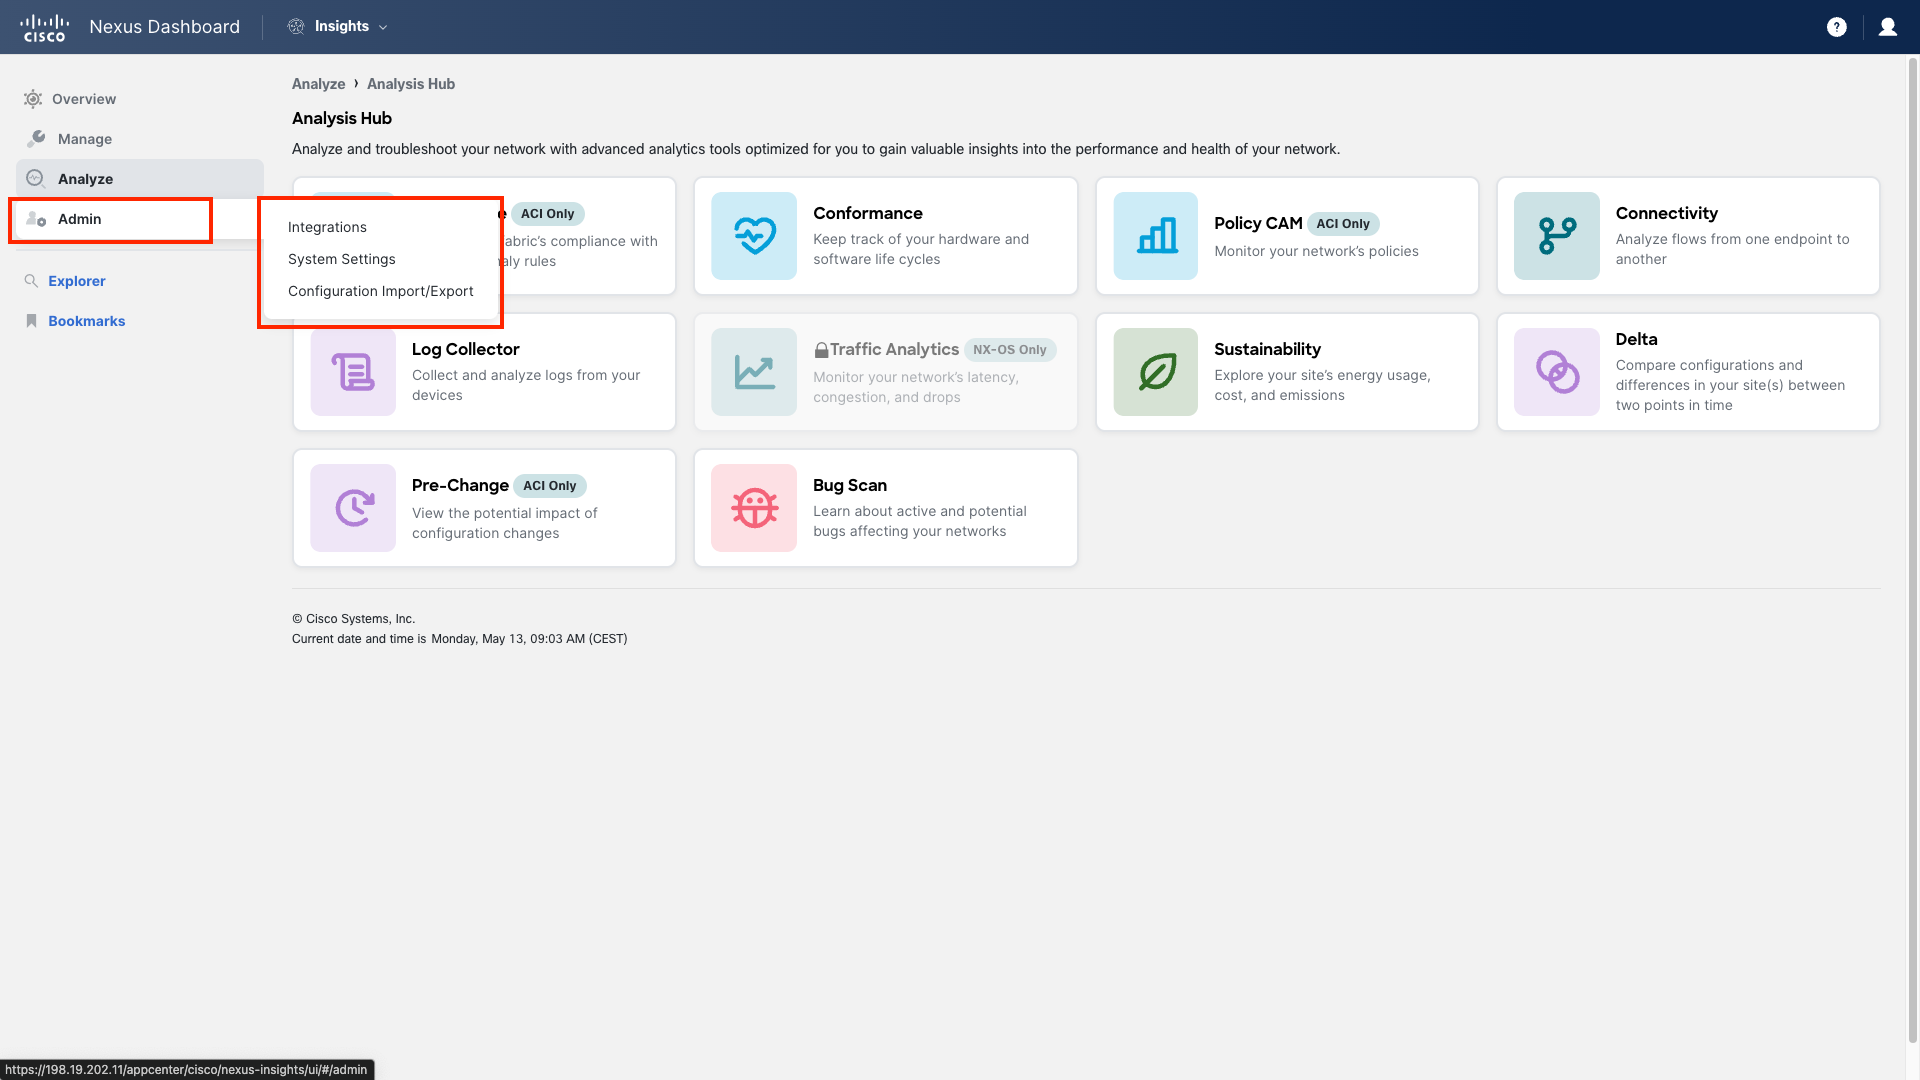
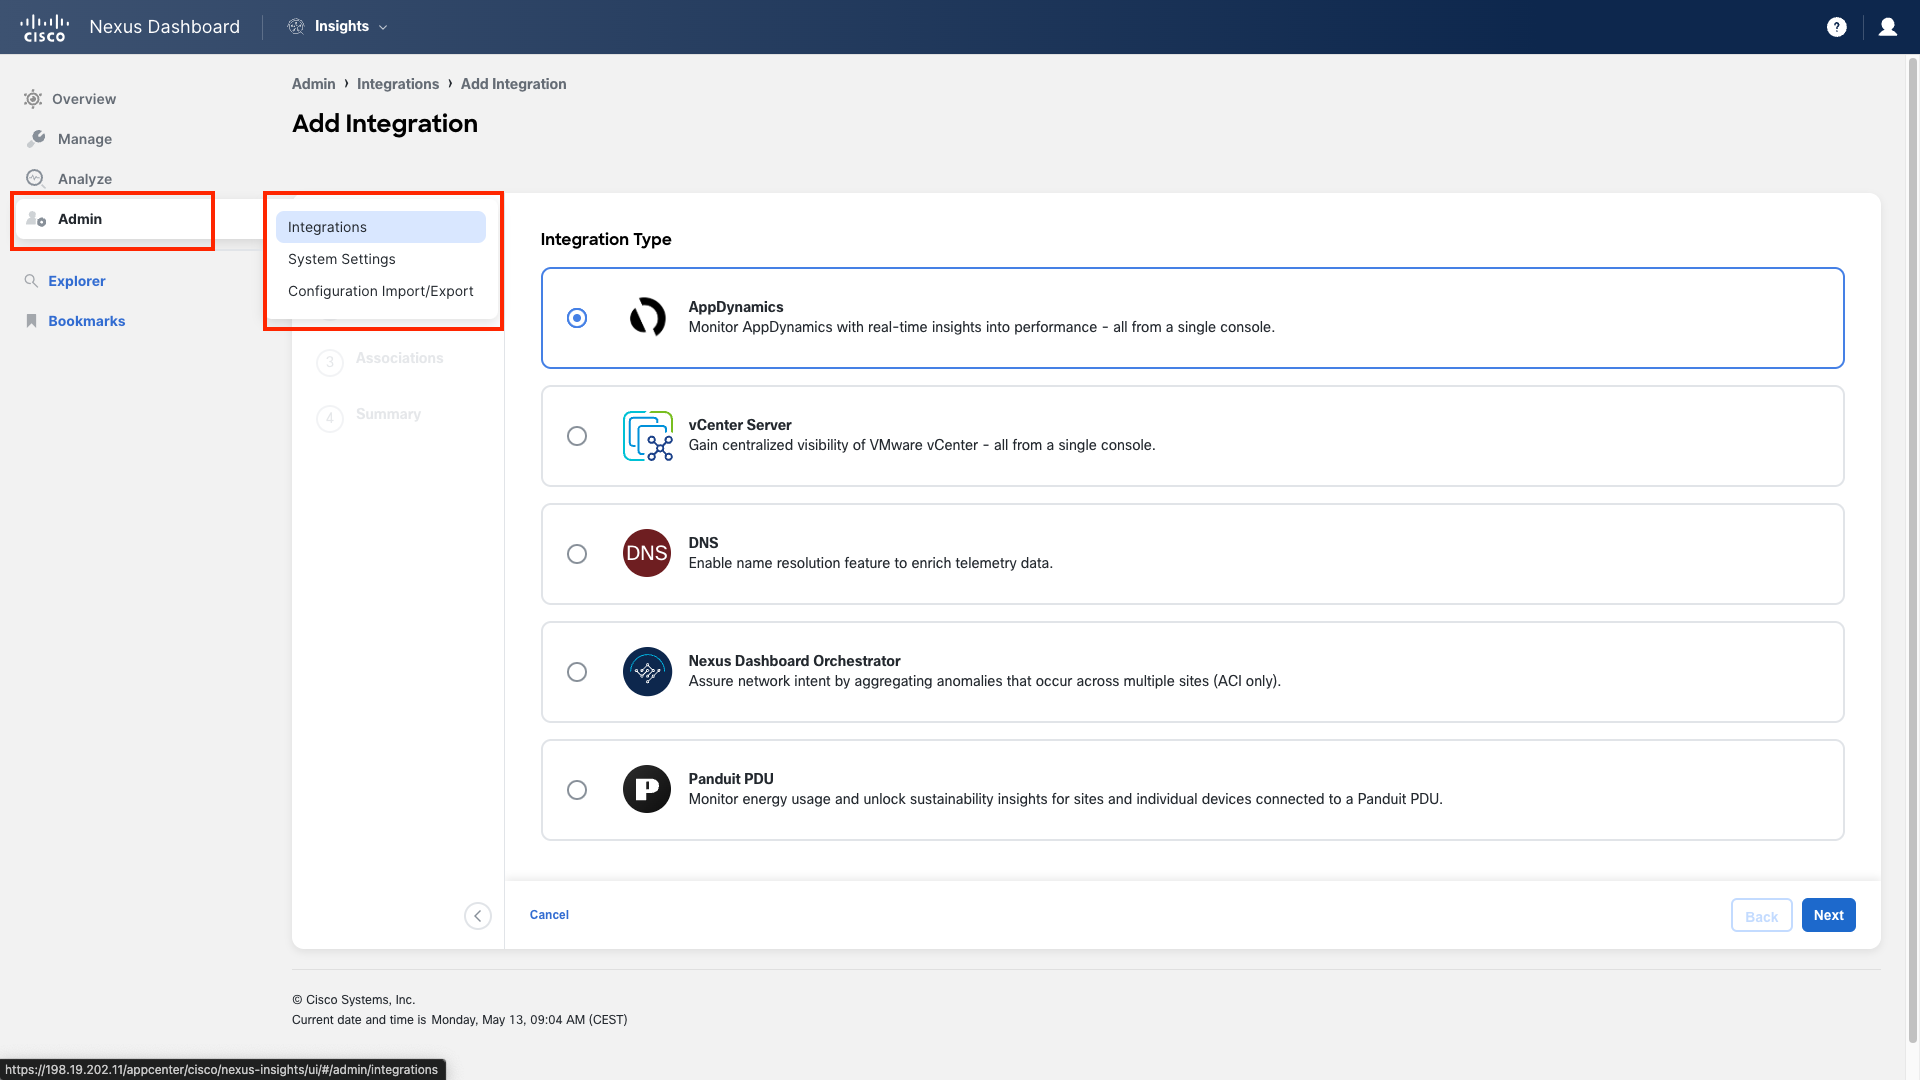
Step 18 - Integrations
In Integrations, you can establish various available integrations with Nexus Dashboard Insights—DNS, vCenter, AppDynamics, or Nexus Dashboard Orchestrator. Note that in this lab, we have already integrated Insights with VMware's vCenter, which enables us to augment telemetry data from the virtual environment to present a more comprehensive picture. Integrations with external tools and data sources enhance the scope and effectiveness of the insights provided.
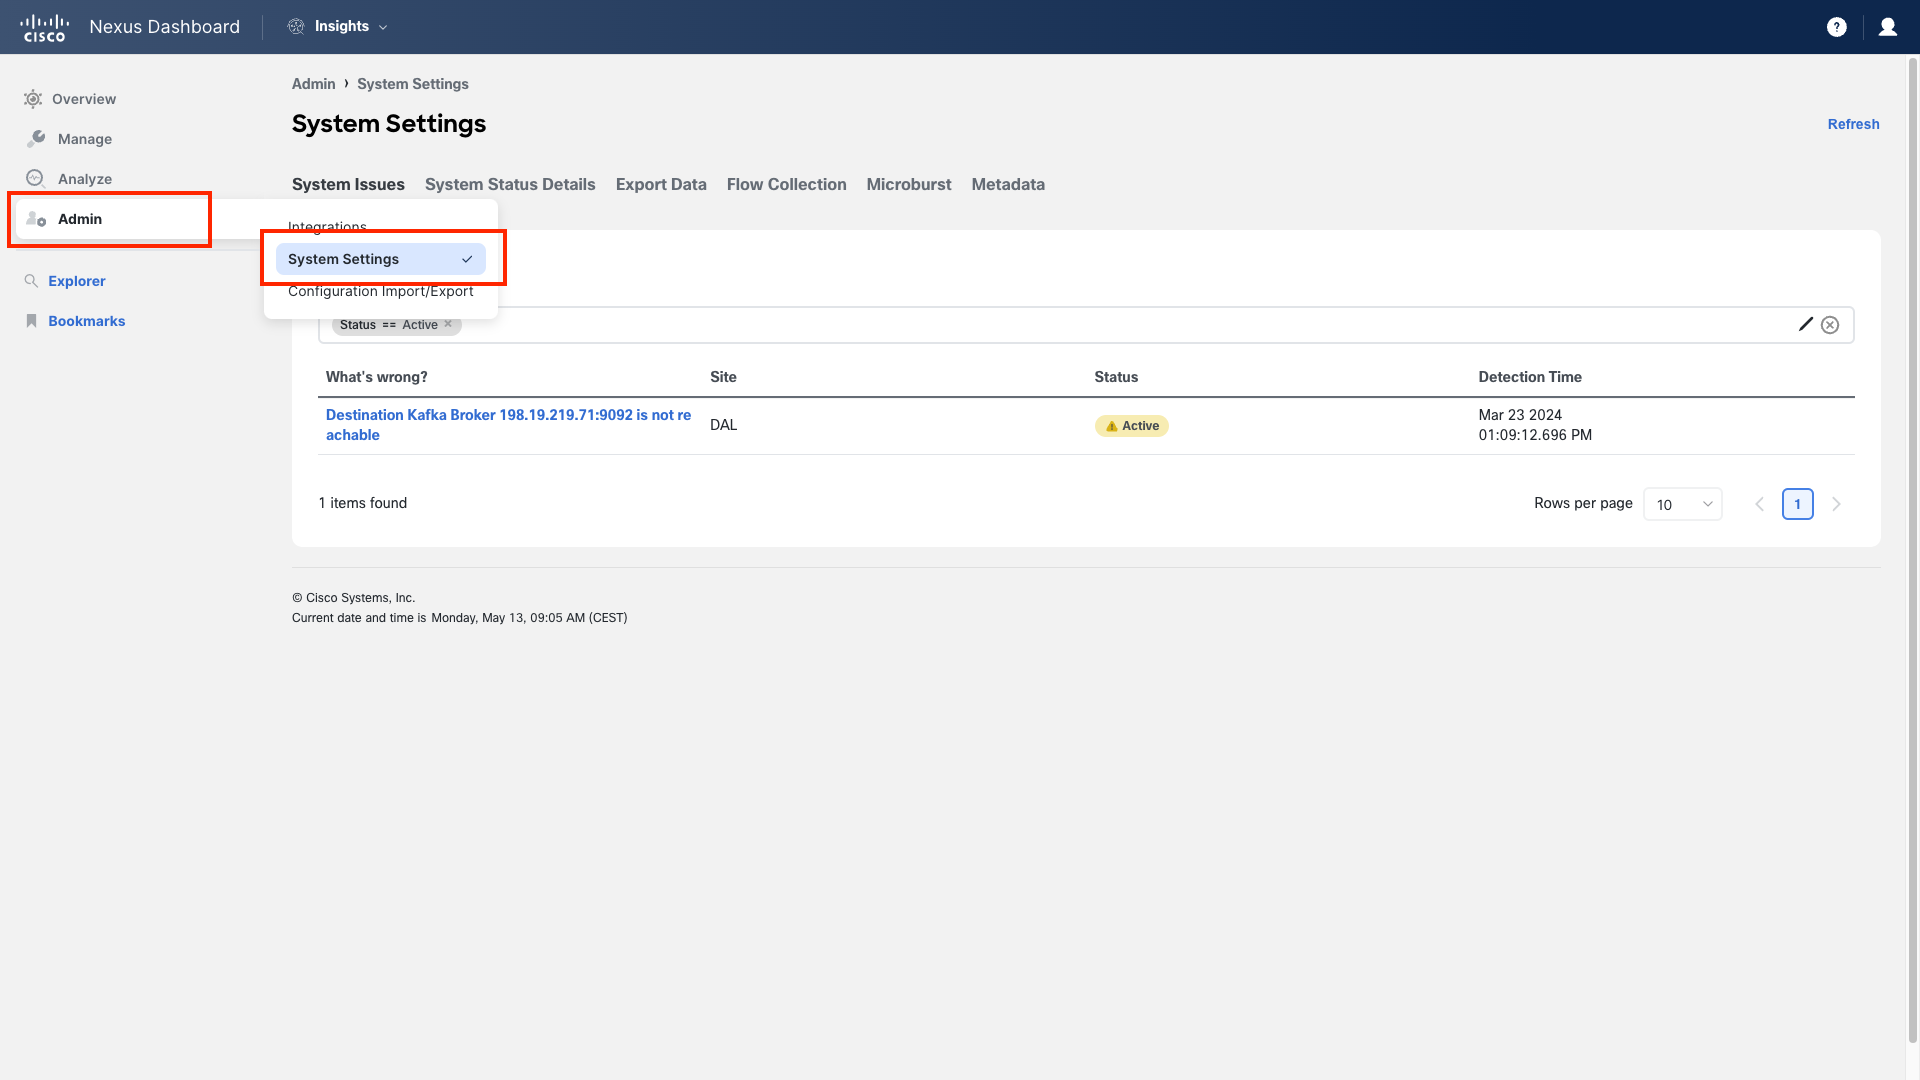
Step 19 - System Settings
System Settings serves as the management and configuration hub for Nexus Dashboard Insights, where you can monitor system issues or status, configure data export, set flow rules, or update the metadata file. Feel free to click through and explore all the options under system settings.
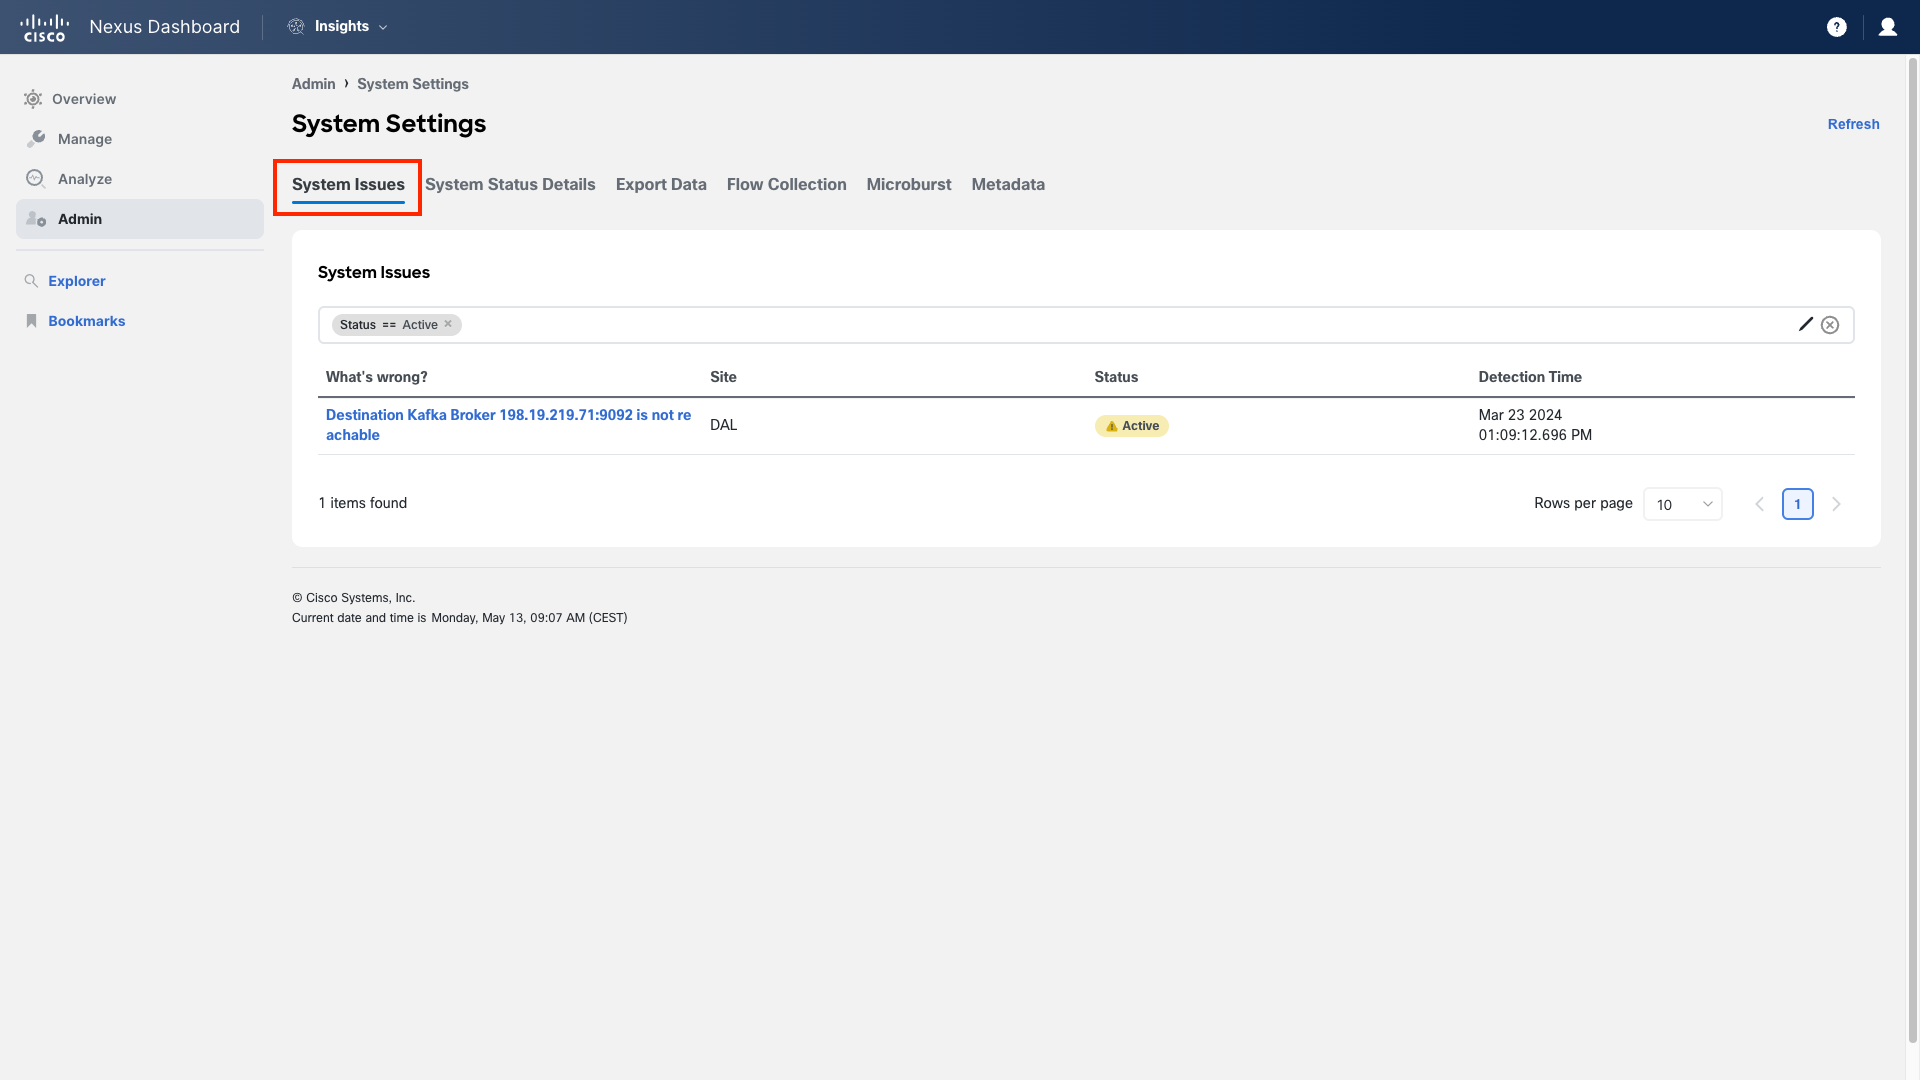
Step 20 - System Issues
System Issues is where you can see all the Anomalies that might be affecting Nexus Dashboard Application.
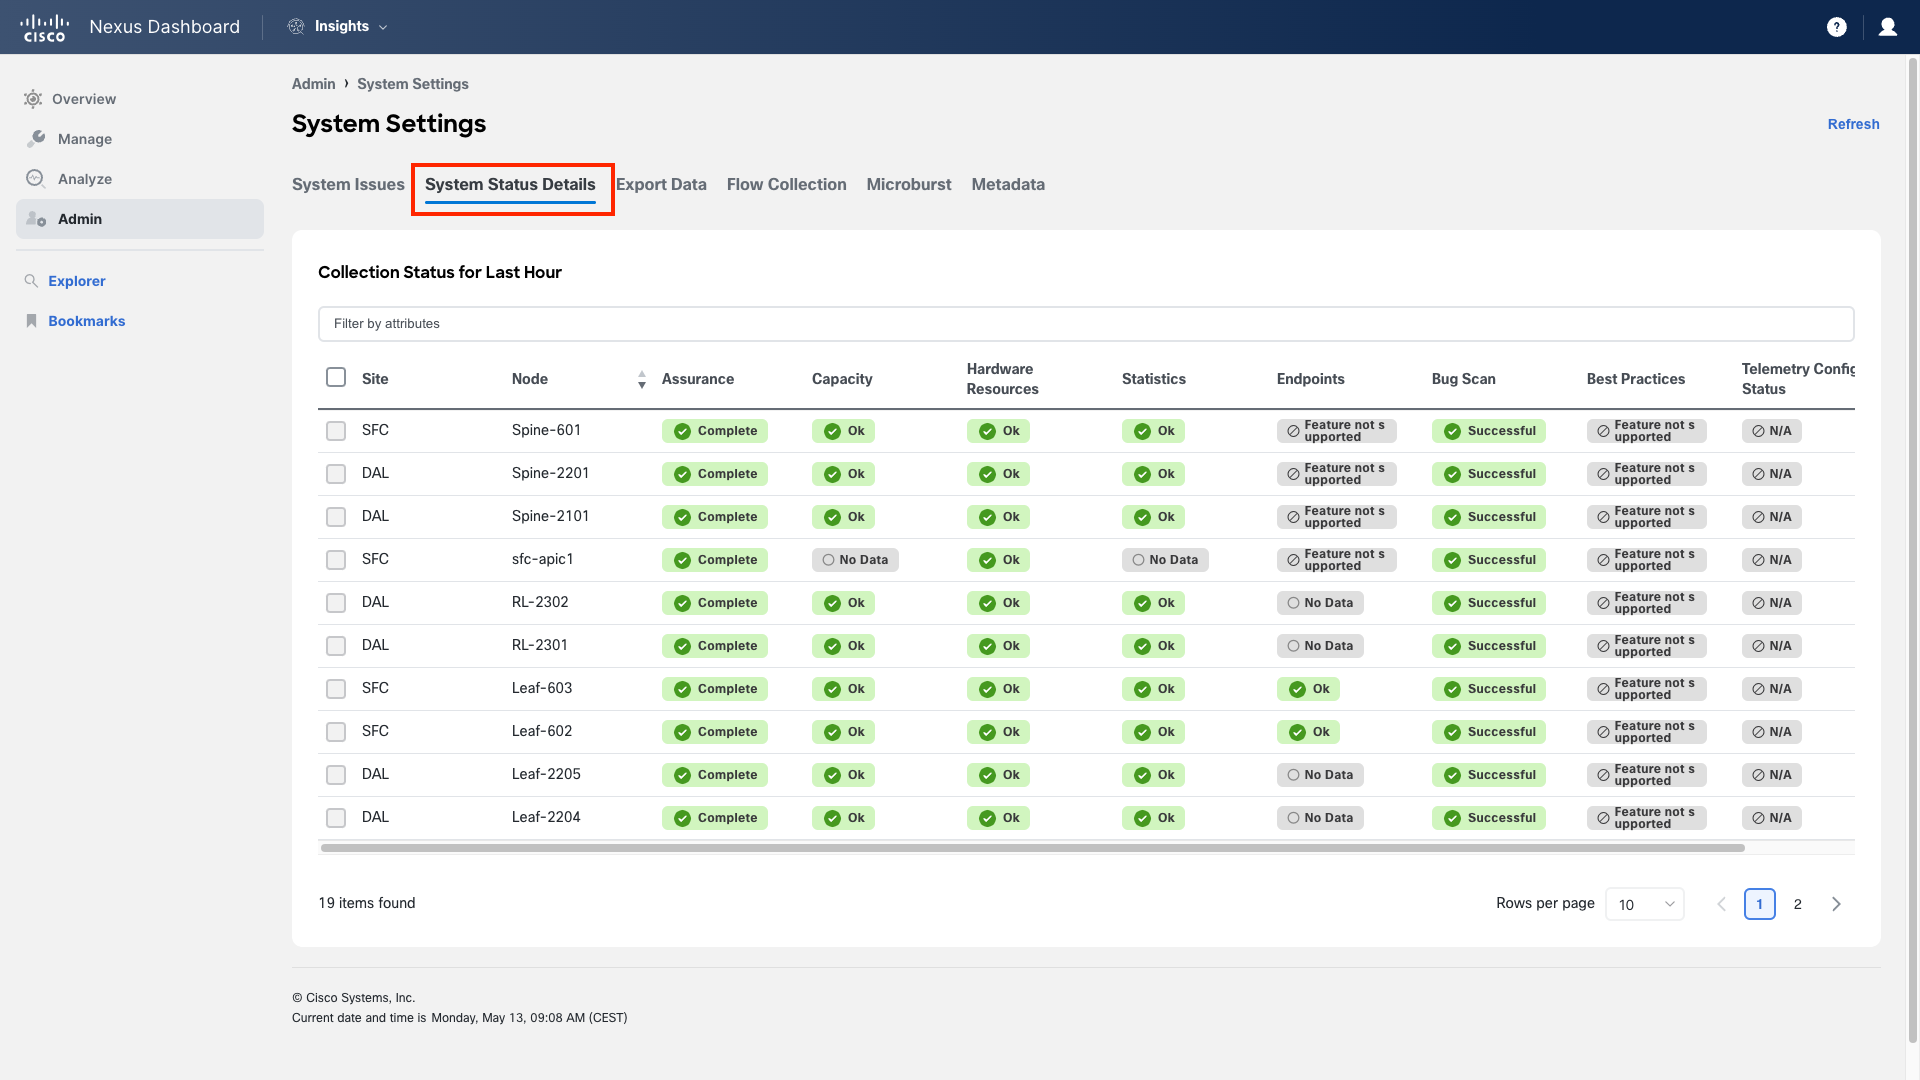
Step 21 - System Status Details
The System Status Details view provides another method for verifying that Insights is appropriately receiving the expected telemetry. This includes all devices from all the fabrics. Eventually you can filter the table.
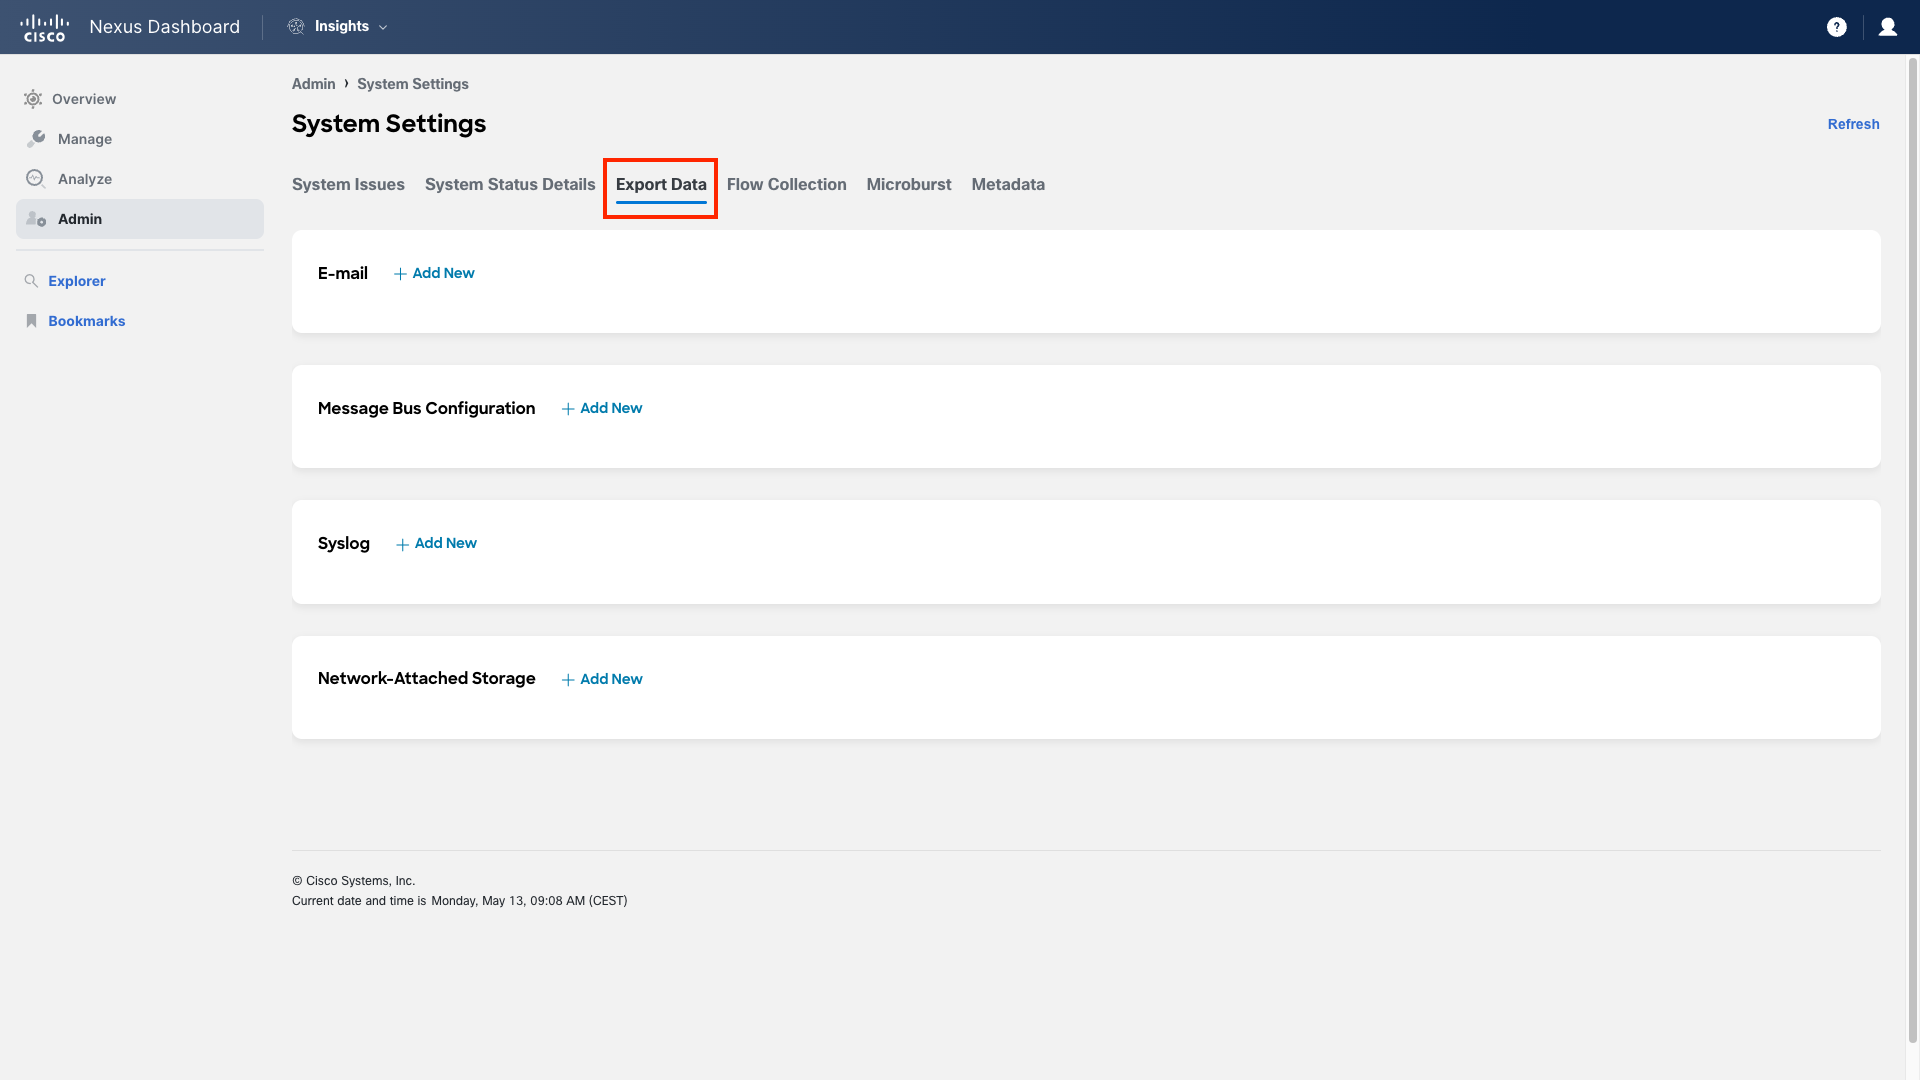
Step 22 - Export Data
Export Data is utilized for sending email alerts, exporting to a syslog, or to a Kafka message bus. It is also where you can configure the storage of long-term flow data on an external NFS storage server.
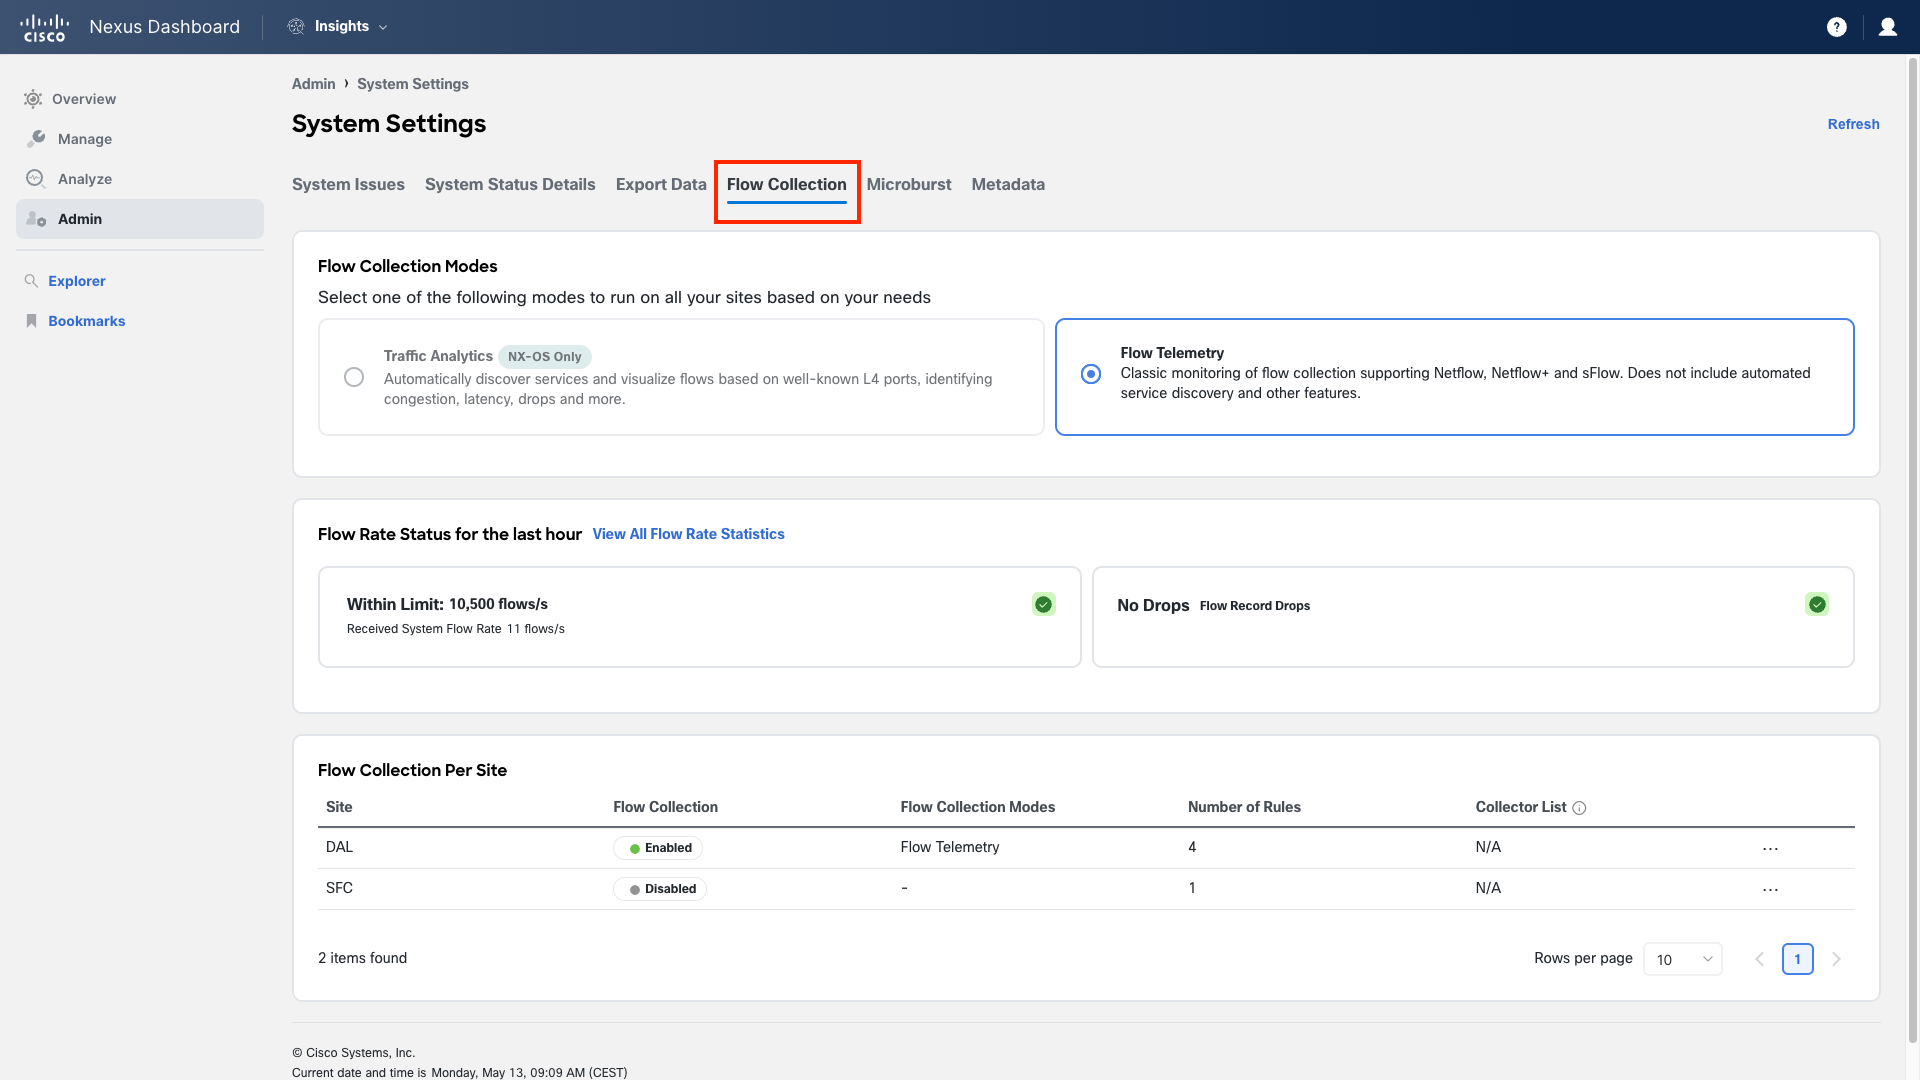
Step 23 - Flow Collection
Flow Collection is where you can specify the methods and locations for capturing flow information from your endpoints.
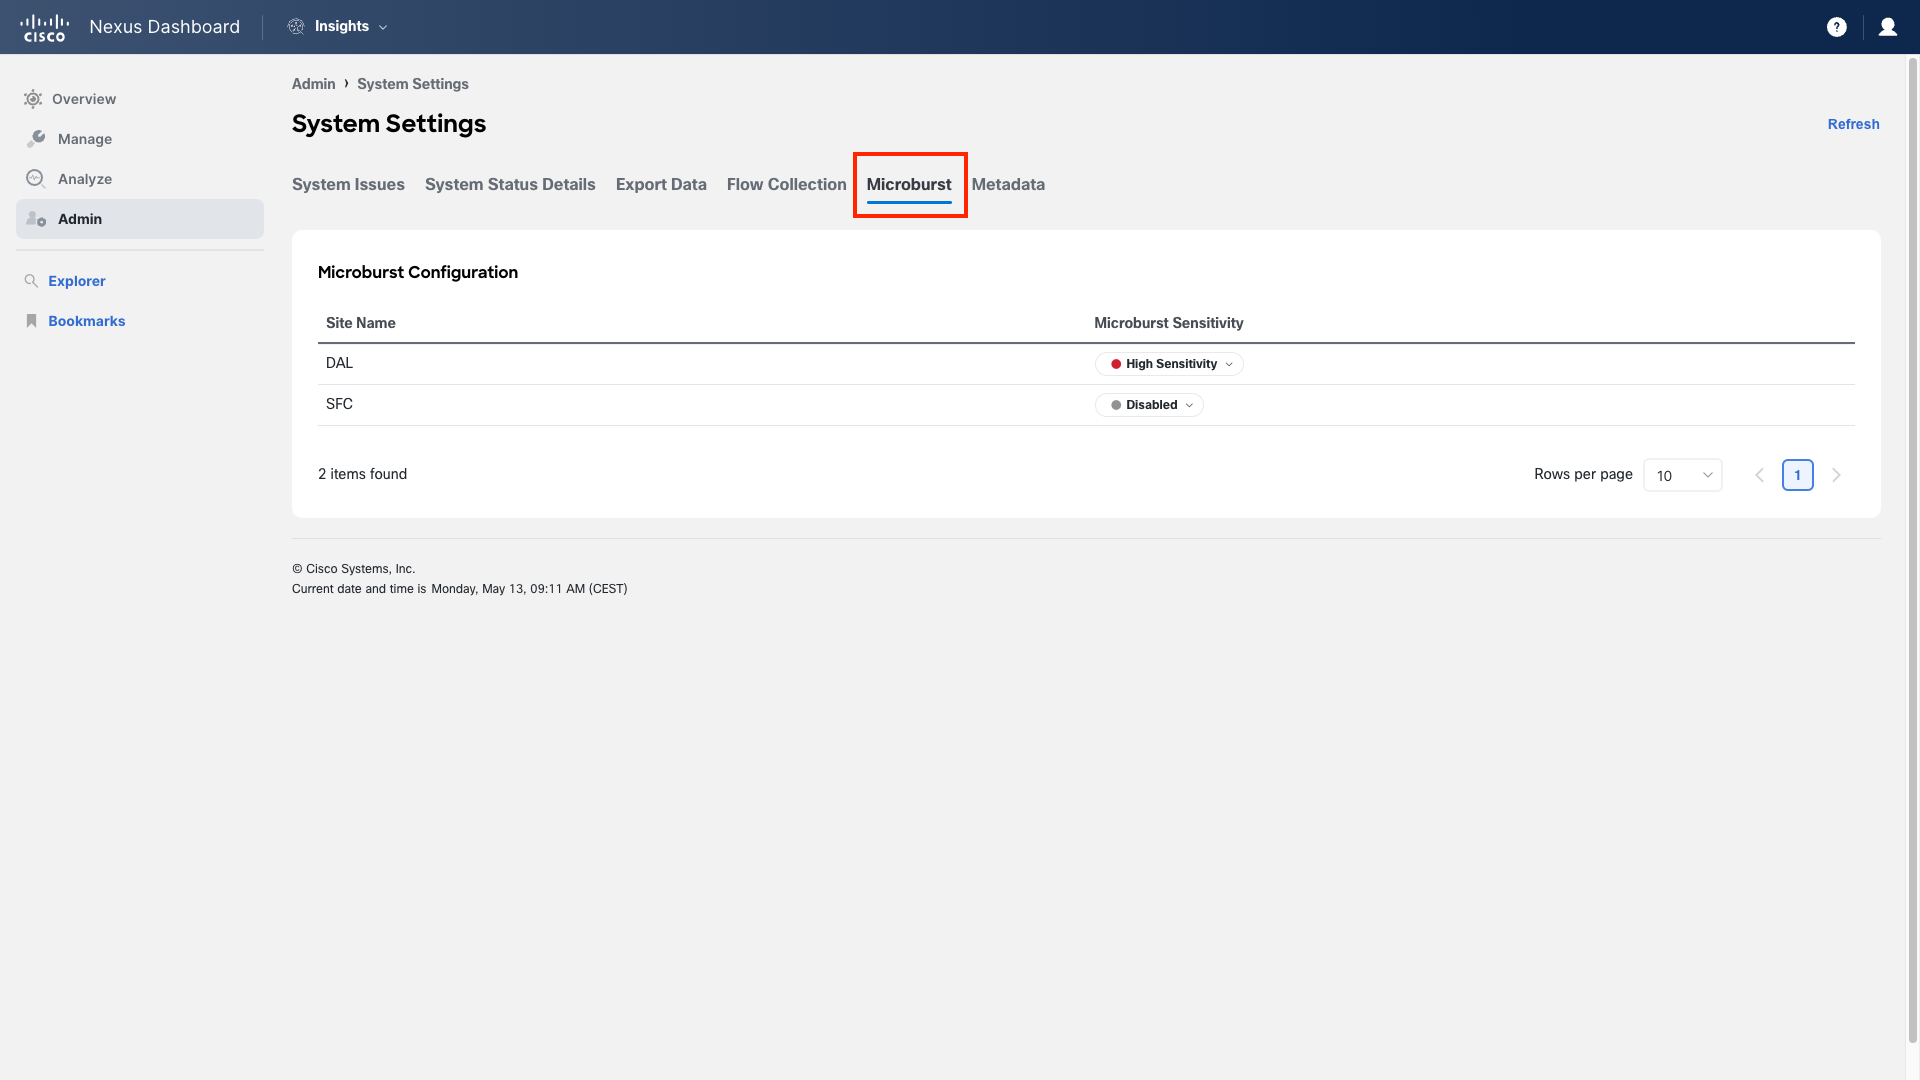
Step 24 - Microburst
Settings for Microburst detection can be enabled and adjusted for sensitivity on this matter, allowing for more precise identification of events like buffer drops within your fabric.
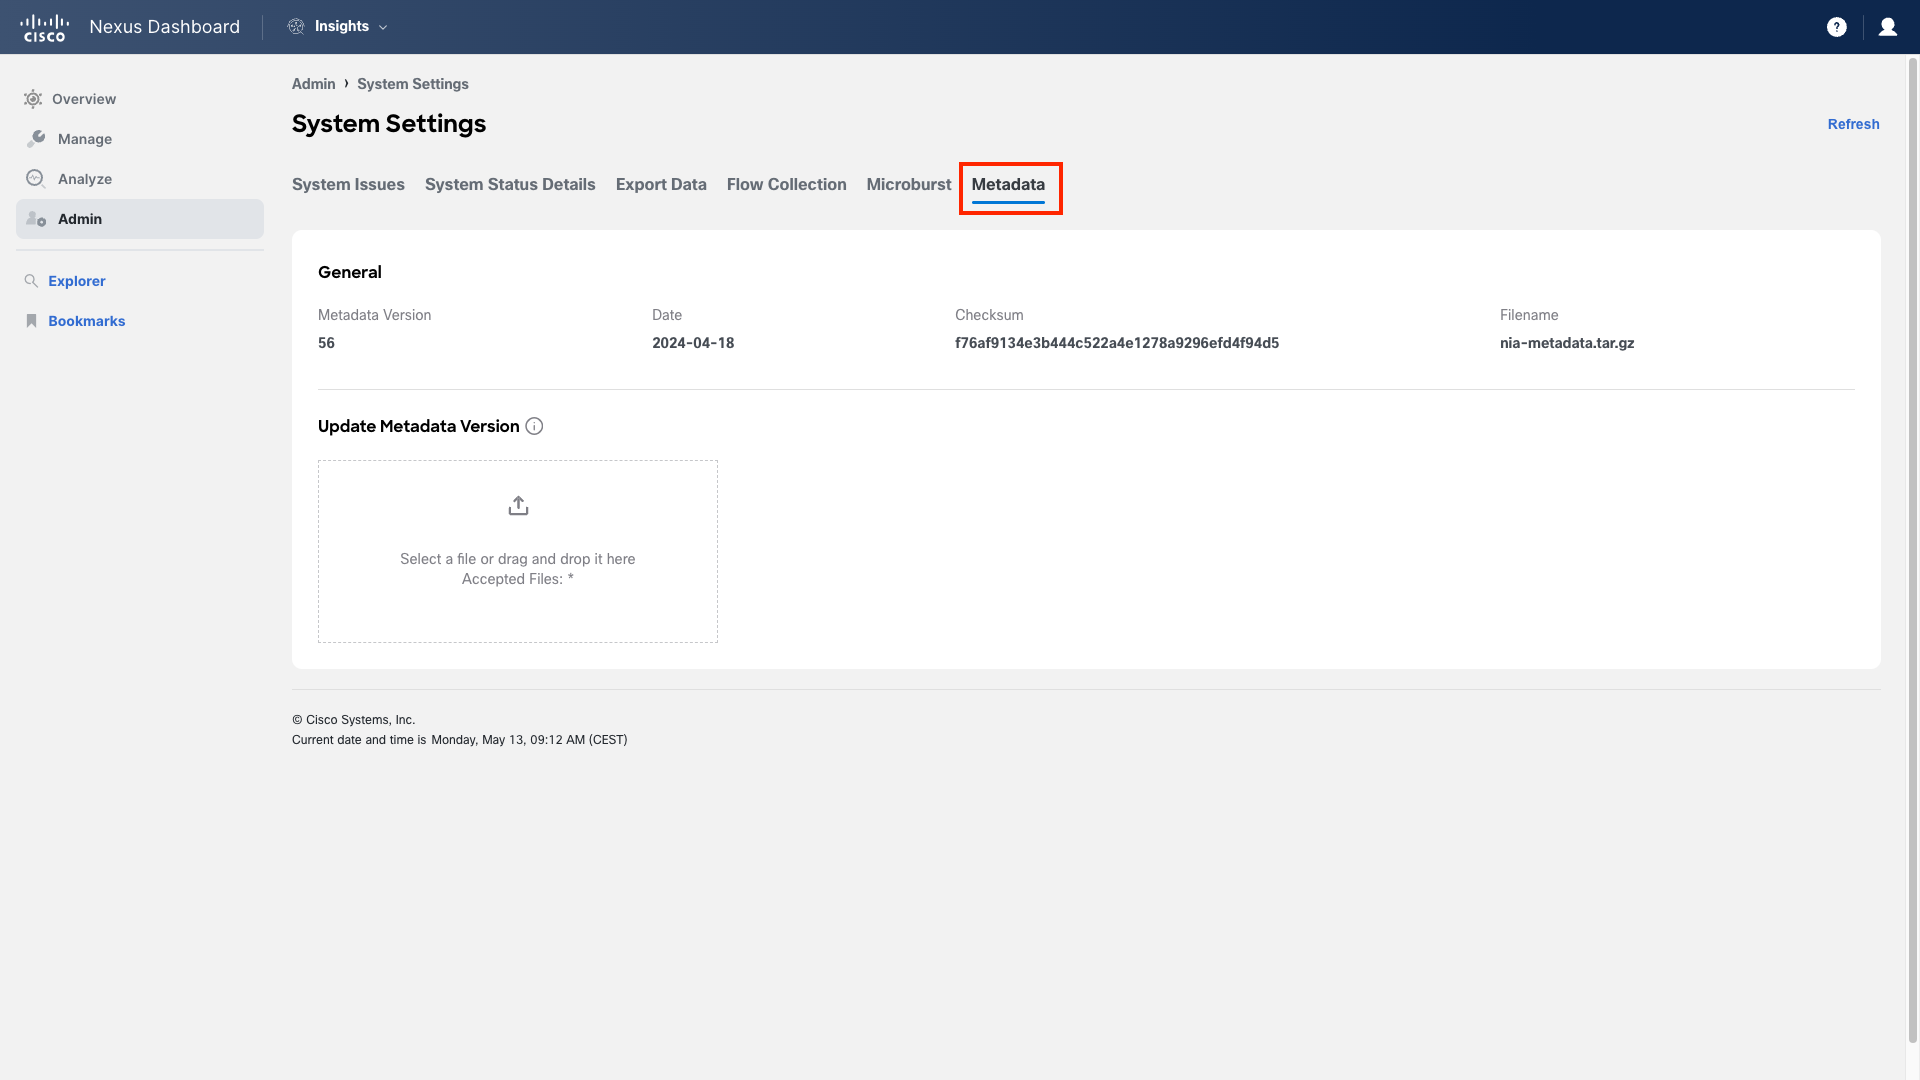
Step 25 - Metadata
If you have connected Nexus Dashboard to Cisco Intersight, it will automatically download new bug signatures, alerts, and other data for you. This Metadata view provides an alternative method for manually uploading a new metadata file if the automatic download has not occurred.
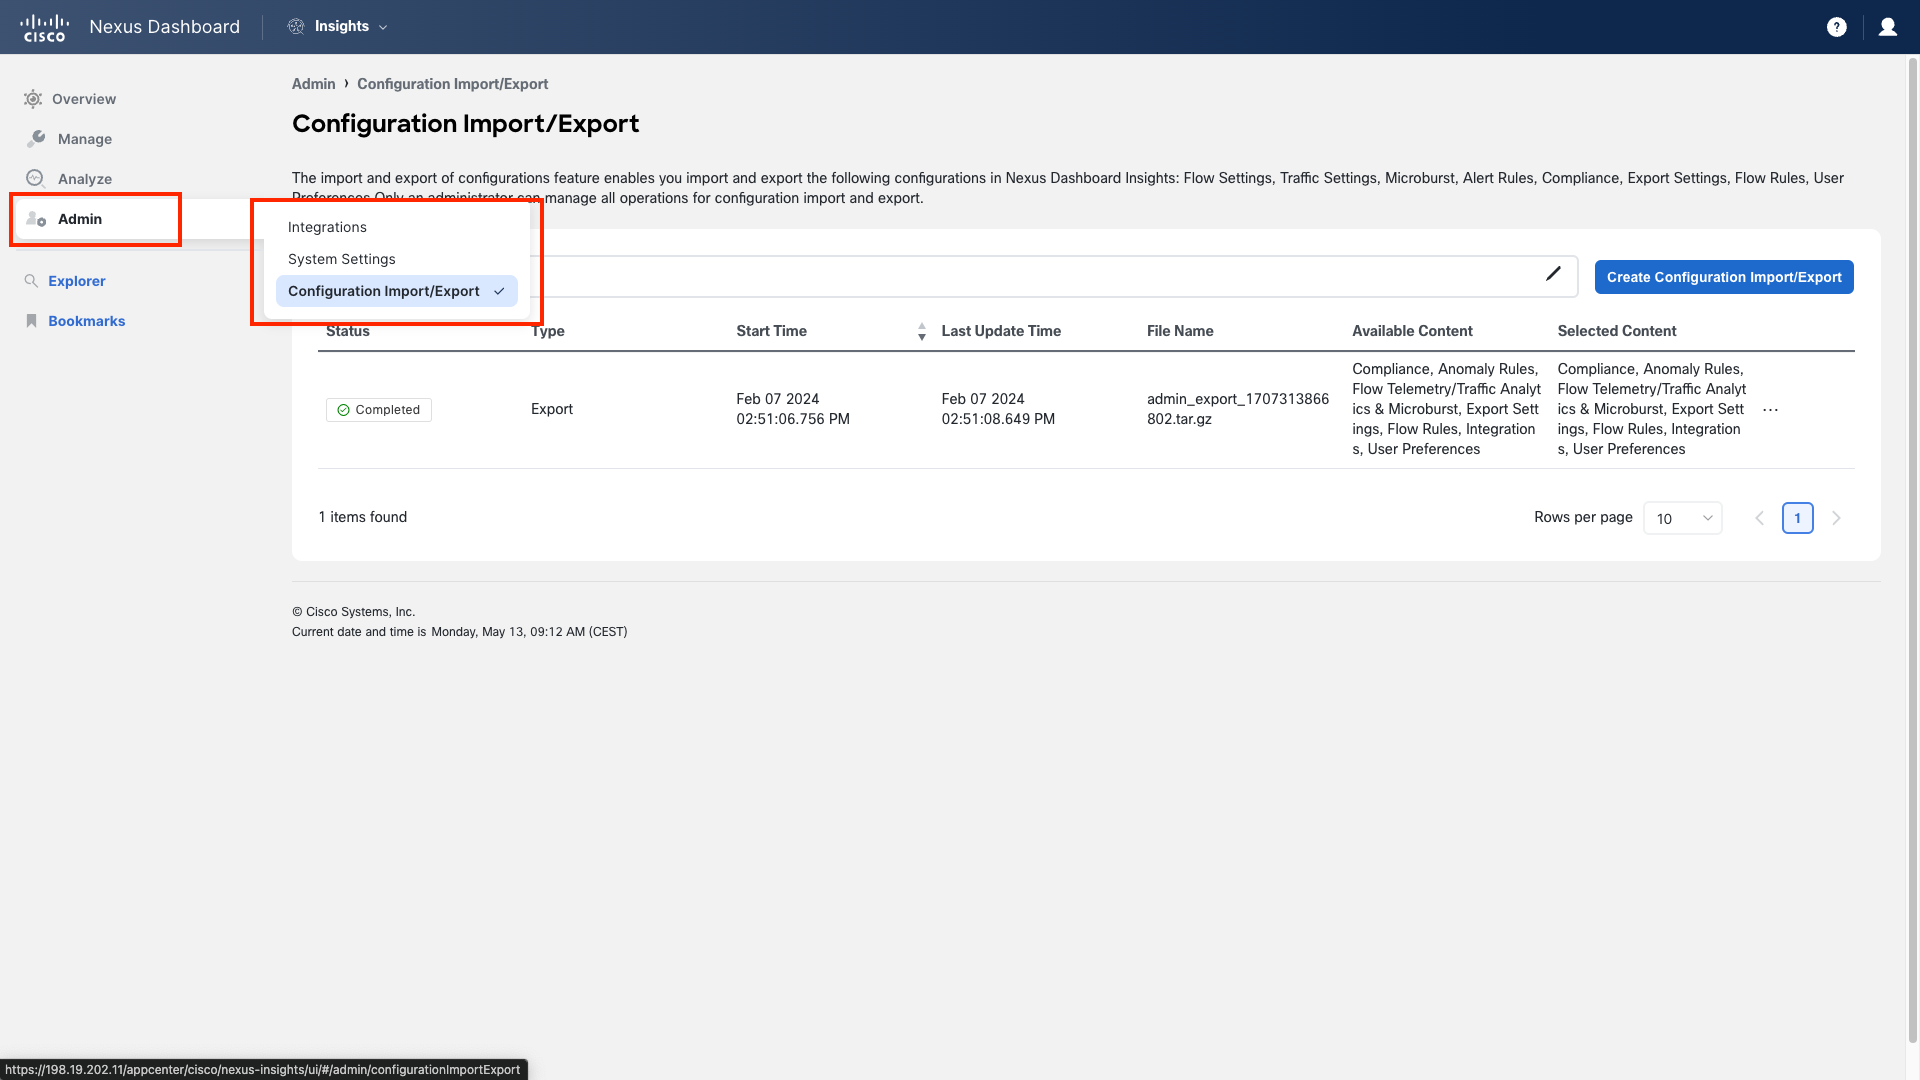
Step 26 - Configuration Import/Export
Configuration Import/Export gives you the ability to back up your Nexus Dashboard Insights configuration and settings. It is recommended to perform periodic backups and export them to an external location in case of a catastrophic event.
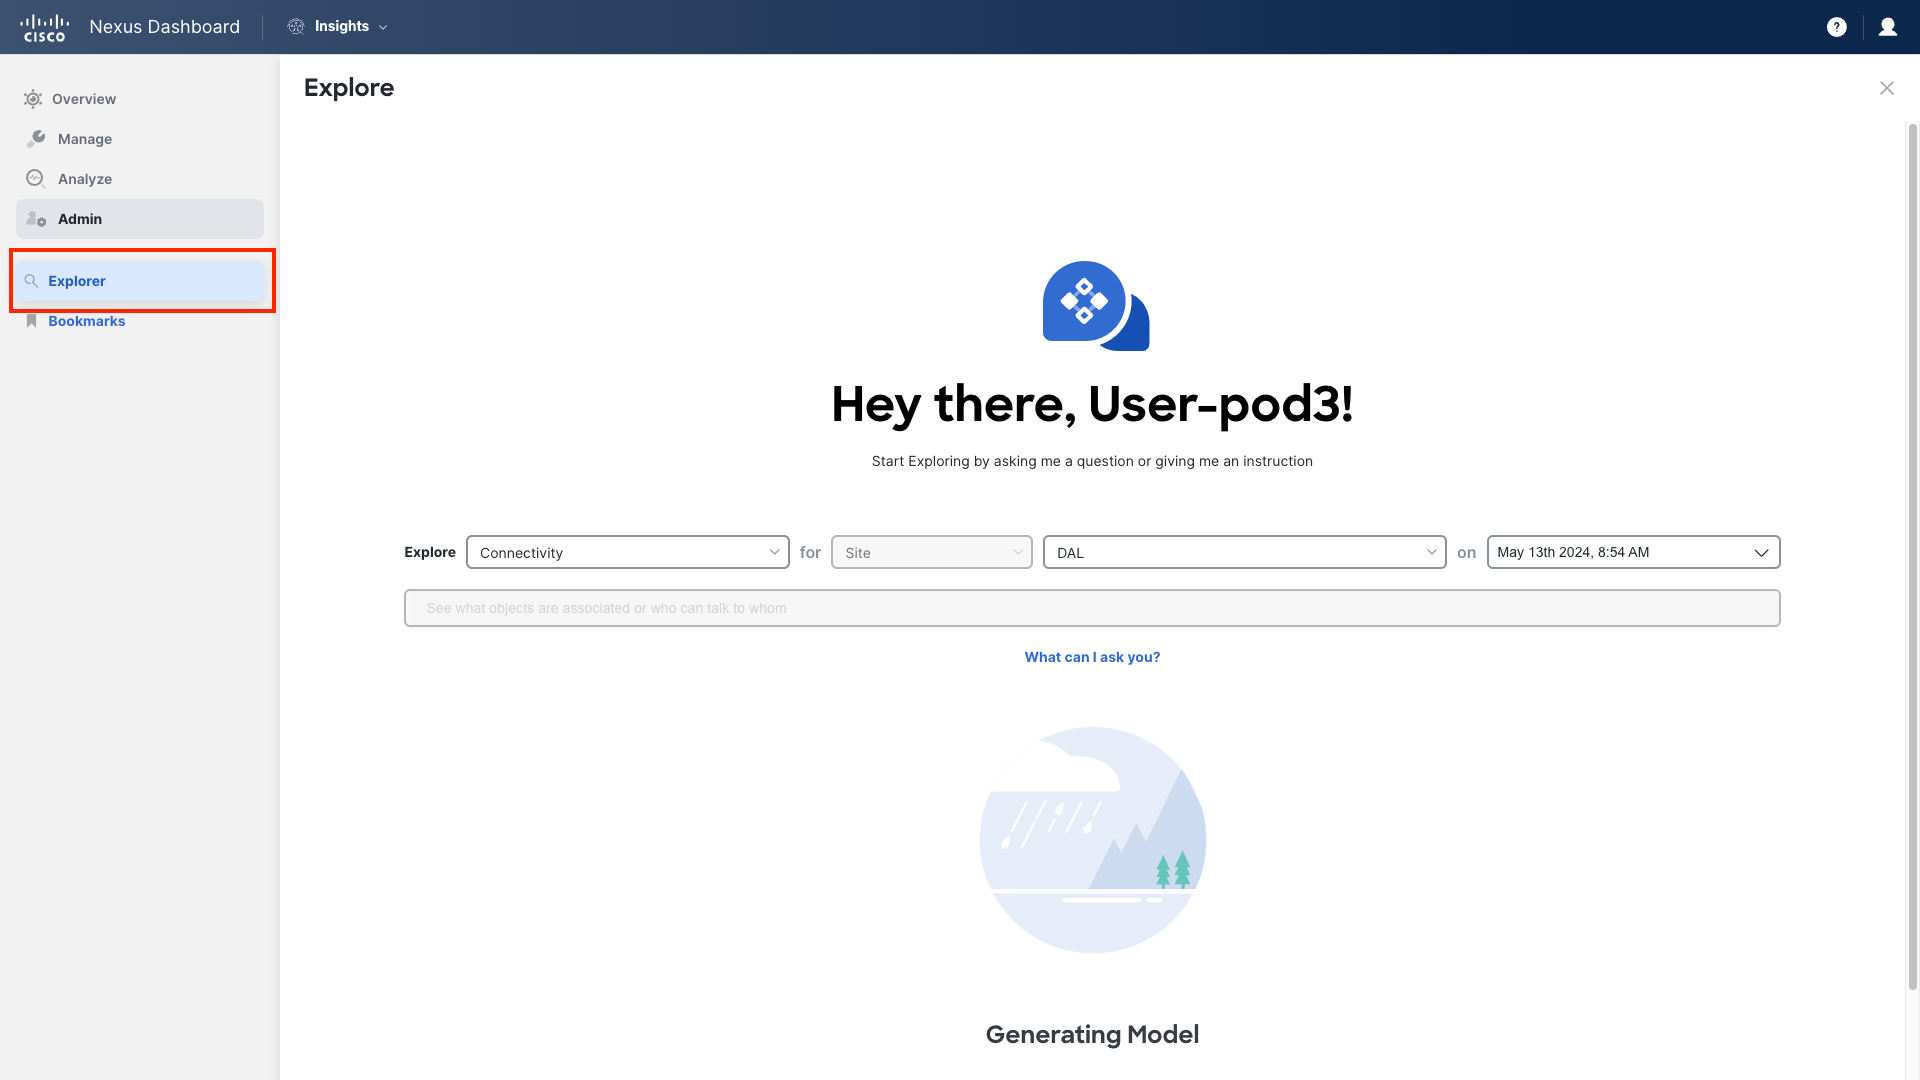
Step 27 - Explore
Explore is an interface that allows you to ask Nexus Dashboard Insights human-like questions starting with the keywords "What" or "Can." You can select what you wish to explore, such as Connectivity, specify the site, and choose a particular date and time. Explore then provides you with a comprehensive answer based on the data within the system. You will delve into Explore in more detail in one of the scenarios.
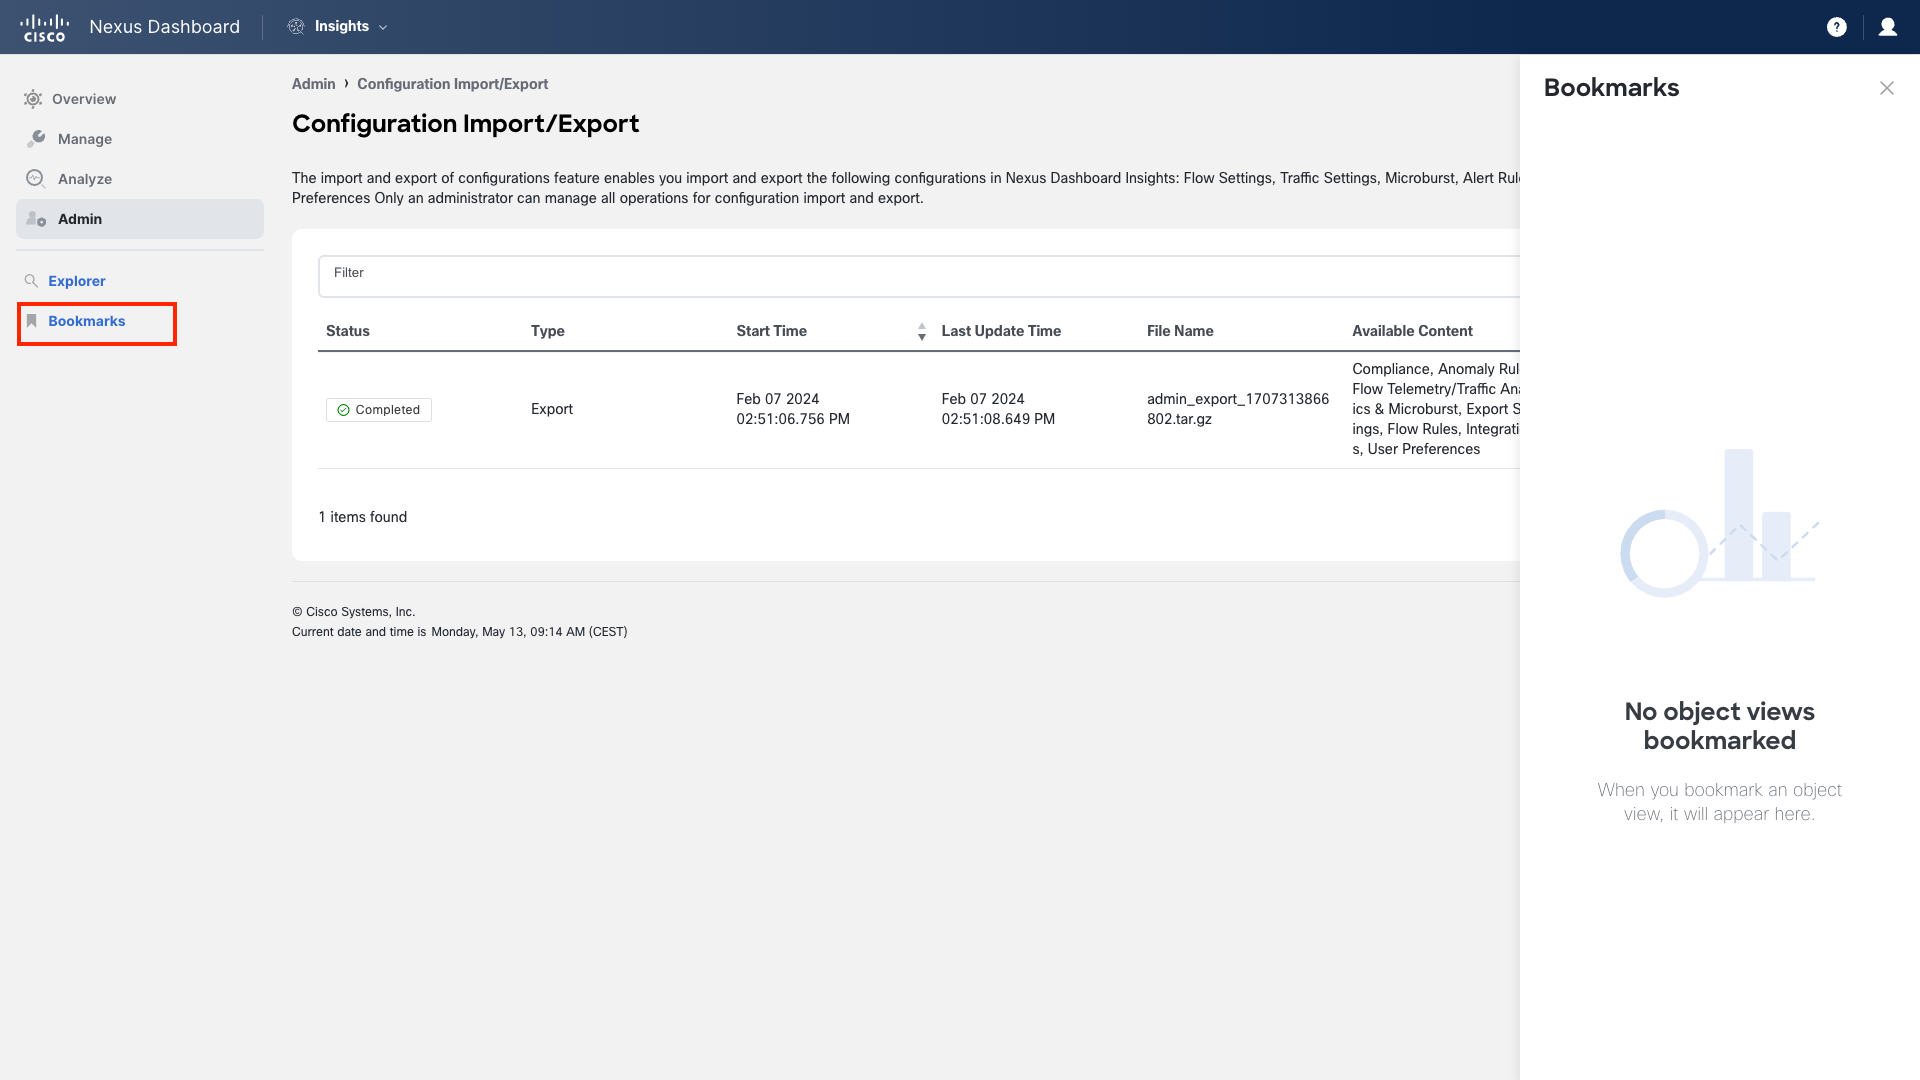
Step 27 - Bookmarks
The last item on our menu is Bookmarks. As you navigate through various features, views, and dashboards, you can create bookmarks for easy access or quick reference, much like you would in a web browser. Here, you can bookmark interfaces, endpoints, flows, devices, and much more. Similar to Custom Dashboards, bookmarks will expedite your proactive operational routines.
Extra task
As you work your way through this lab guide and it's use-cases, build your Bookmarks with important or interesting references. Check it at the end of the lab to see what you have built.
Step 28 - Smile
You have reviewed the entire new look. You are now ready to delve into the use cases of this lab. Have fun and enjoy the experience!