UseCase 9 - Sustainability Report
Sustainability Report
Nexus Dashboard Insights provides the capability to run Sustainability Reports for your DC fabrics, covering mainly three pillars: energy, cost, and emissions. This feature became available with Nexus Dashboard 3.0 (Insights 6.3.1) and has been evolving since then. In the latest release, it provides not only visibility of the fabric elements' power consumption but also information about any other element in the data center by pulling power consumption metrics from the PDU (currently only Panduit).
Nexus Dashboard Insights can provide three main insights related to sustainability:
-
Energy Consumption: Nexus Dashboard Insights is able to pull power consumption metrics from all switches in your fabrics and, if the integration with third-party PDU vendors is configured (currently Panduit), also from the Smart PDUs in your data center.
-
CO2 Emissions: Based on the power consumption, and using Energy Mix information for your fabric's location obtained from a third-party service Nexus Dashboard is integrated with (ElectricityMaps), Nexus Dashboard Insights can estimate the emissions for your data center.
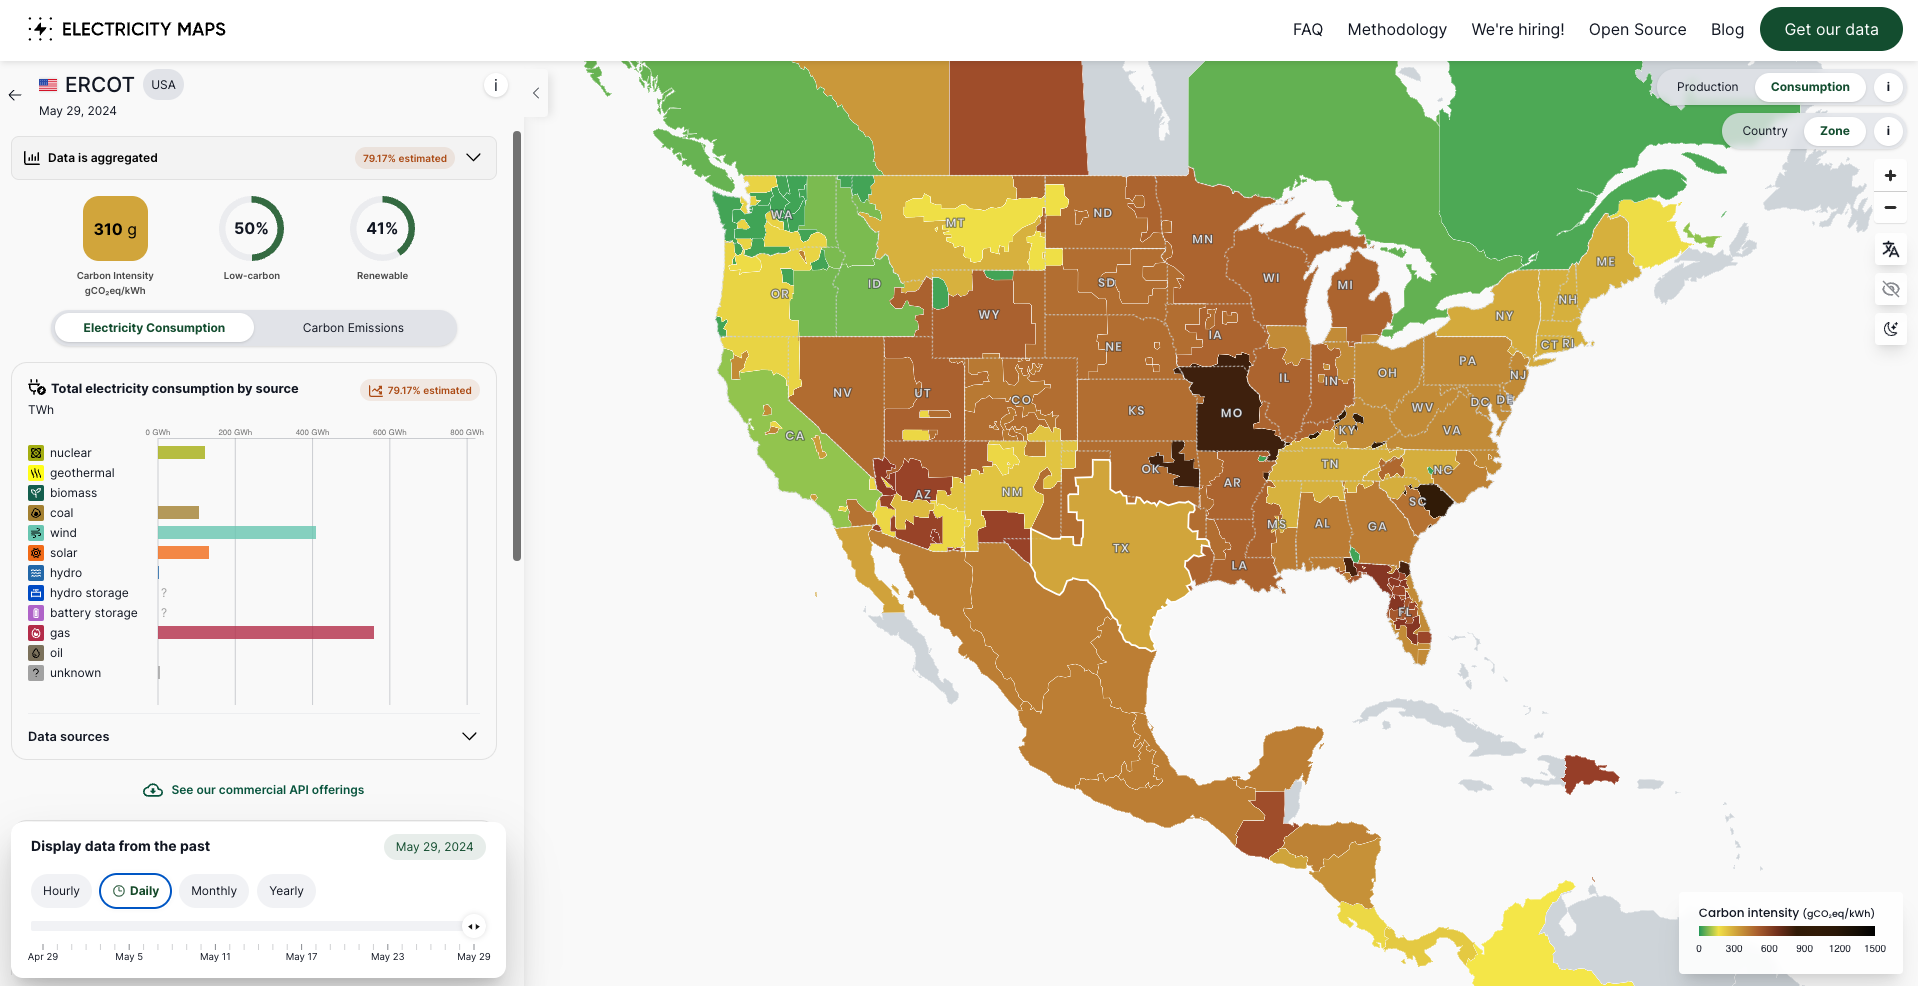
More about ElectricityMaps
If you are curious and want to explore the kind of data ElectricityMap provides, you can go to ElectricityMaps and explore the data yourself on the map they provide.
Below is an example for Dallas, Texas.
Note
Nexus Dashboard must be claimed in Intersight for this feature to work. Data is collected at 3-hour intervals or on-demand.
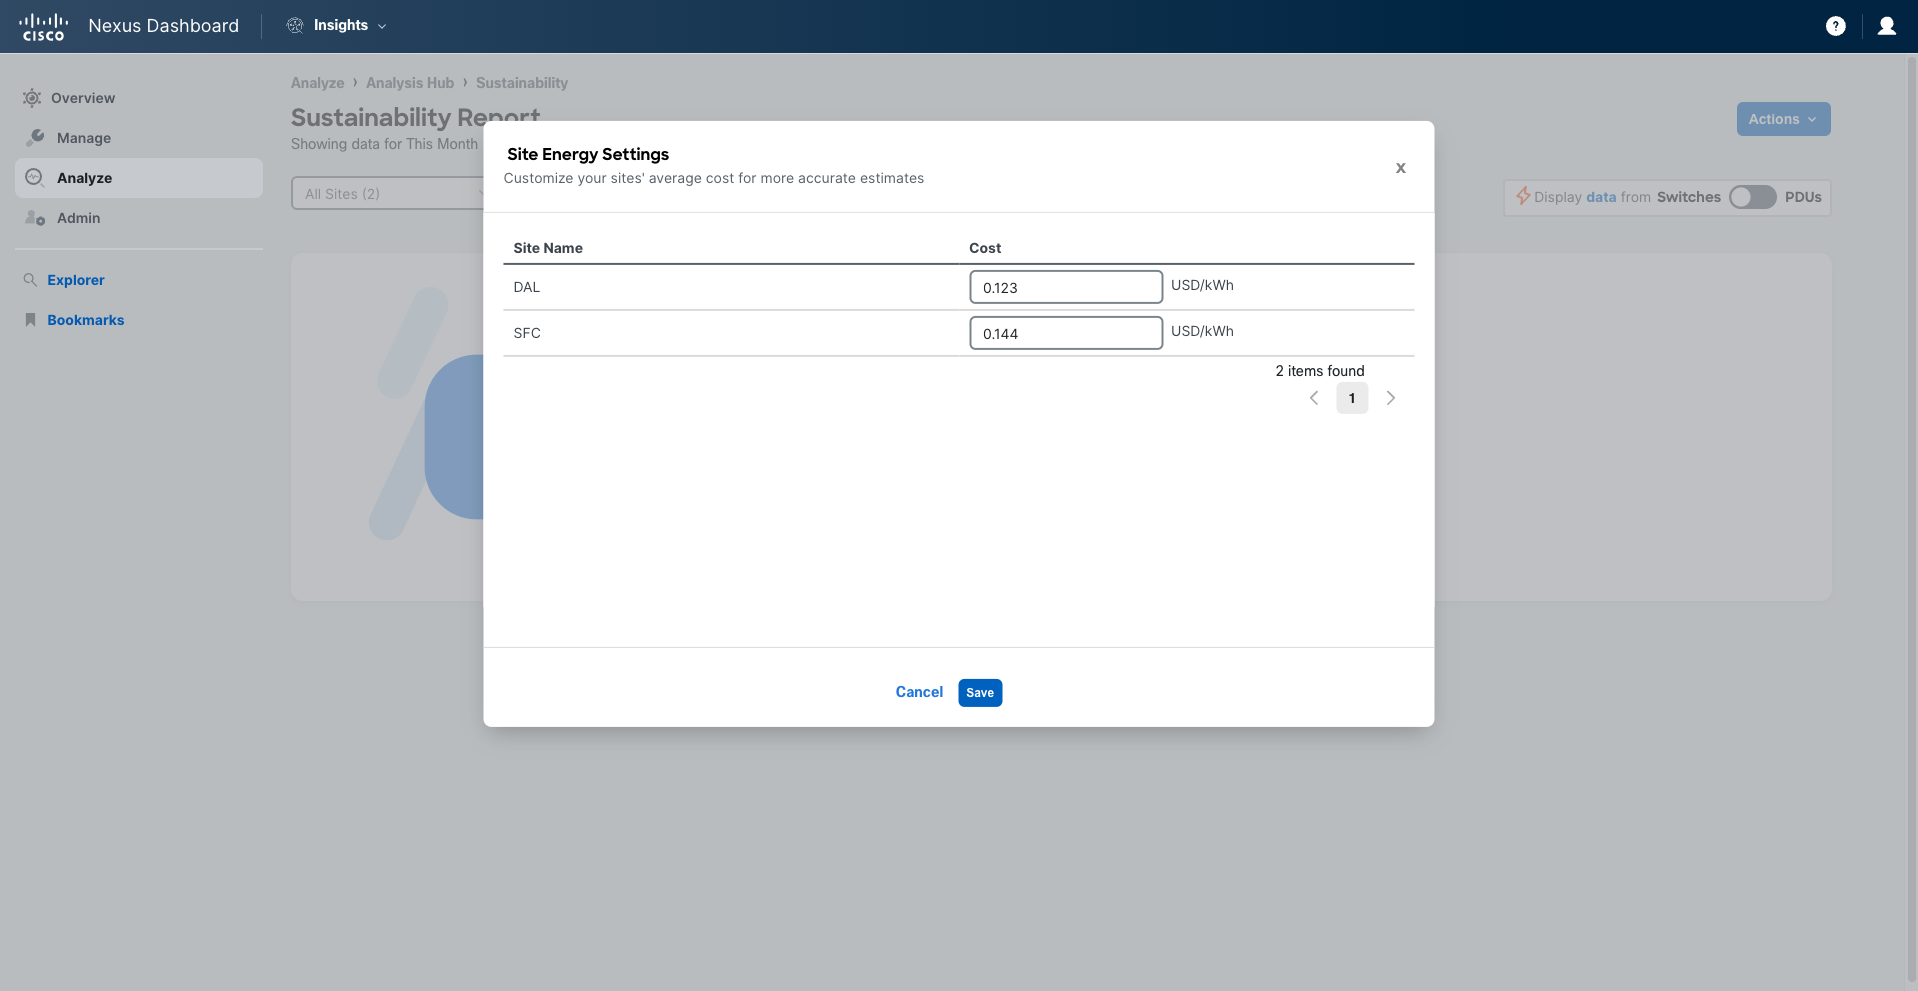
- Energy Cost: Nexus Dashboard can calculate the estimated cost of the energy for each of your fabrics. For this, the average cost per kWh must be provided. This cost is expressed in USD per kWh and can vary by site. If not specified, it defaults to 0.1 USD/kWh.
Note
You can configure the cost only for the current month ("This month"). For previous months, the default or previously configured cost will be used to calculate the report.
Scenario
Your manager needs to prepare a report on your company's data center energy consumption and sustainability for the upcoming board meeting. Therefore, he has asked you to provide this information about the networking part of the infrastructure. You can use Nexus Dashboard Insights to provide this information to your manager in a timely manner.
Solution
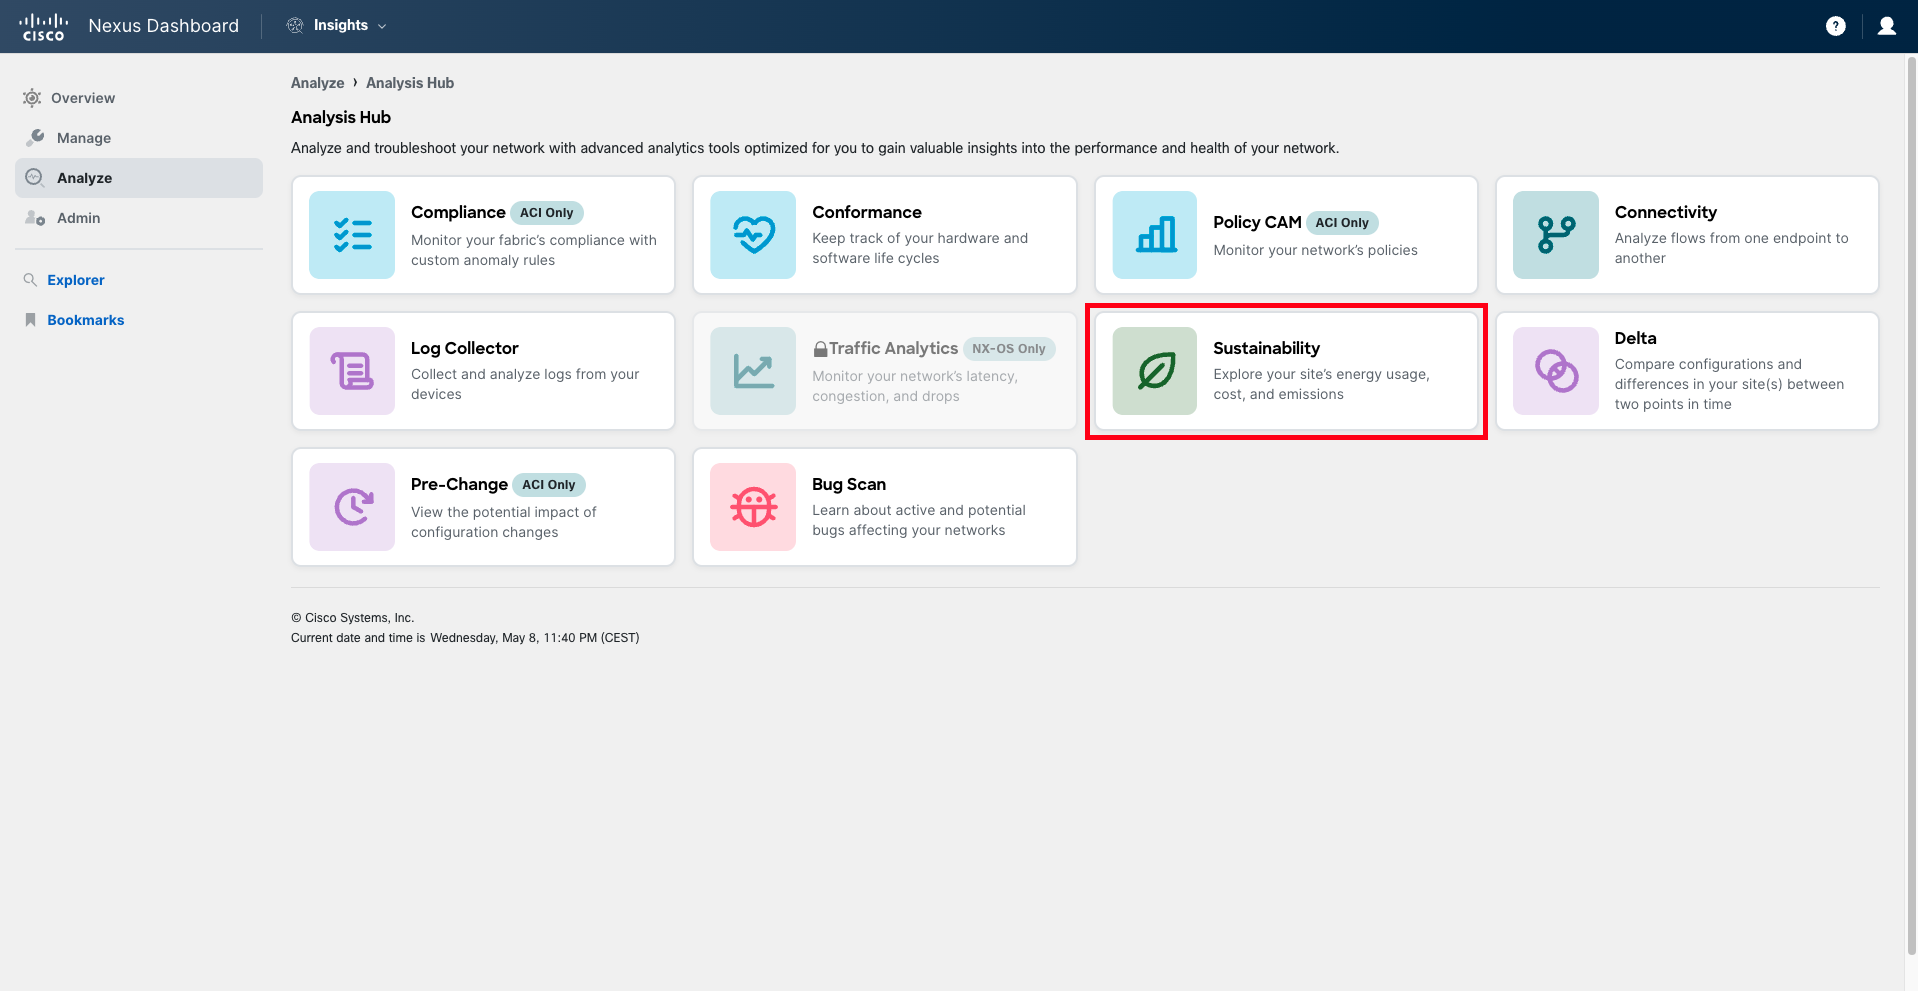
Step 1
In this use case, you will explore the Sustainability Report. Start by navigating to the Analysis Hub and then click on Sustainability.
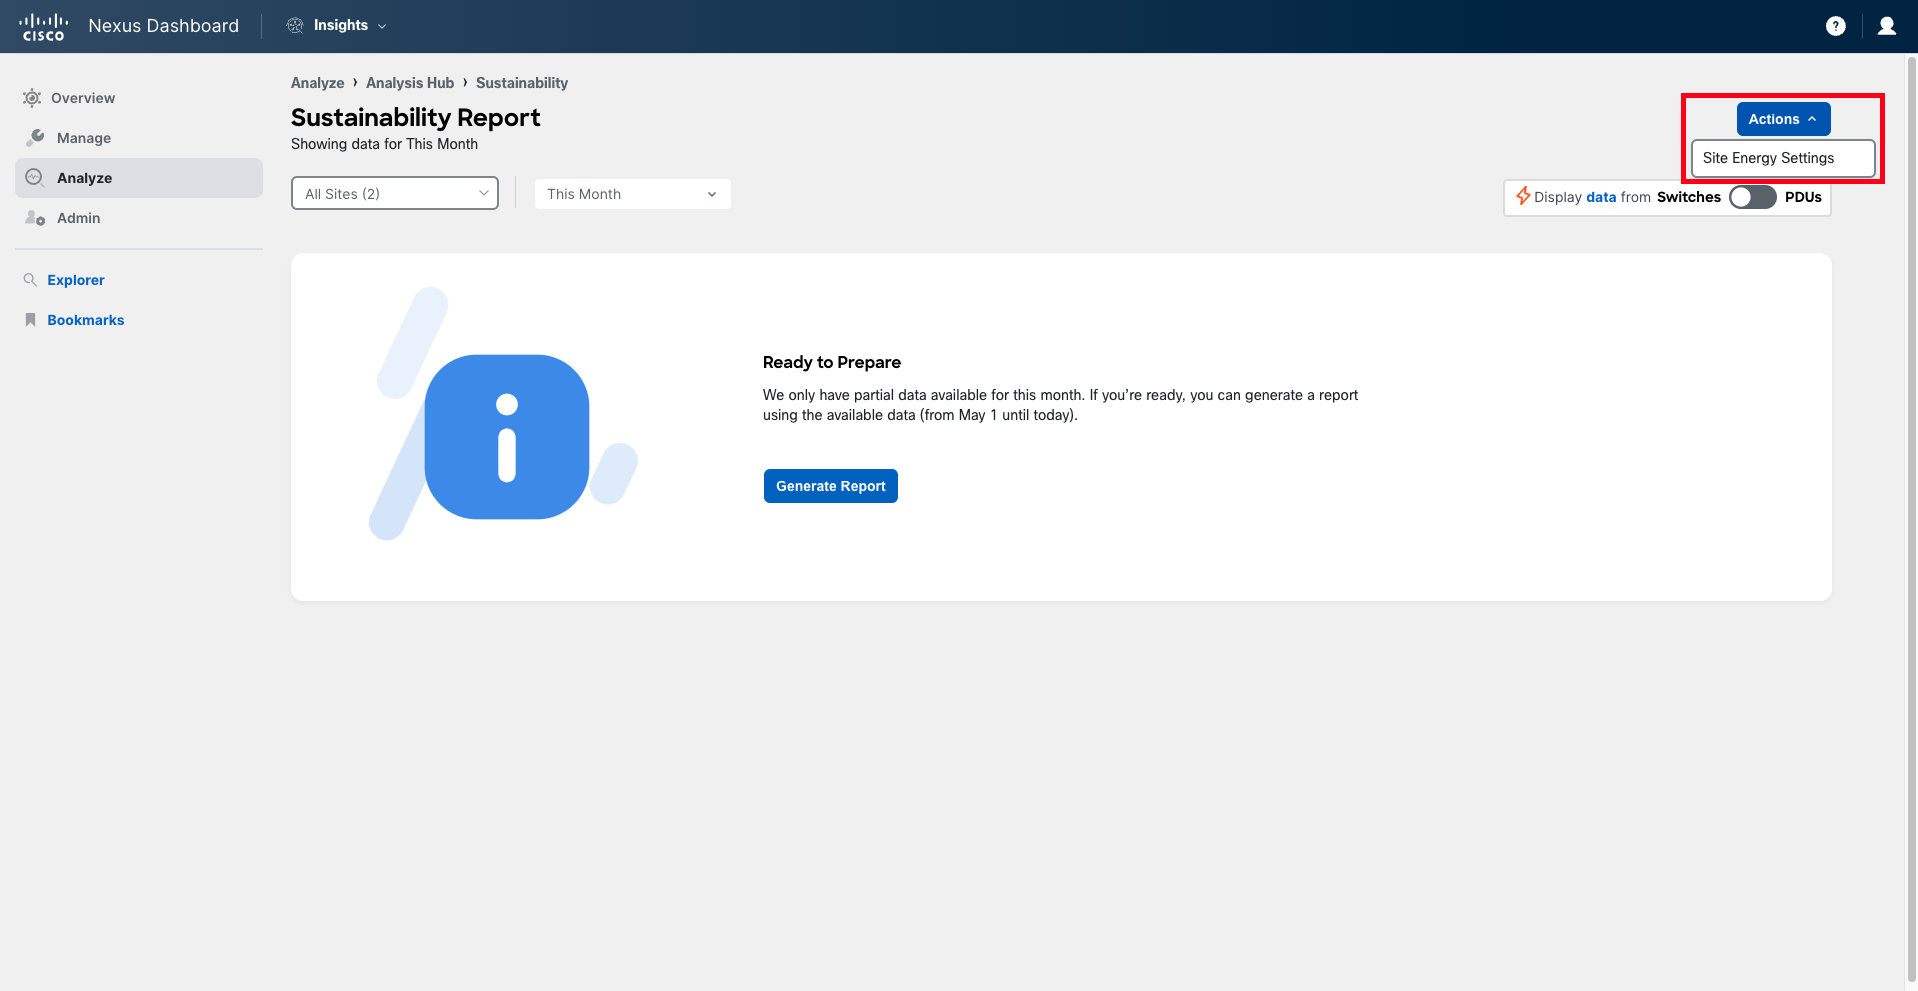
Step 2
Click on Actions > Site Energy Settings to configure the cost per kWh. As mentioned above, only the cost for the current month can be modified. For previous months, the option will be greyed out.
Step 3
Select the sites that you want to include in the report, and the month you want to visualize.
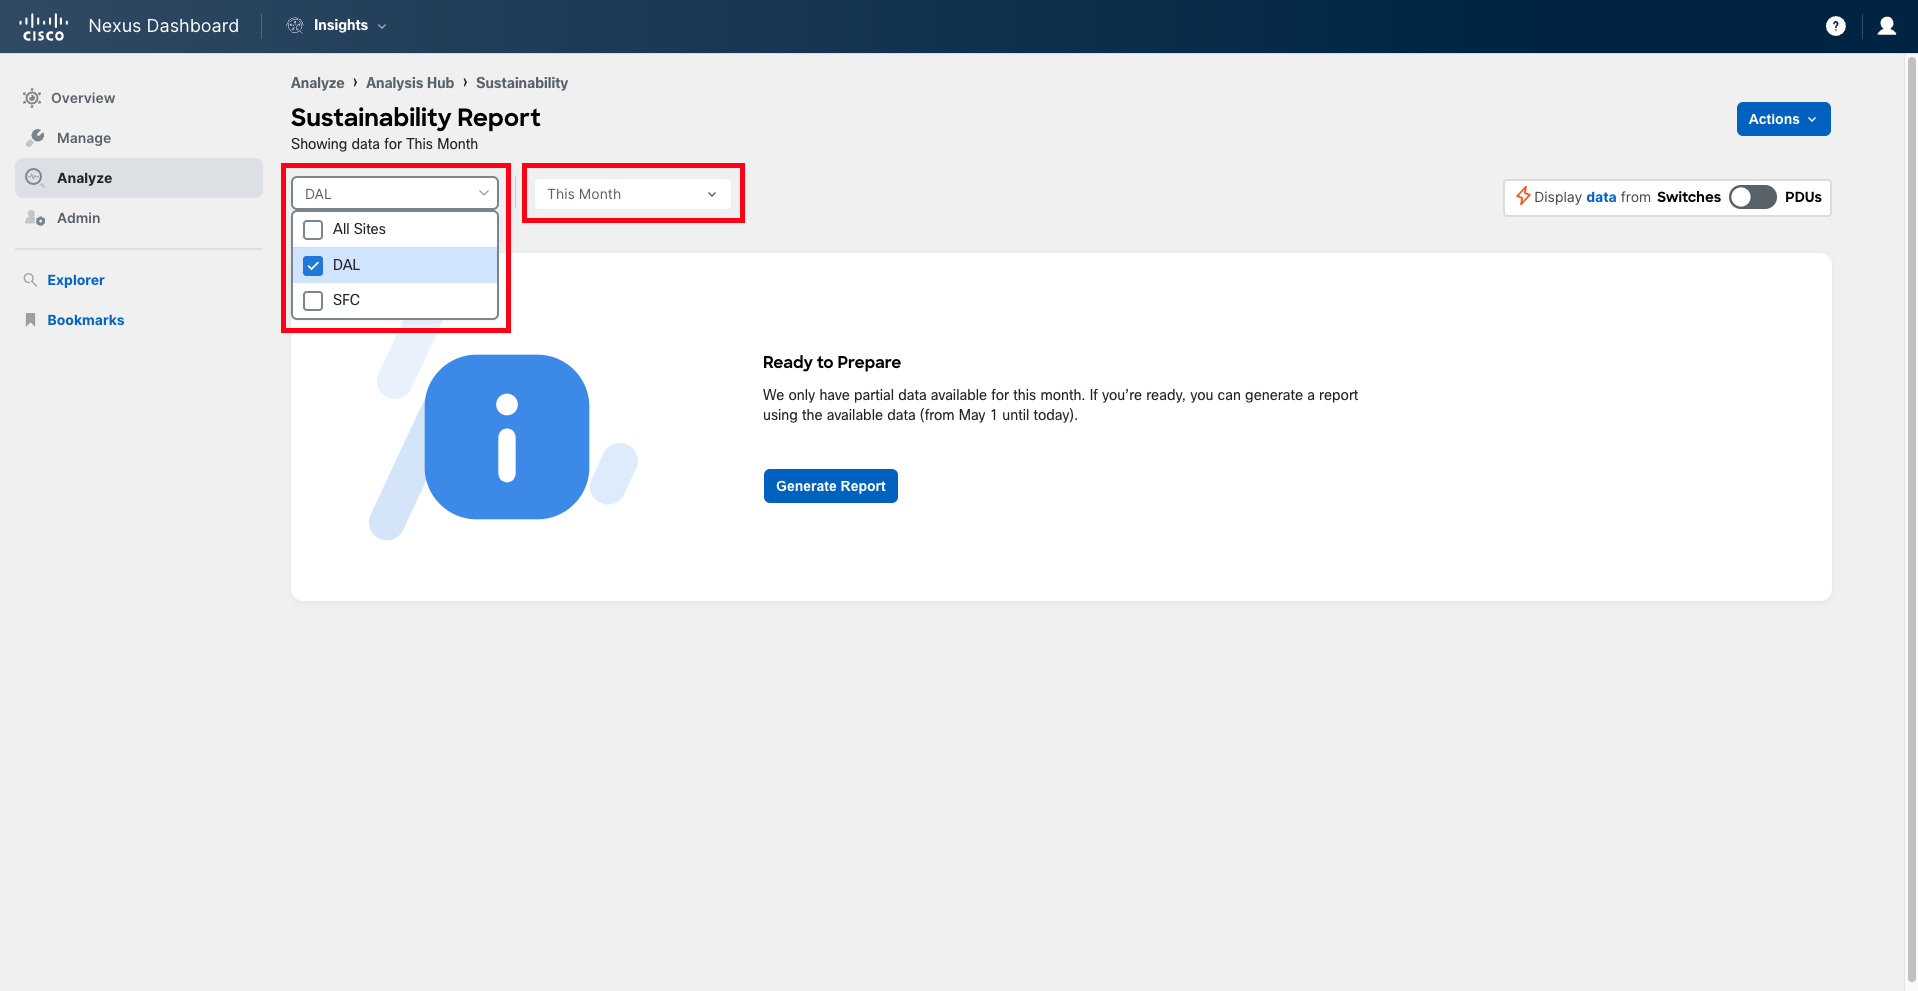
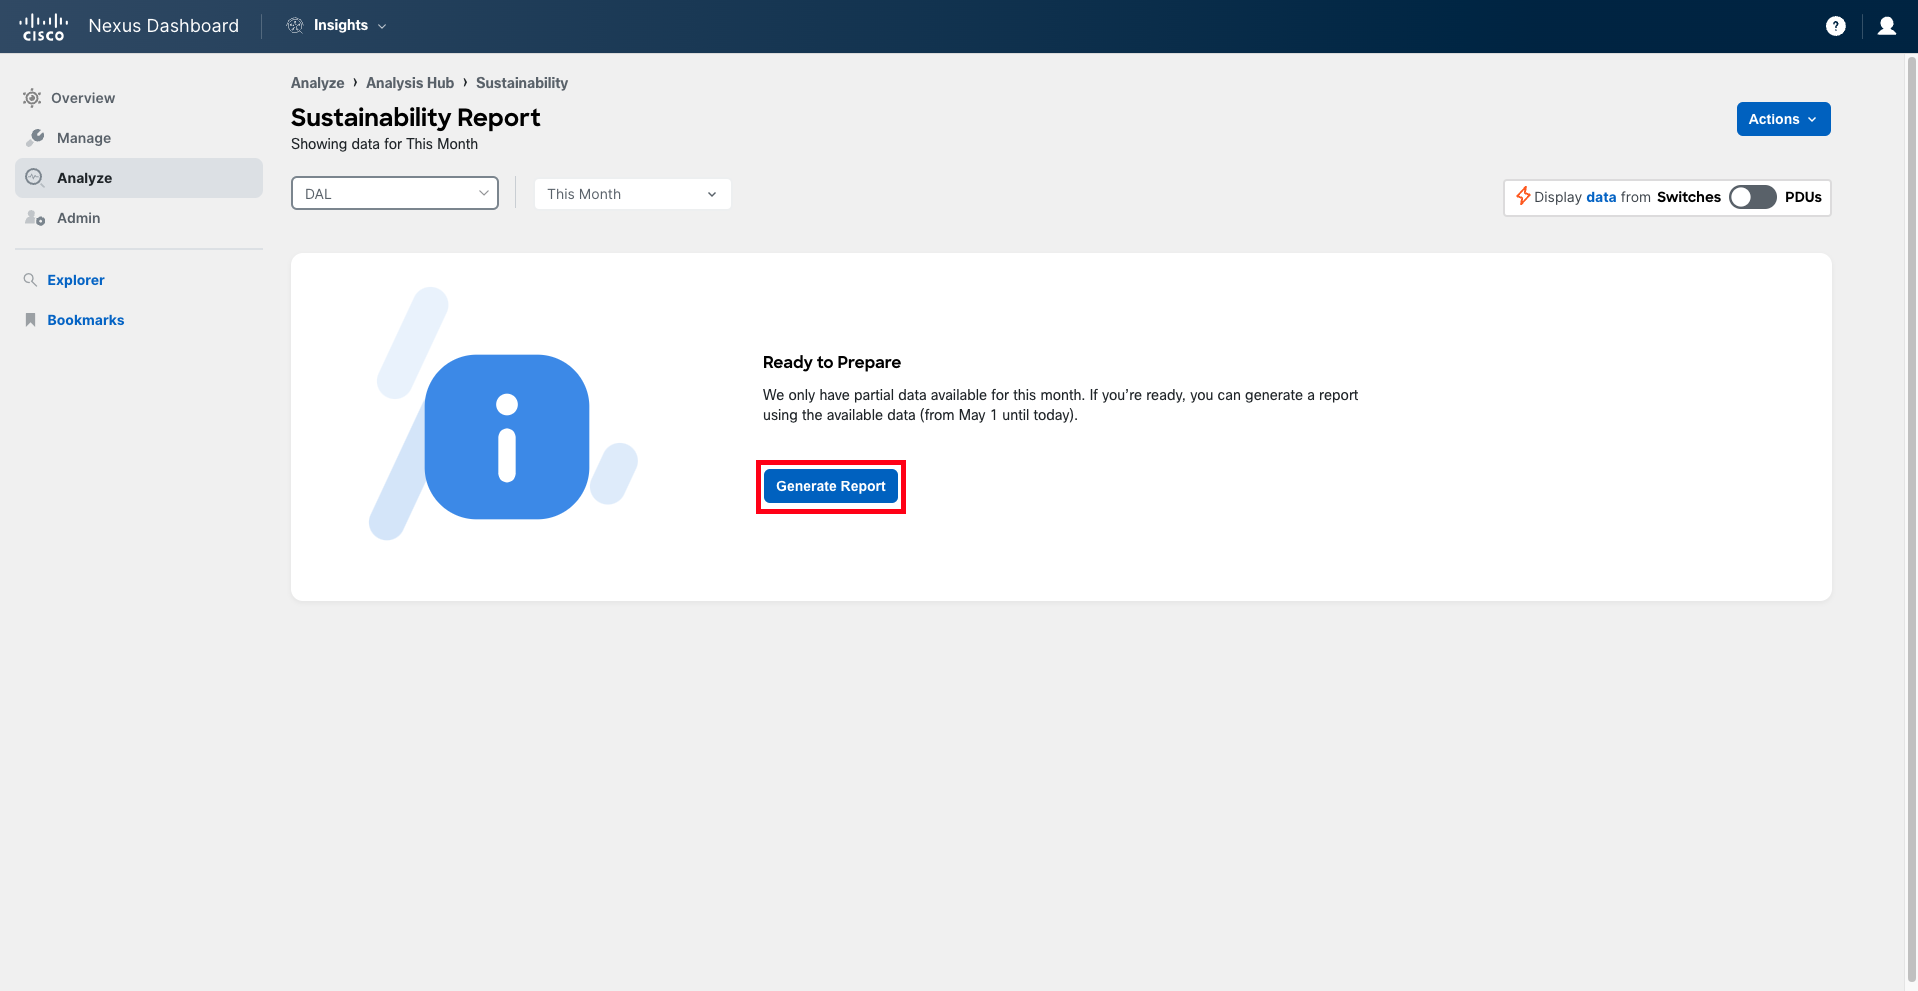
Note that depending on what other users have done previously, you may see that the report is already generated or not. If it has not been generated yet, click on Generate Report. Wait a few seconds for the report to be generated.
Note
For the current month, the report can be re-generated by simply changing the energy cost in Site Energy Settings.
Step 4
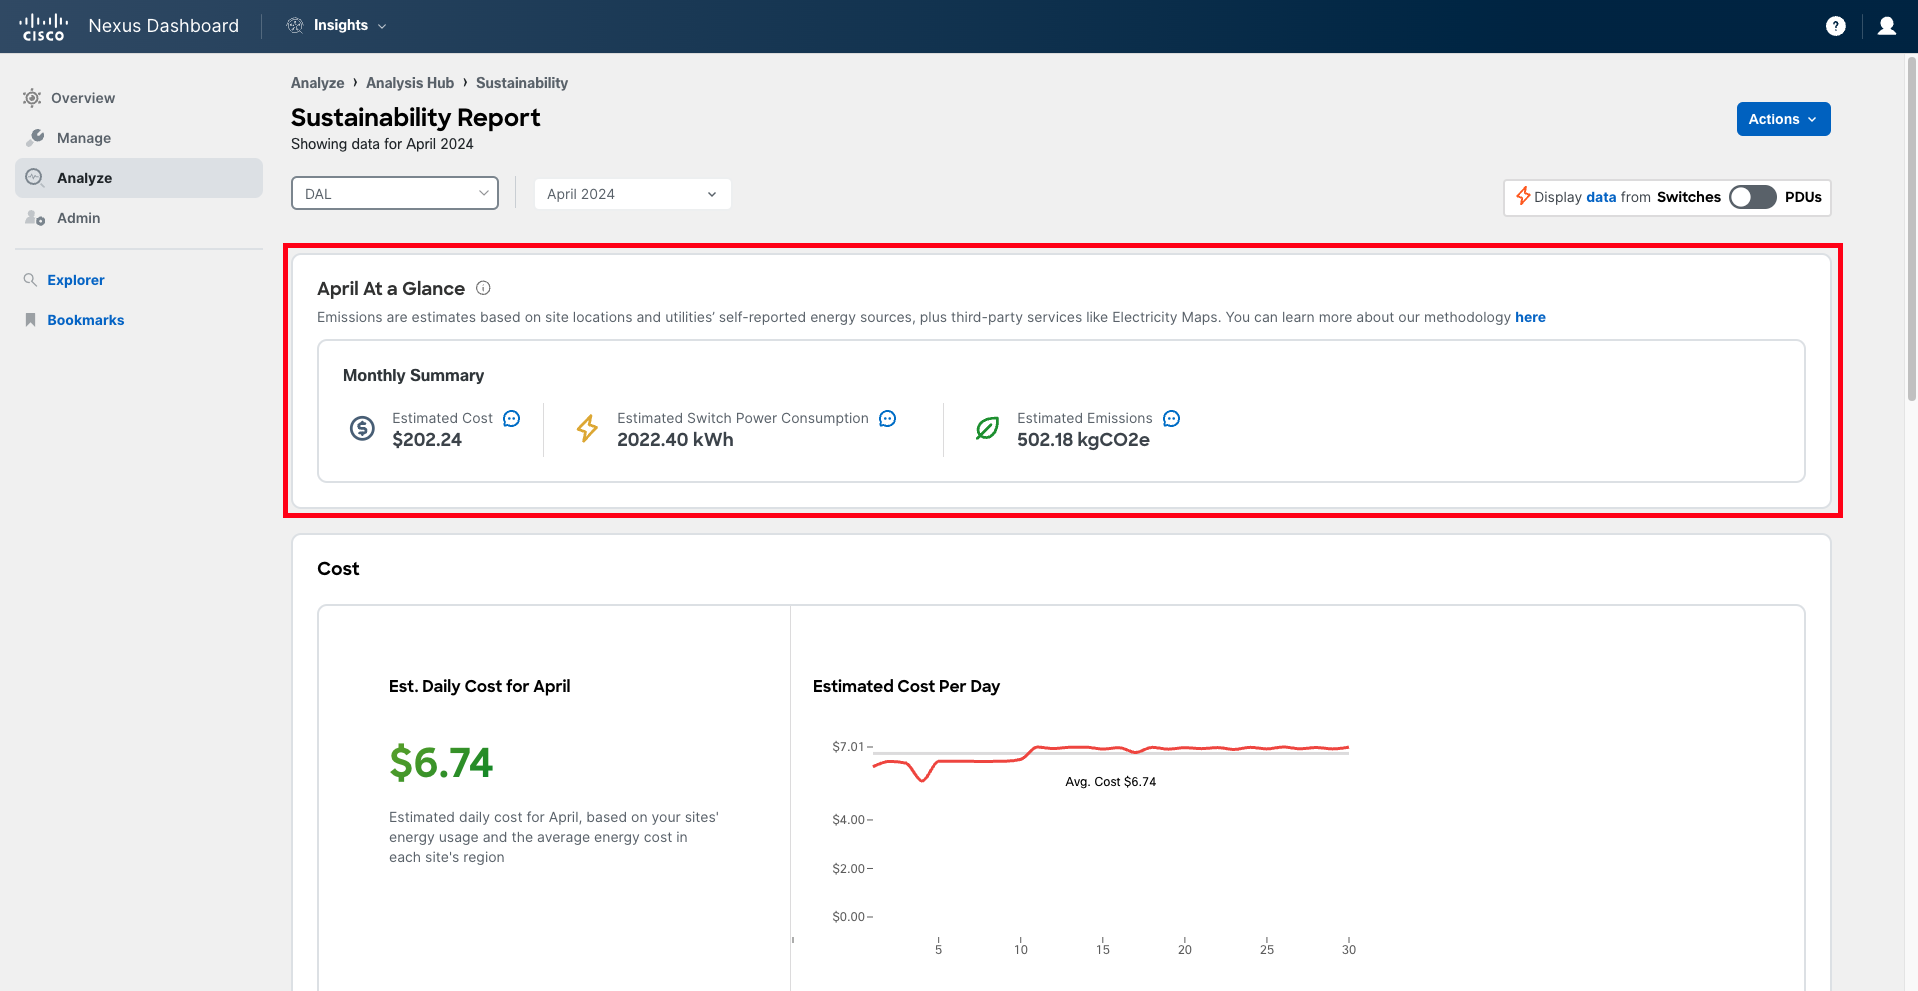
Once the report is generated (or if it has already been generated), you will be able to explore the information within it.
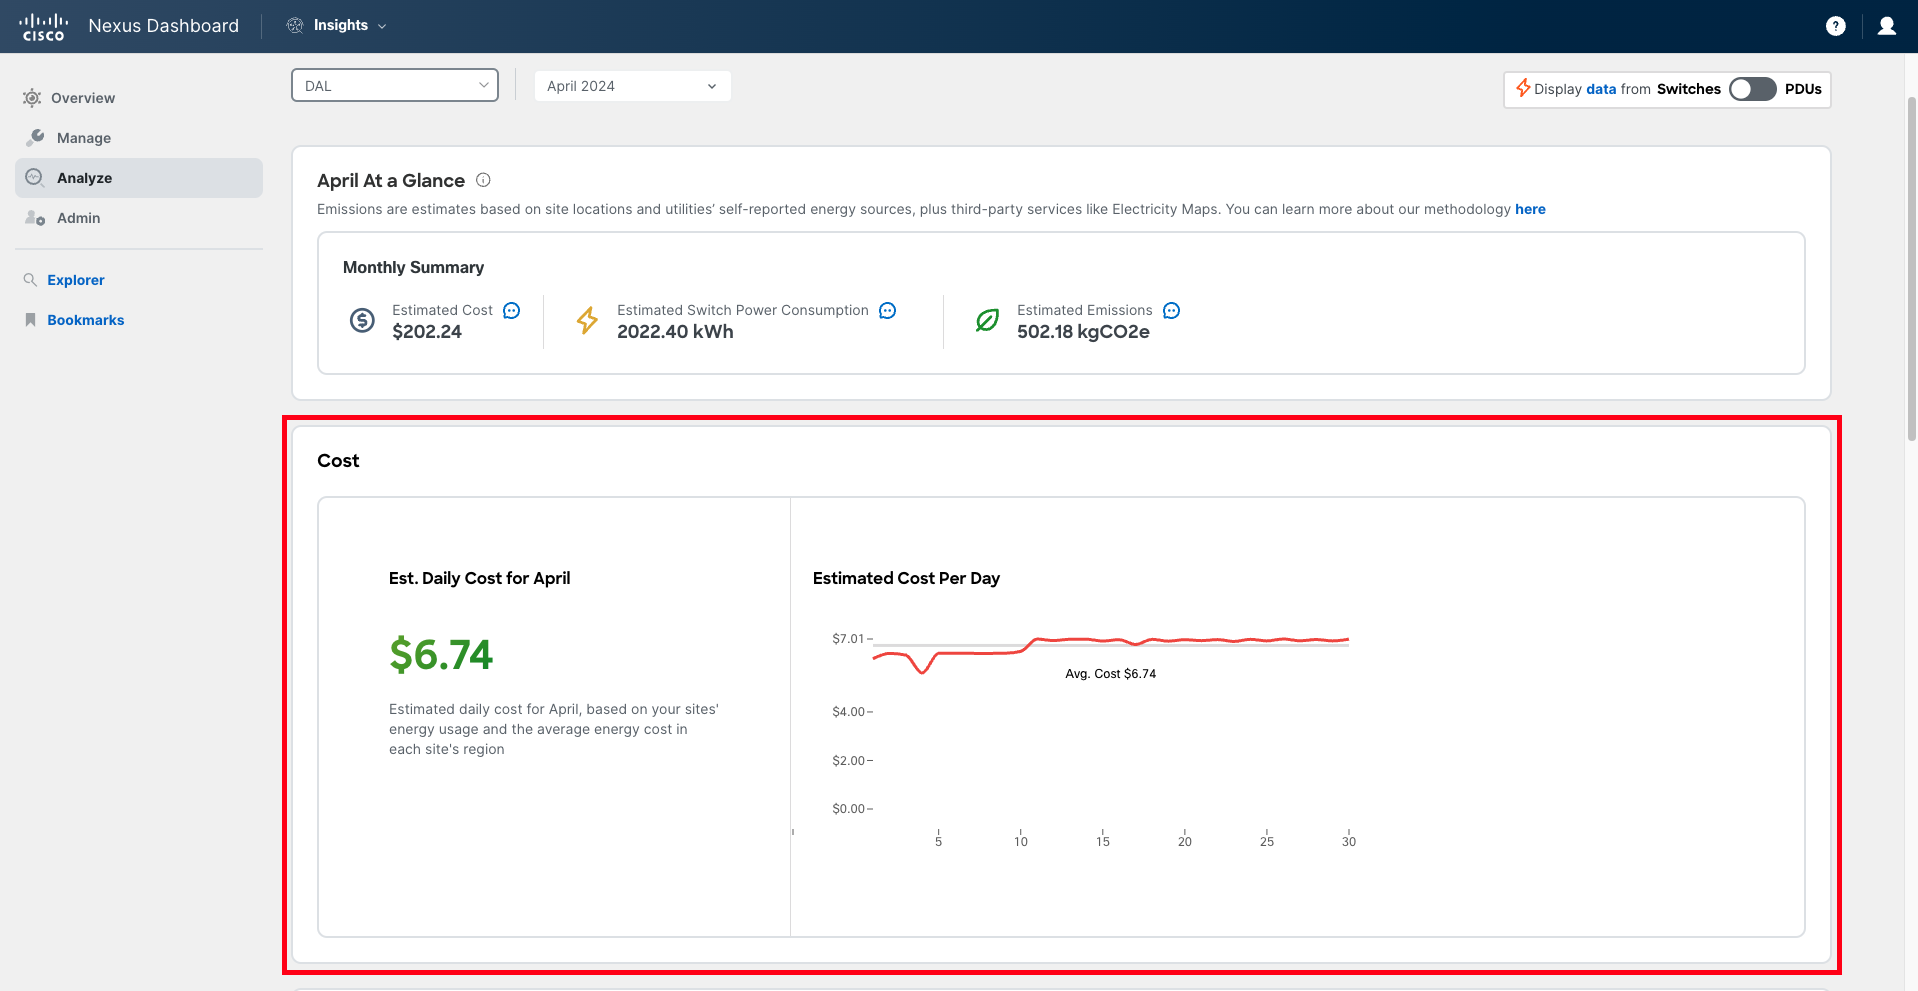
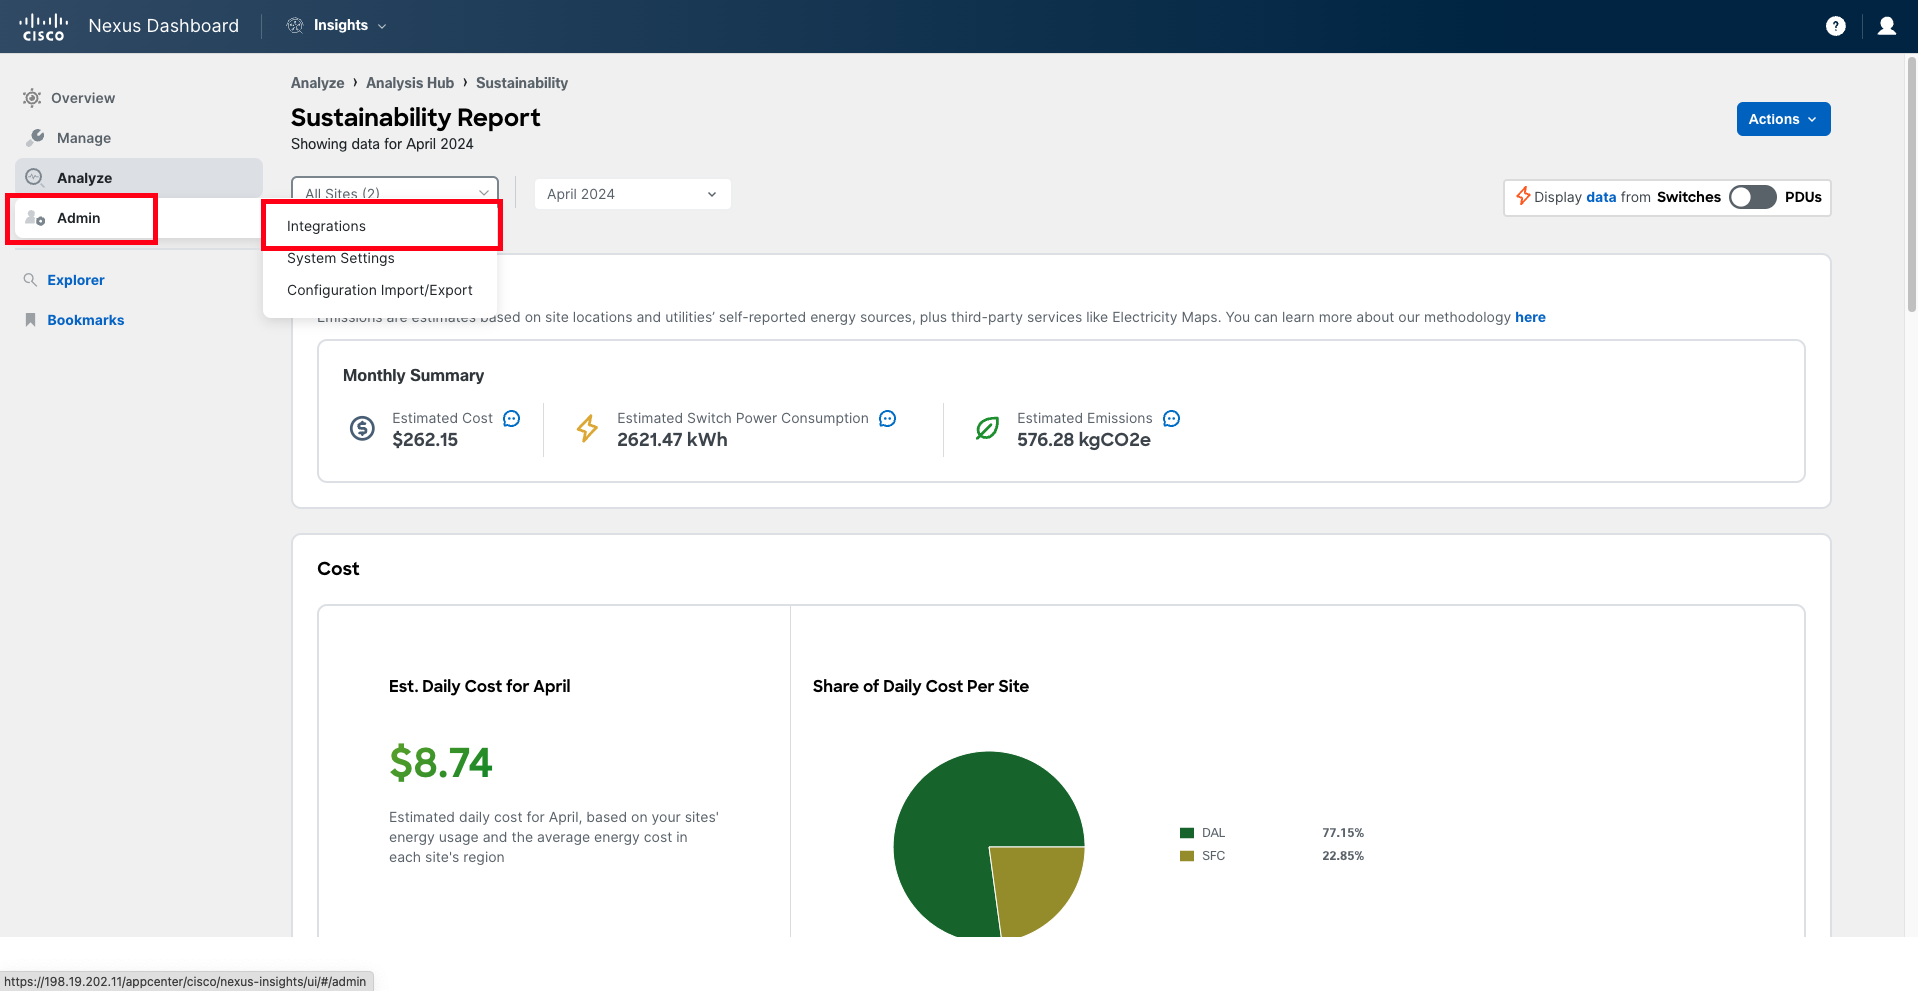
At the top, you will find a summary for the selected month in the three areas that were mentioned earlier: Power Consumption, CO2 Emissions, and Cost.
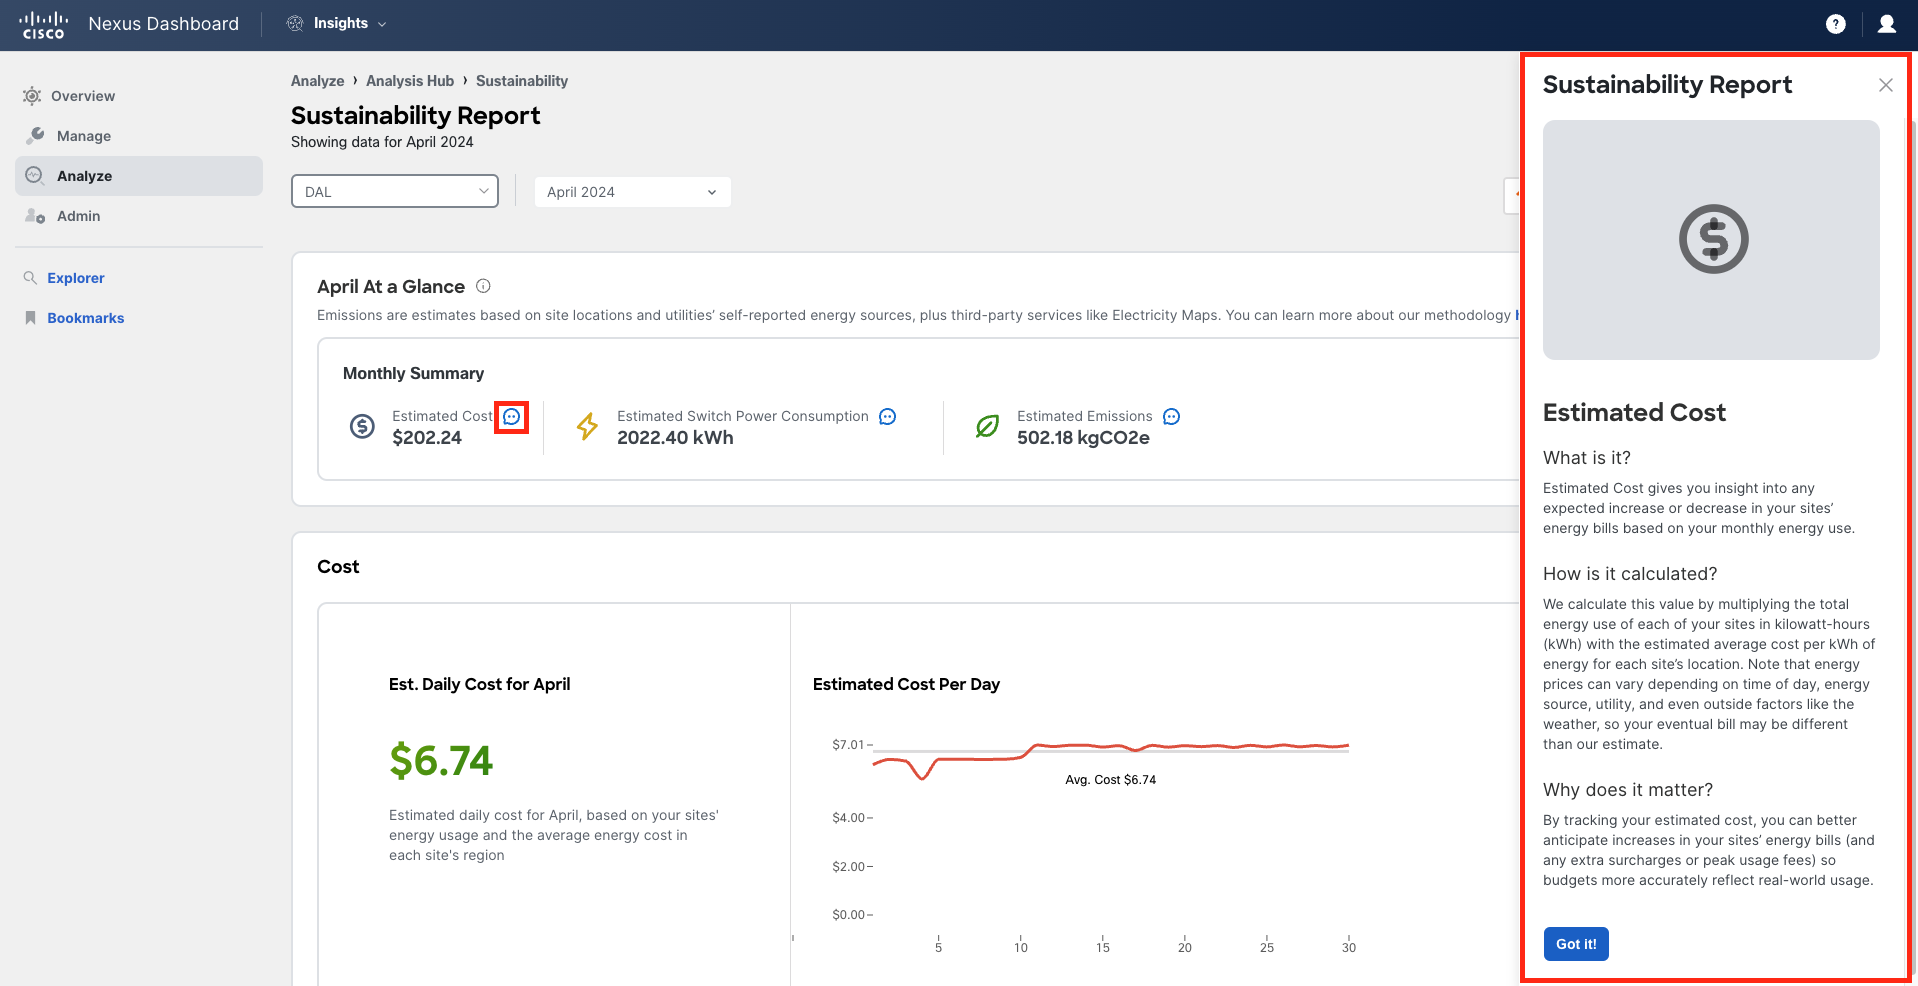
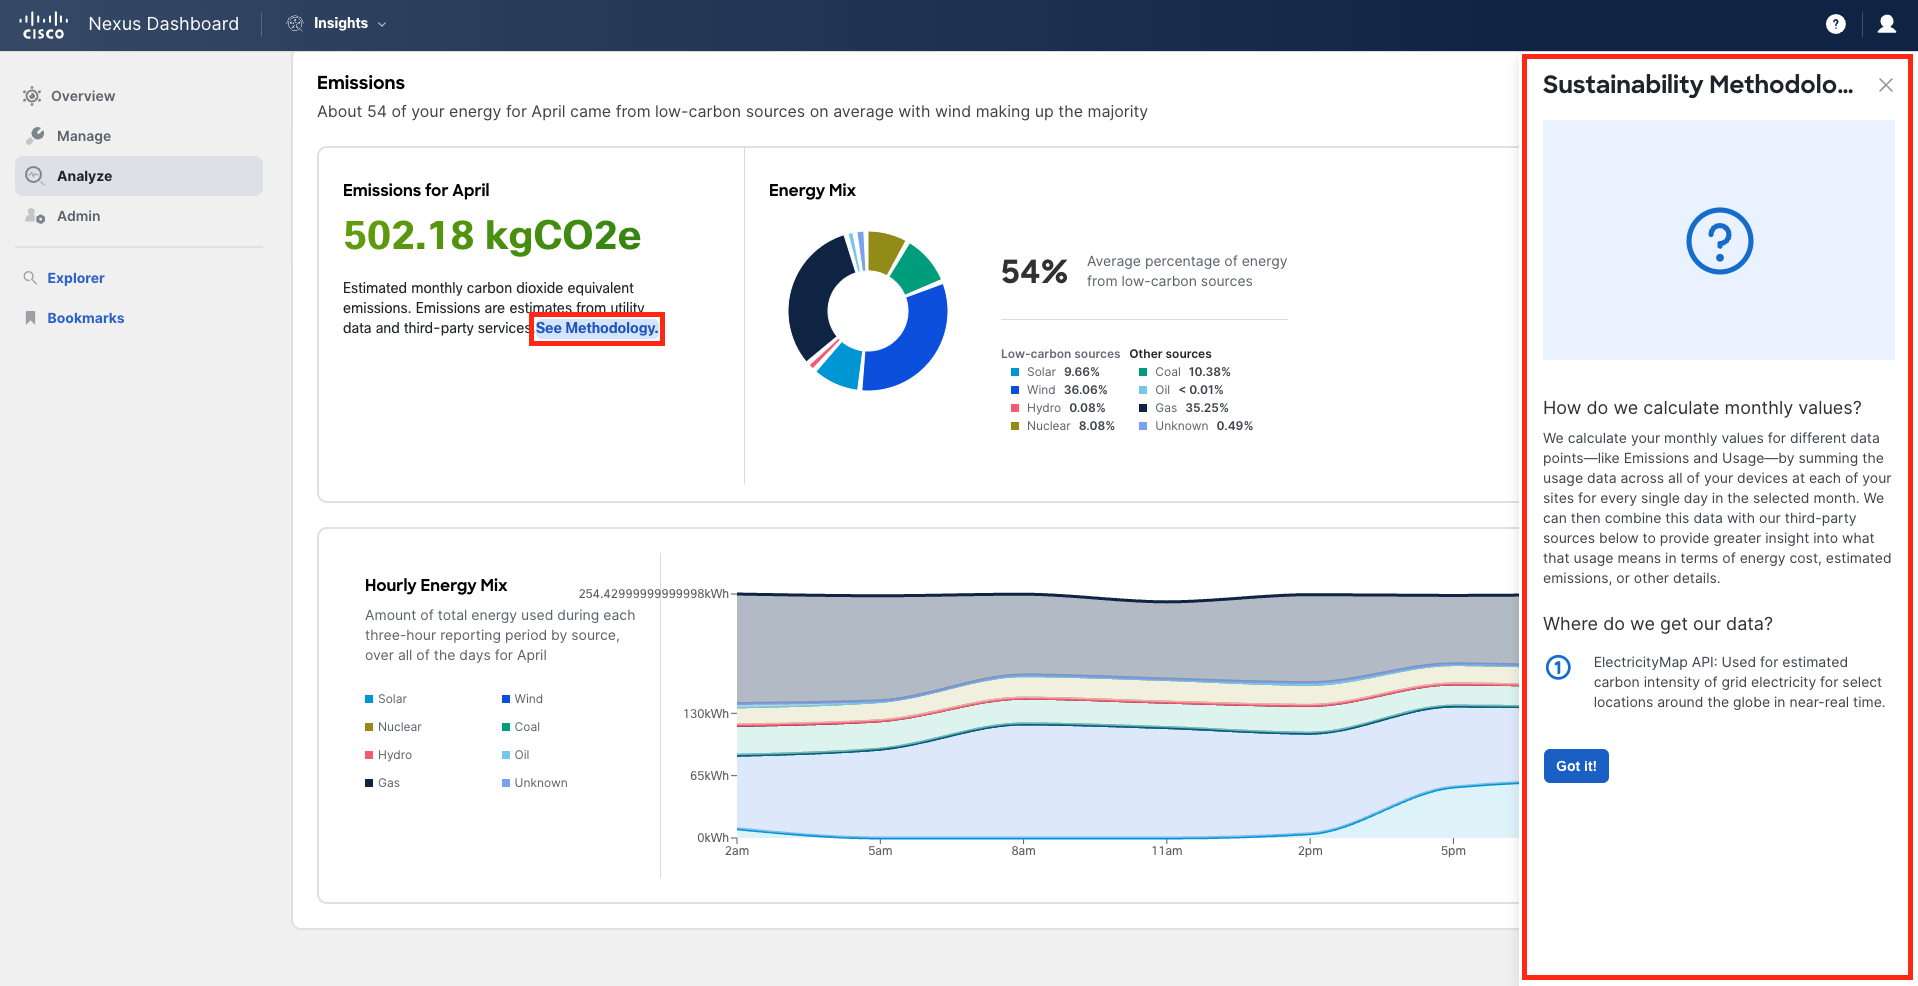
Next to each of these three areas, you will see a dialogue icon. Clicking on that icon will open a panel on the right-hand side that explains more details about how the data in the report is calculated. Clicking the hyperlink in the sentence "You can learn more about our methodology here" will provide more details about the overall methodology we use, as well as how we use the ElectricityMaps provider. Explore these informational panels yourself before moving forward.
Now that we have a better understanding of how the data is calculated, let's explore how the data is presented in the report:
The Cost section shows different information depending on whether you have selected a single site or multiple sites. If a single site has been selected, this section shows the estimated average daily cost for that site, as well as an evolution of that cost throughout the month.
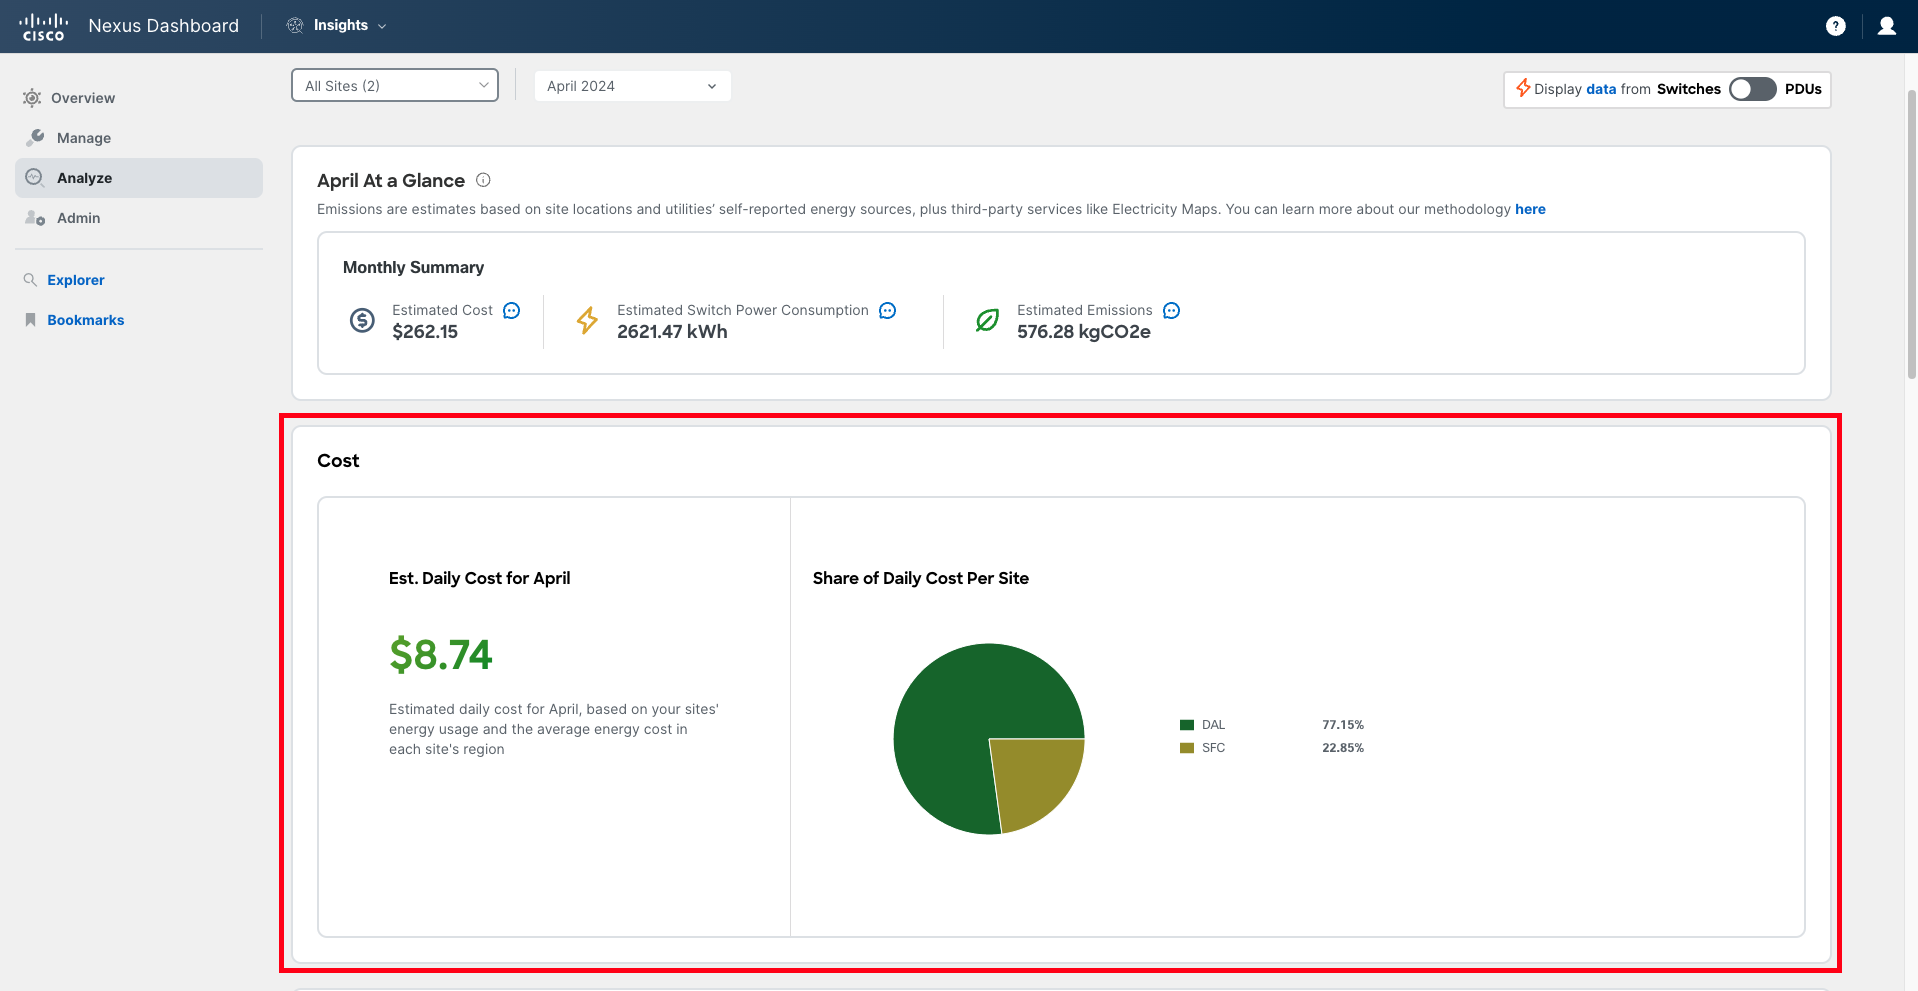
However, if multiple sites have been selected, this section shows the estimated average daily cost for all the sites combined, and a pie chart that illustrates how much each site contributed to the total daily cost.
The Energy section displays a month-long graph and compares the energy consumption with the previous month’s usage.
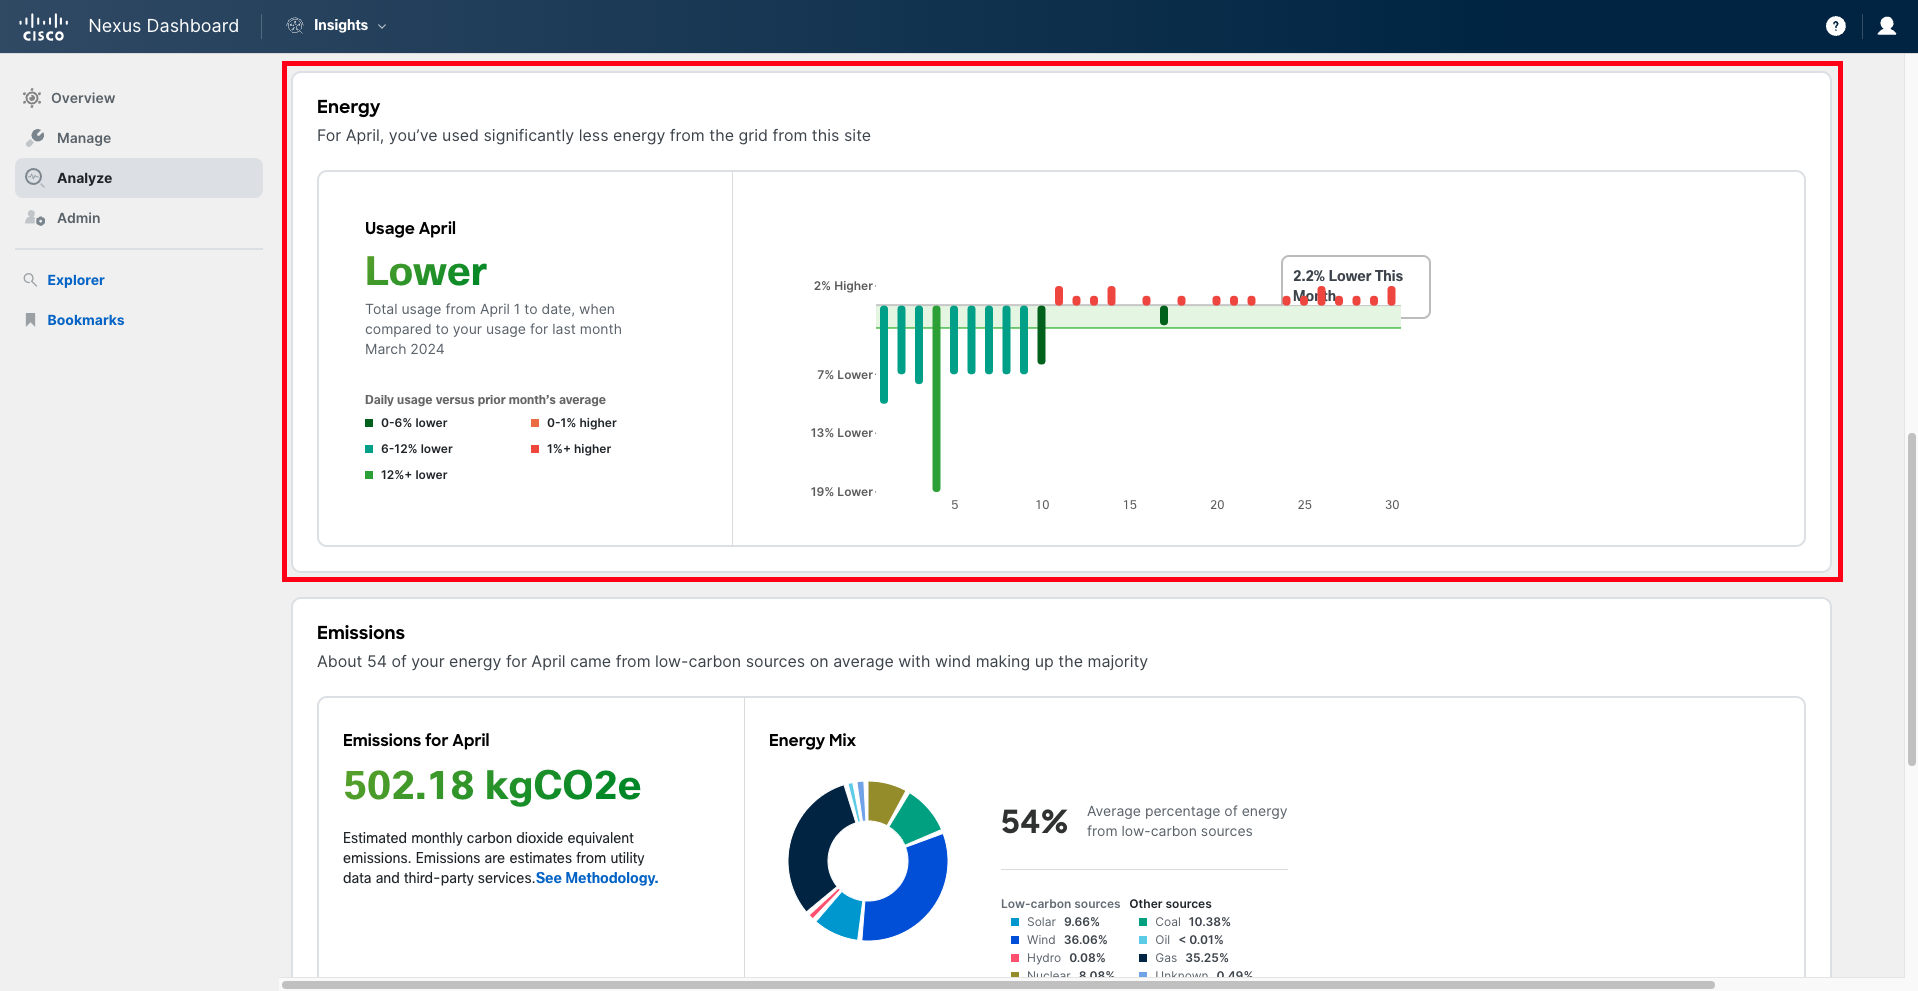
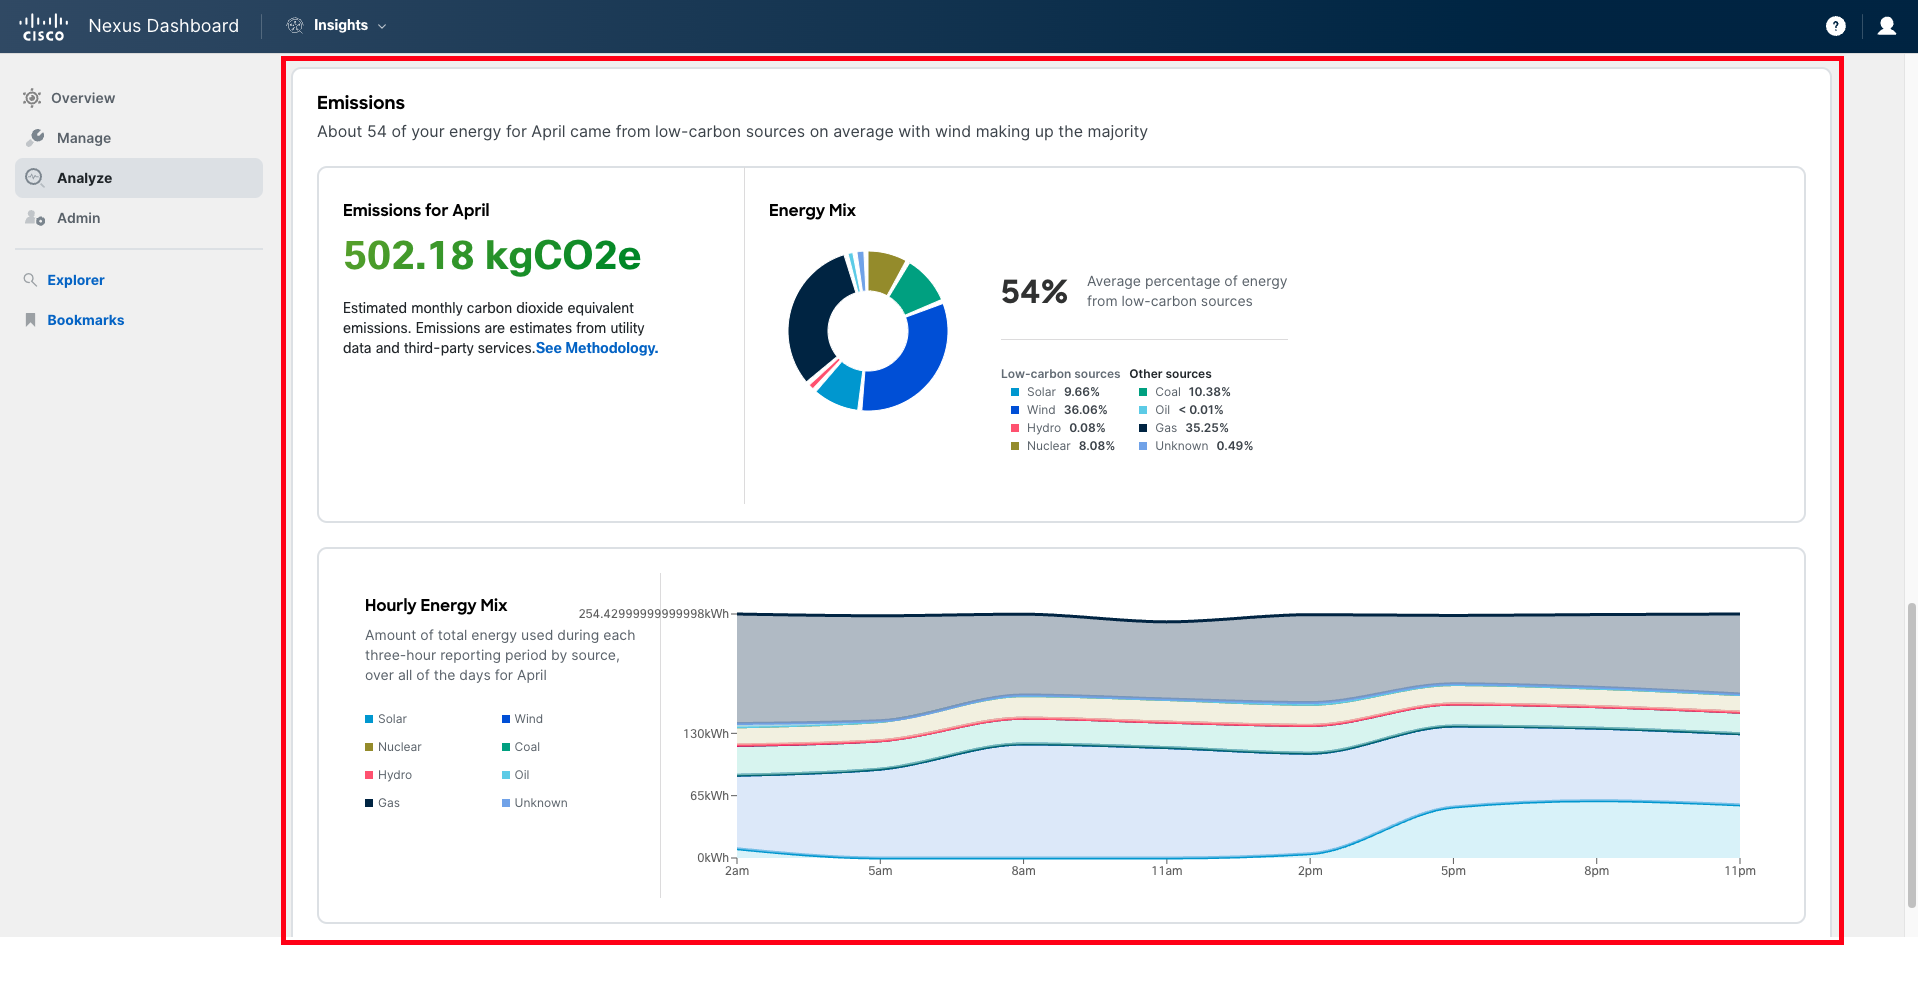
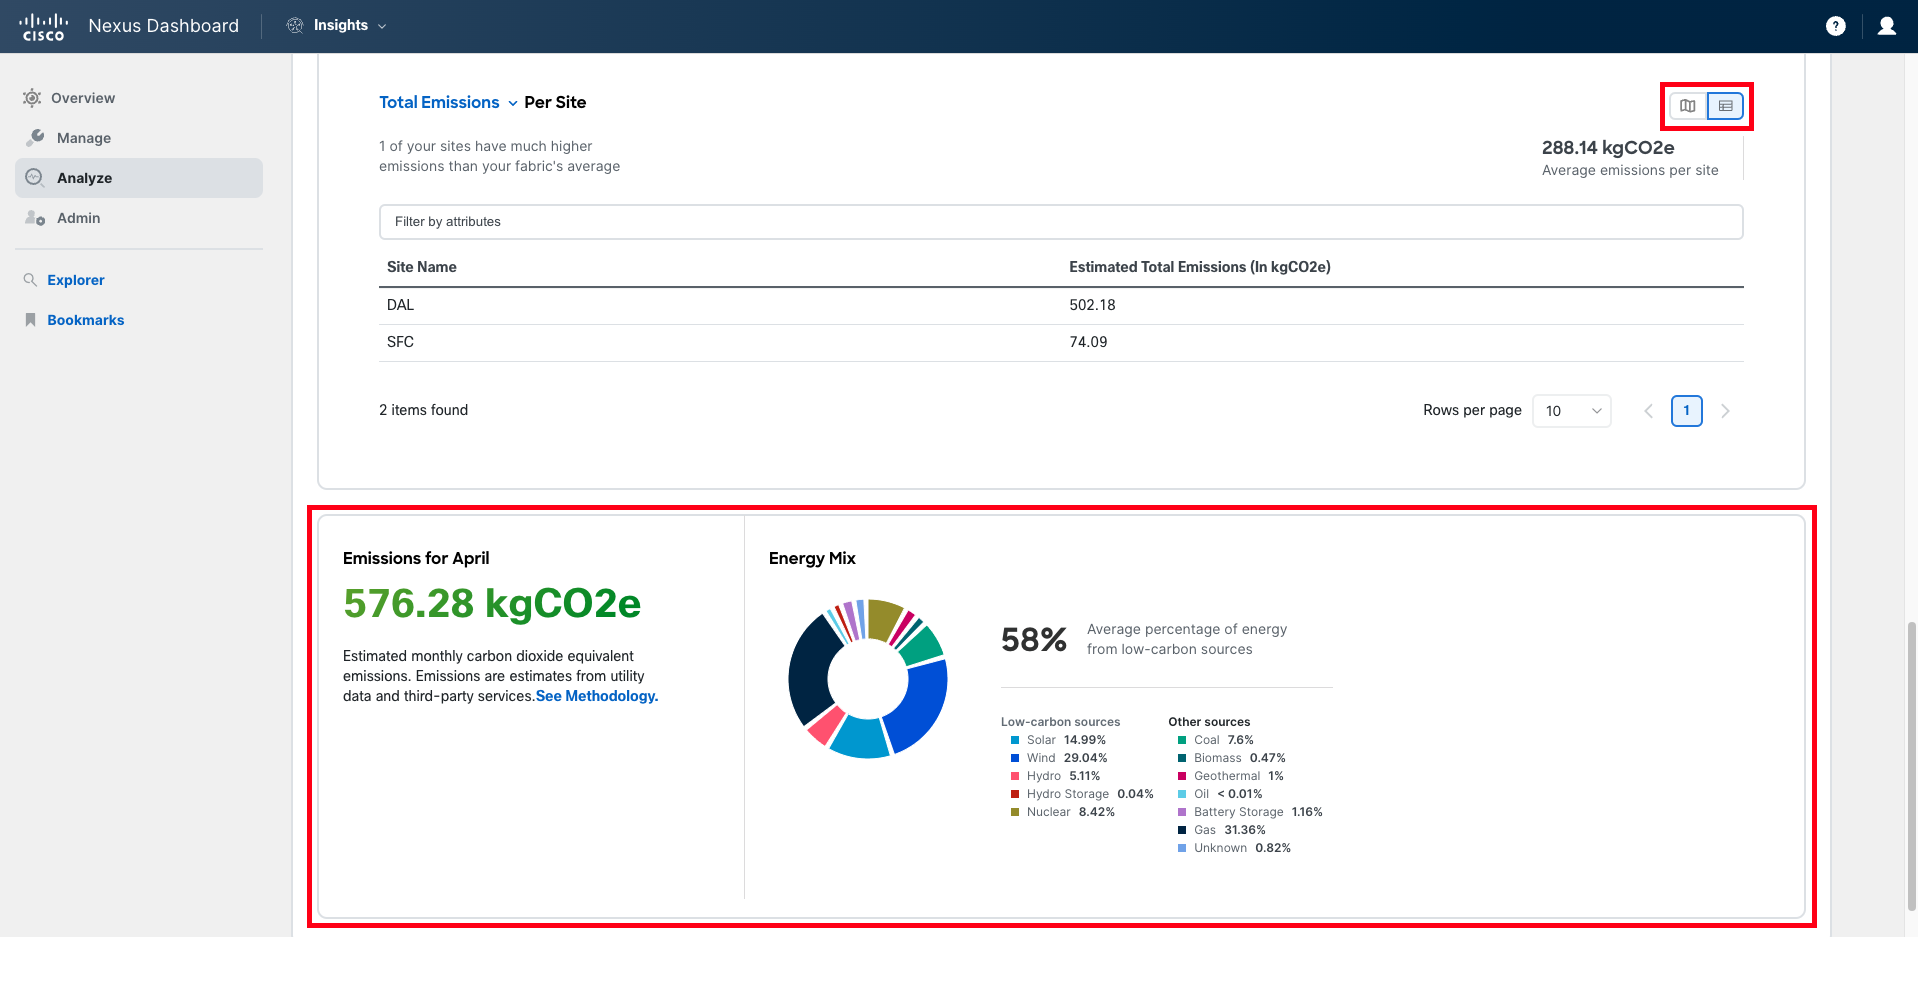
The Emissions section also displays different information depending on whether you have selected one or multiple sites. When a single site is selected, this section displays the estimated emissions for the month (in kg of CO2e), as well as information about the energy mix. The energy mix for the site is presented both as a global average and based on the hour of the day, allowing visibility into how the energy mix varies at different times of the day for that particular location.
When multiple sites are selected, the hourly distribution of the energy mix is not displayed. Instead, you can see a heatmap showing the carbon emissions for a given site, represented on a world map, as well as the average energy mix for all your sites combined.
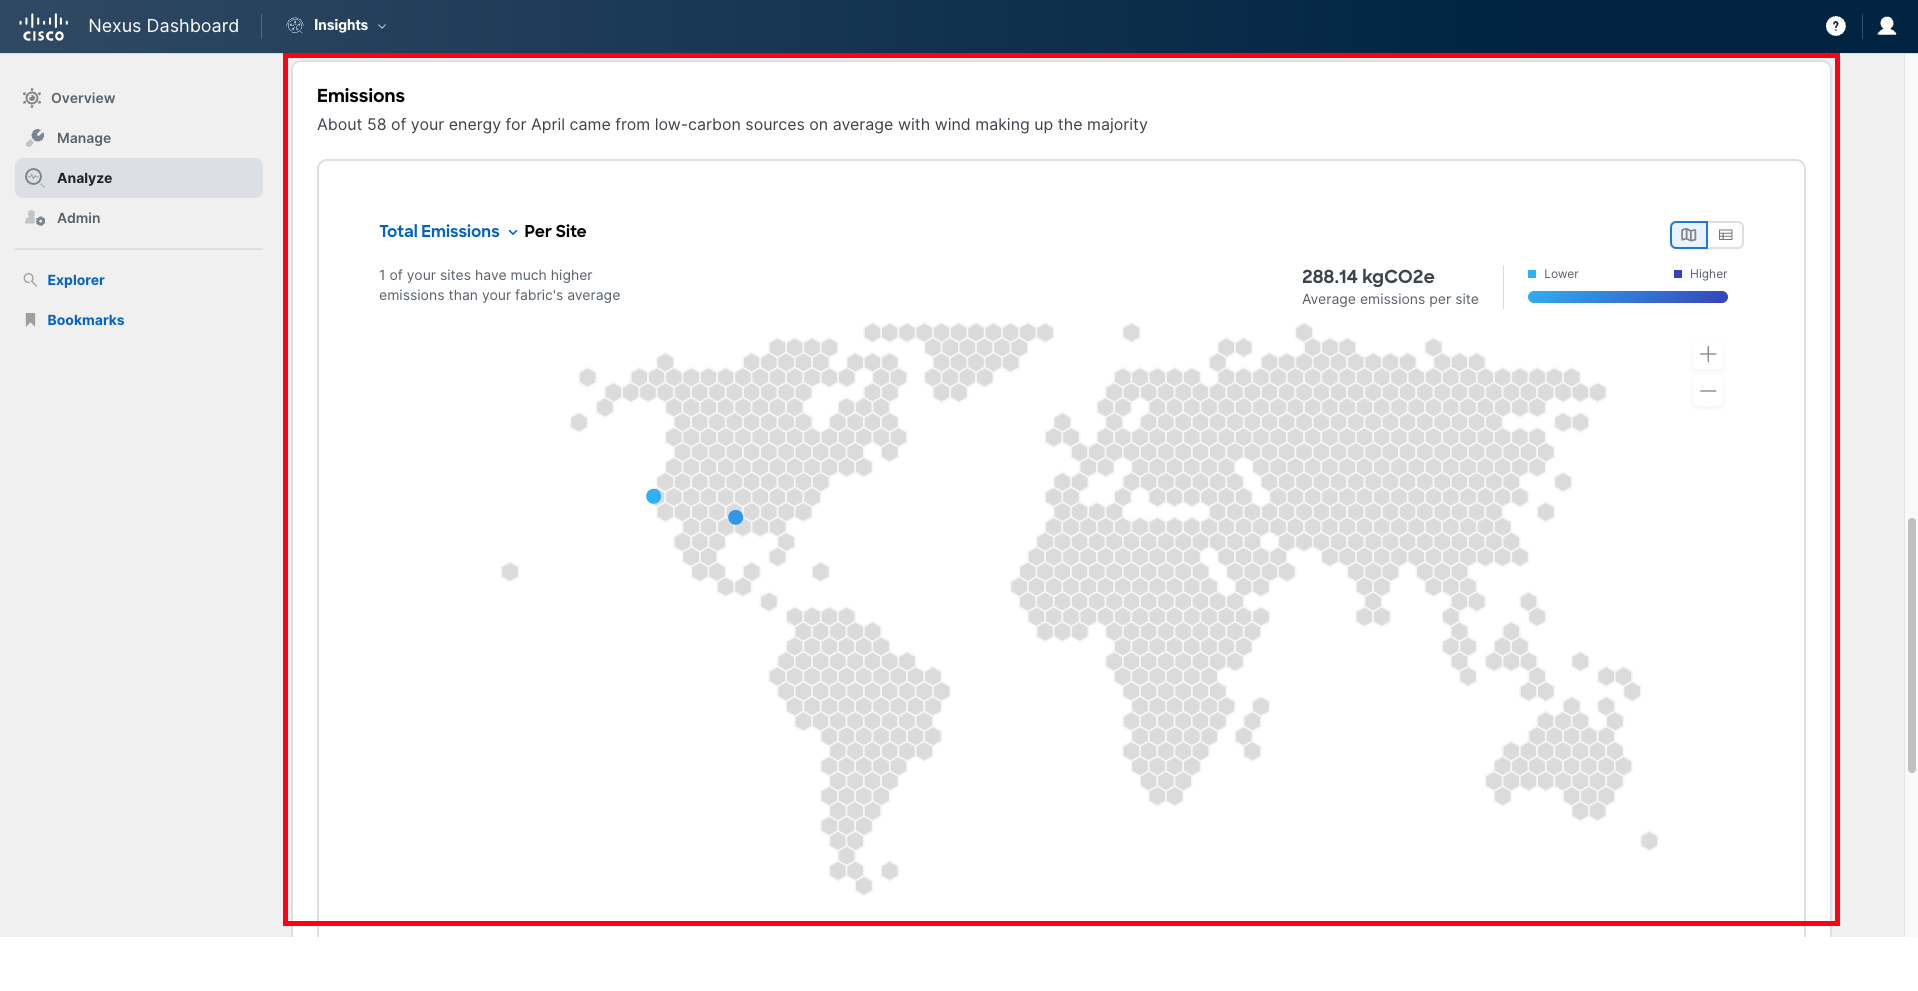
The map can be replaced with a tabular view by using the toggle shown in the top right corner of that section.
From this section, you can also open the informational panel that explains the methodology that Nexus Dashboard follows to calculate the CO2e Emissions.
Step 5
The information we have seen so far corresponds to the energy utilization of the fabric devices that are part of the sites that have been onboarded onto Nexus Dashboard.
To get additional insights for other devices in the data center, Nexus Dashboard 3.1 is capable of integrating with PDU vendors, such as Panduit, to obtain power consumption metrics from their Smart PDUs.
At this moment, only Panduit is supported. Other vendors will be added in future releases.
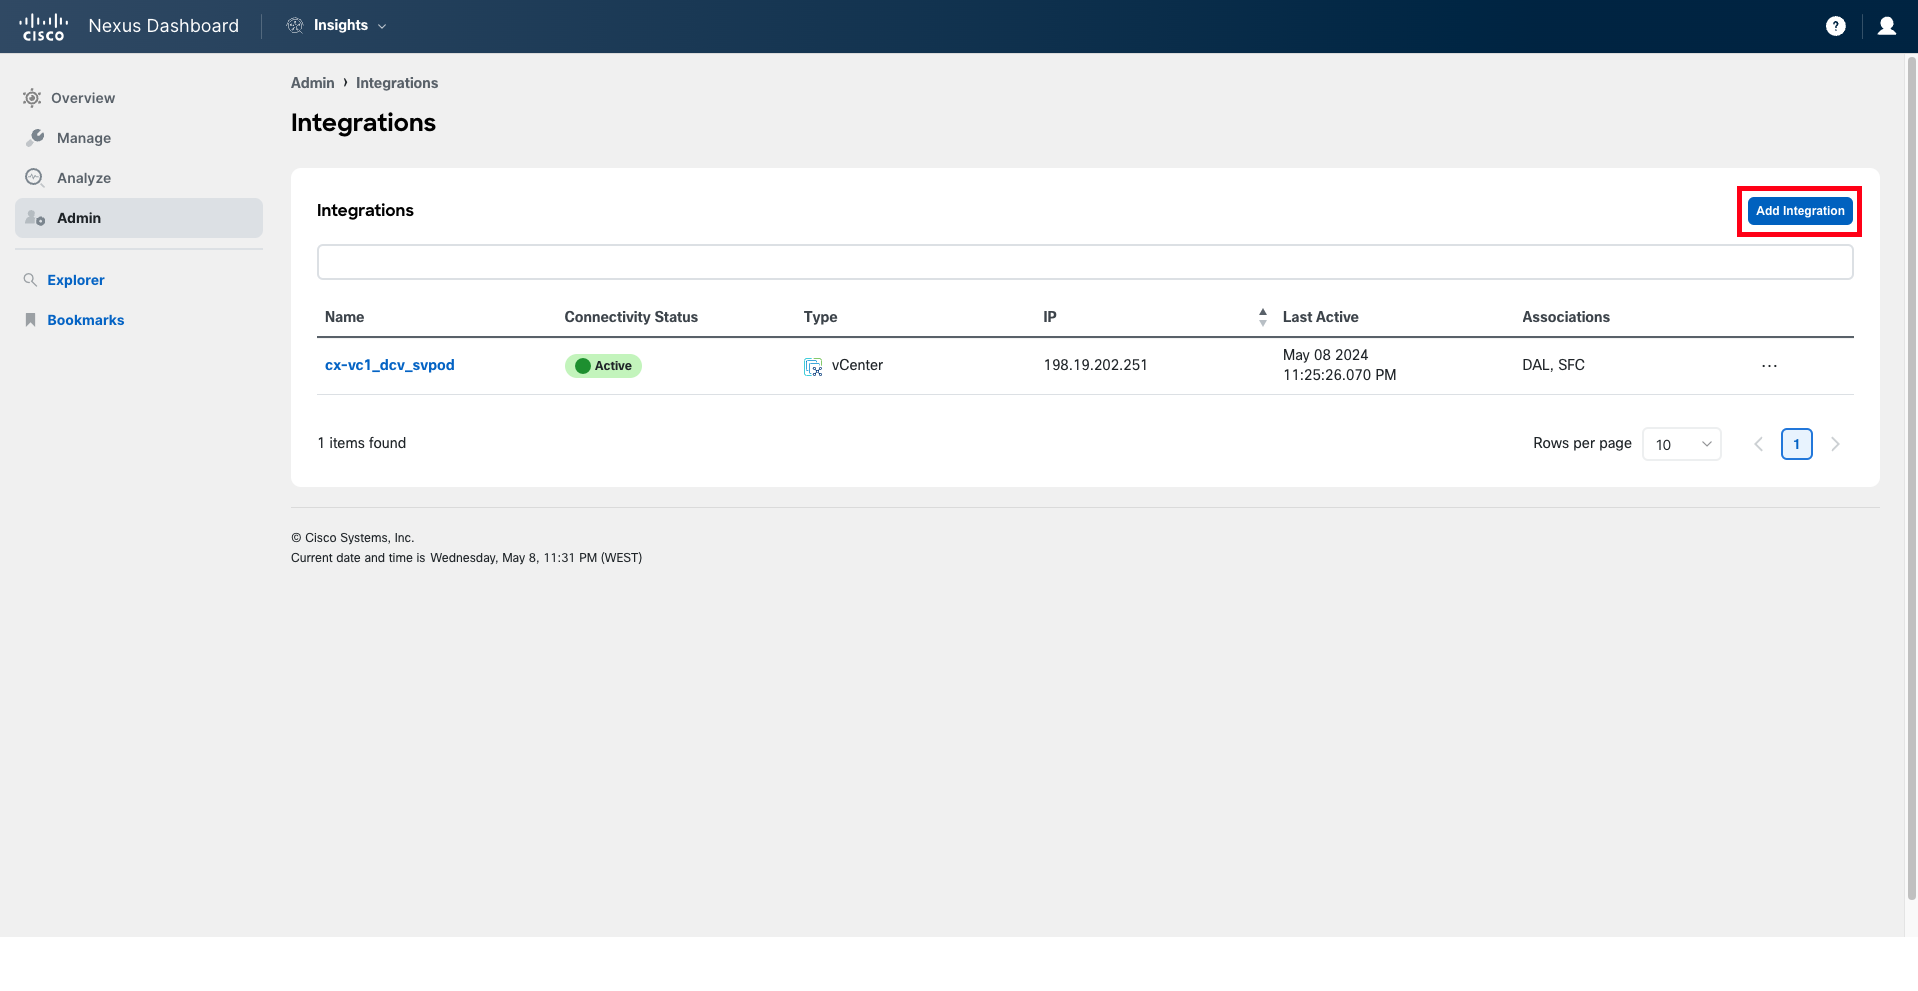
The integration with Panduit is configured under Admin > Integrations.
There, you can click on Add Integration and select Panduit PDU.
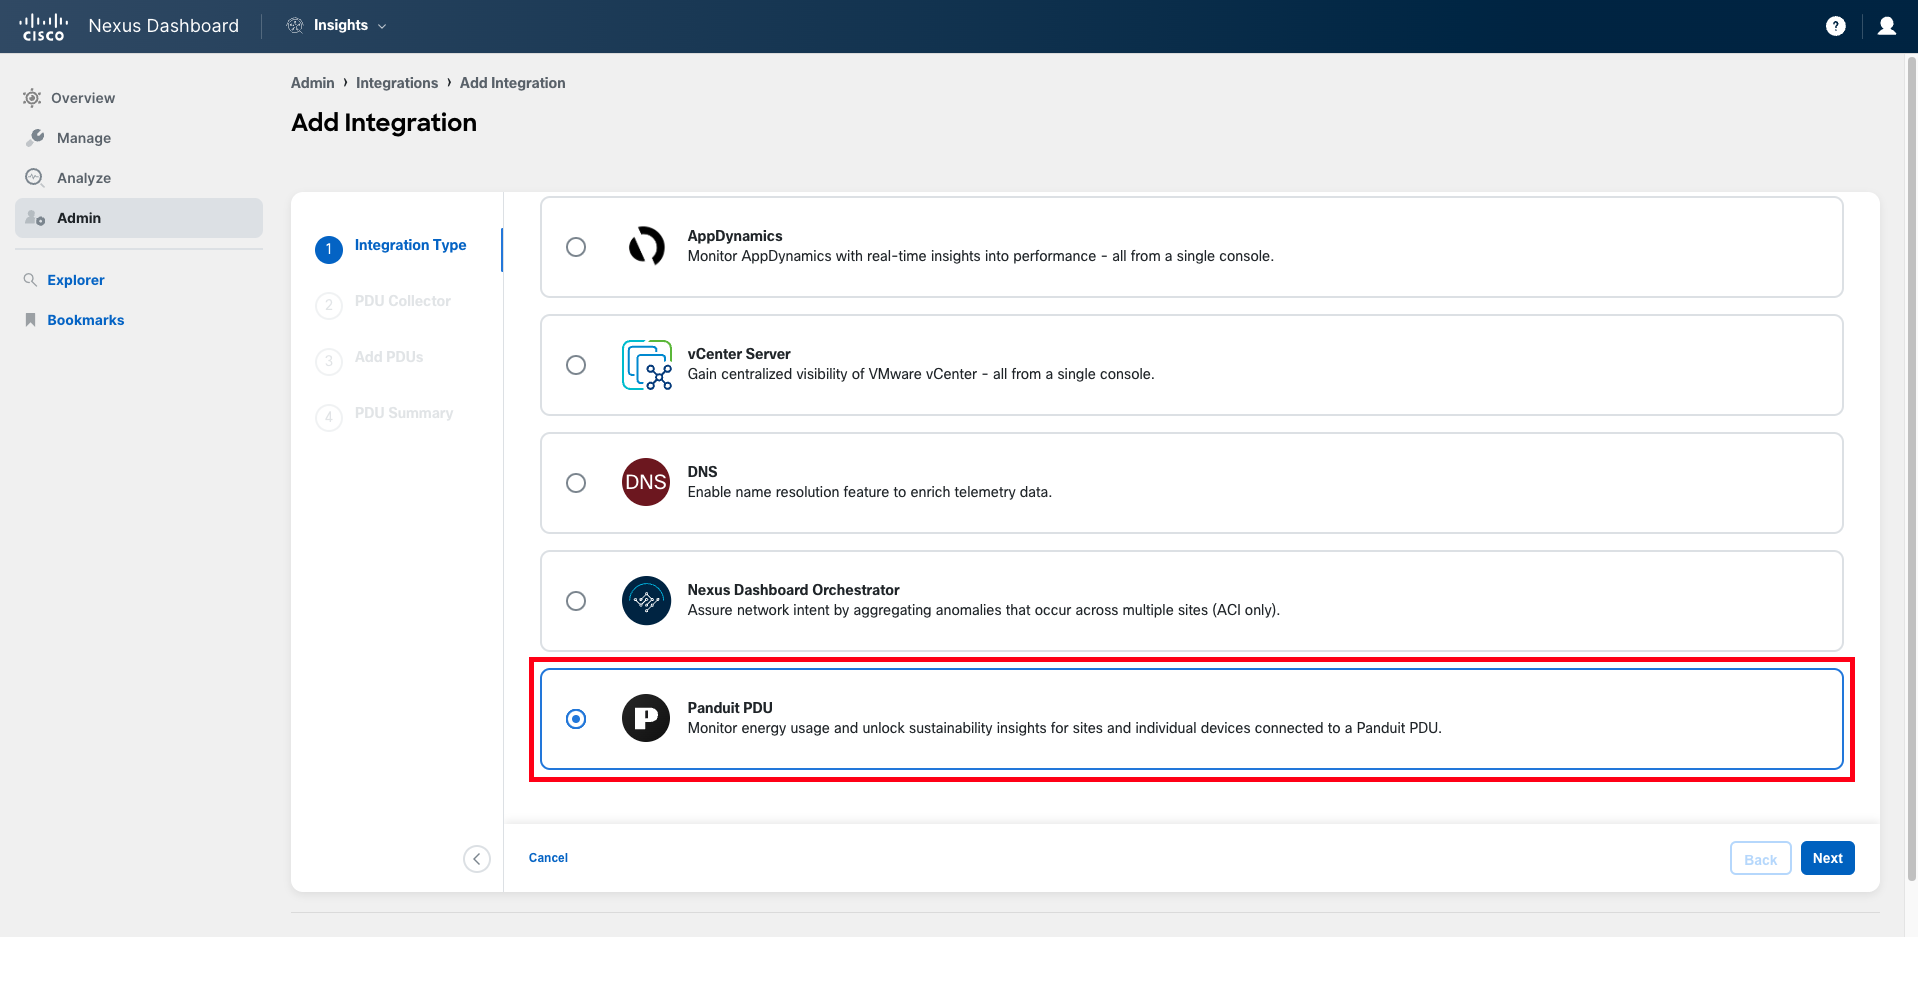
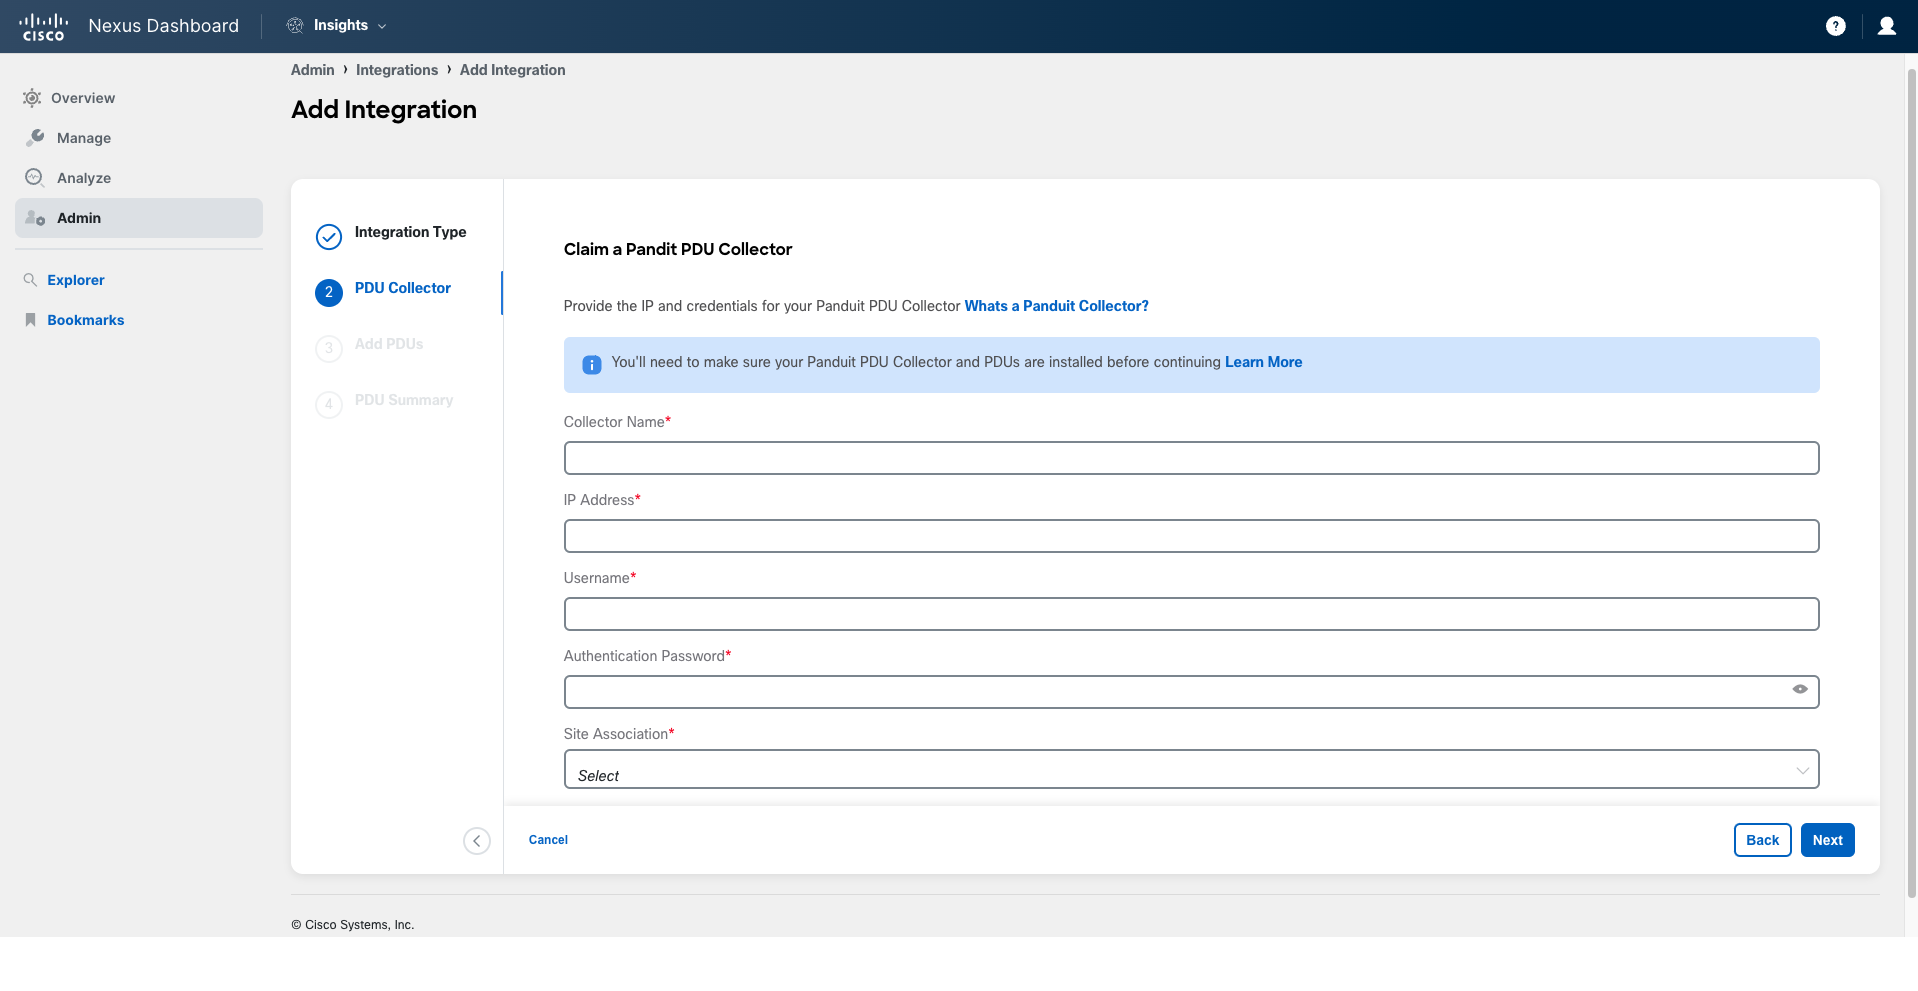
In the subsequent steps, you can provide the details to connect to the Panduit PDU Collector, a lightweight piece of software that gathers telemetry information for one or multiple PDUs at your site, and specify the PDUs you want to pull telemetry from.
Once the integration is configured and operational, you can toggle the sustainability report information to show either the DC switches information or the PDU information.
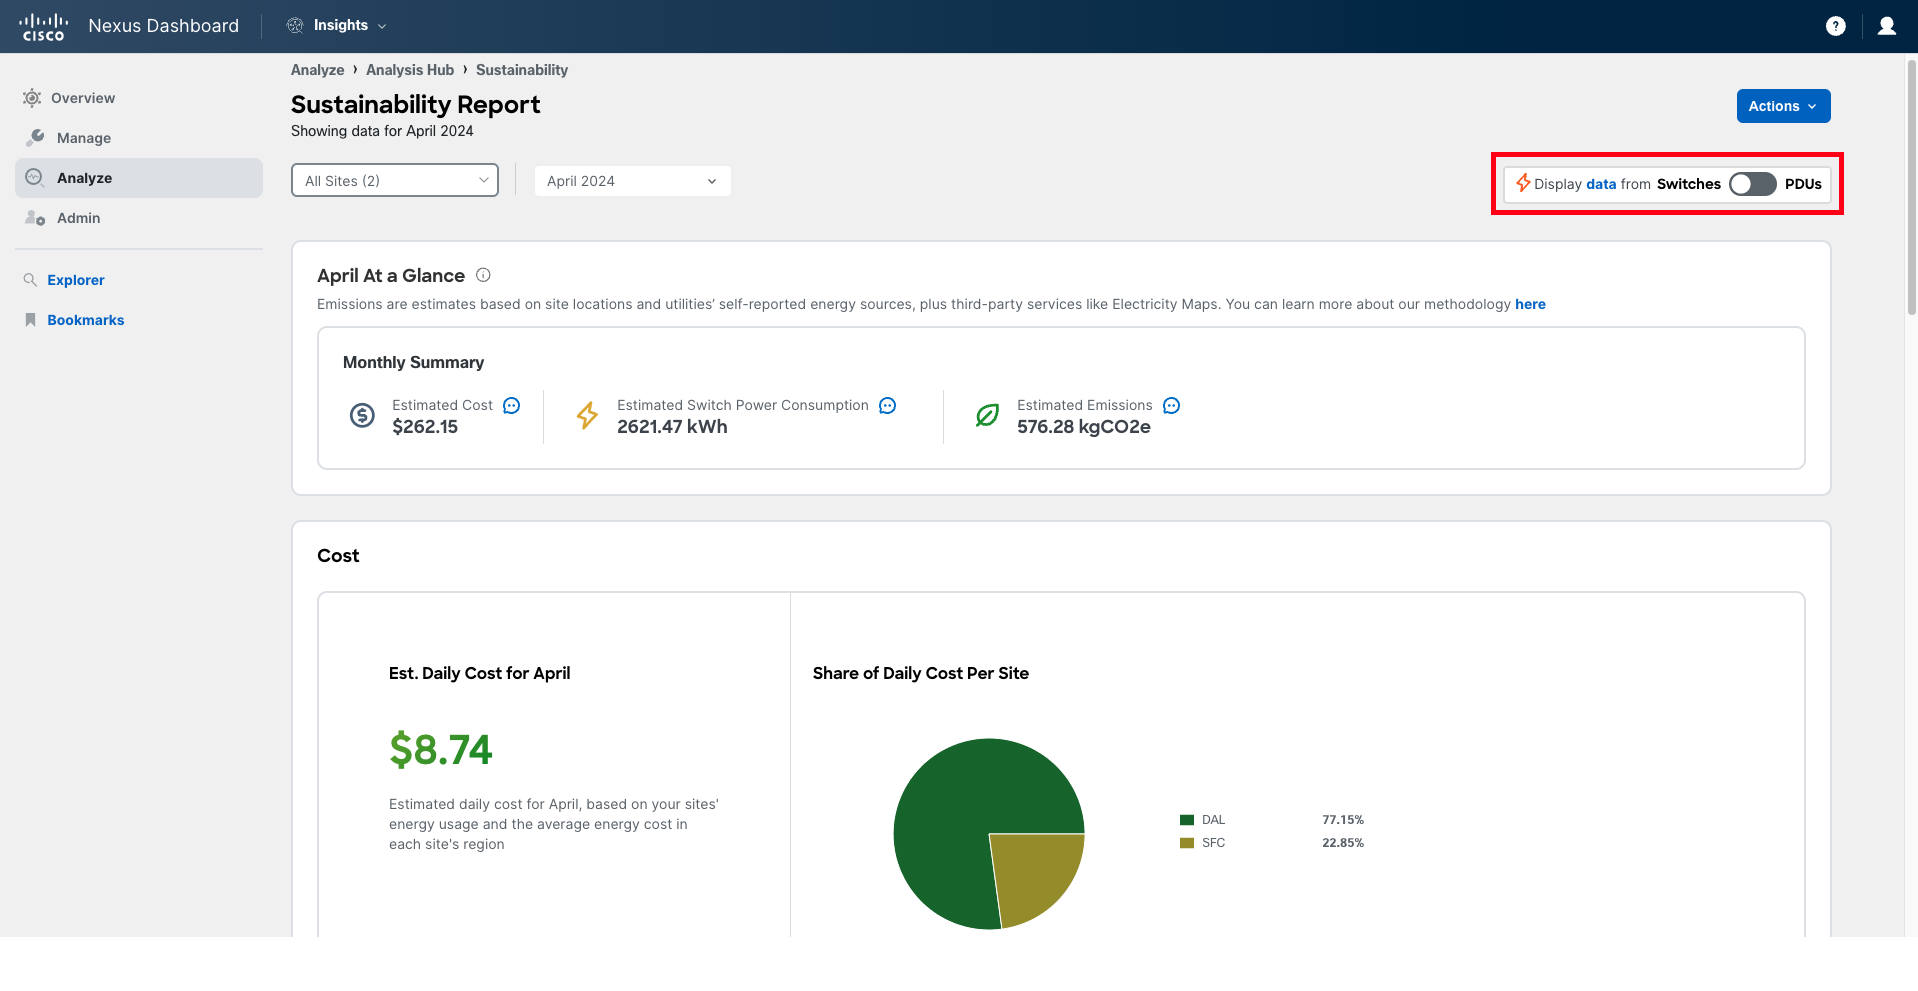
Note
There are no Panduit PDUs in the environment you are using. Therefore, no data will be displayed in your case if you toggle between switches and PDUs information.
Step 6
Explore the Sustainability Report for yourself. Change the report view for each site, for both sites, for previous months, and the current month. Investigate all the possibilities and views of the report. Try changing the cost per kWh for the current month and see how it affects the report.
Once you have explored all the current capabilities of the Sustainability Report, proceed to the final section of this lab.