Use-Case 5 - Troubleshooting Flows Scenario 1
Troubleshooting Flows with Connectivity Analysis and Explore
In this use-case, you will be troubleshooting a specific flow-related scenario with a main focus on the Connectivity Analysis feature.
Connectivity Analysis aids in validating the end-to-end path between two endpoints in the network fabric. It generates an intuitive path view, showing all network devices in the path and highlighting any issues encountered that could affect successful communication between the target endpoints. The feature enables you to run an analysis for a flow within the boundaries of a given site. The Connectivity Analysis feature is supported on Cisco APIC release 6.0(2h) and Cisco ACI Switch release 16.0(2h) and later.
Warning
There are specific limitations regarding submitting and running multiple analysis jobs. At a time, up to 10 jobs per site are allowed. At any point in time, only one connectivity analysis job per site is permitted. This means that there might be some jobs in the queue for a few minutes. Please reach out to your proctor if you have a question and be patient.
Scenario
A call was received from your Application team with a request from the Billing team.
"We're experiencing issues with transactions; they seem to be failing constantly. This appears to be a widespread issue, as we're not getting any entries in the DB for transactions."
Additional Information
There were some changes performed last night related to the "database" service, but the team has not observed any issues post-implementation. IP addressing for "cart": 10.x.3.0/24 and "database": 10.x.5.0/24, where x is your Pod ID.
Note
You can also check the Application Structure & Communication information in the Application Topology section, which is part of the flow use-cases section if you haven't done so already. You can find it in the left side navigation.
Based on all this information, you can either try to figure out the problem yourself without reviewing the steps in the Solution section or follow the guide along to find the root cause of the problem.
Solution
Step 1
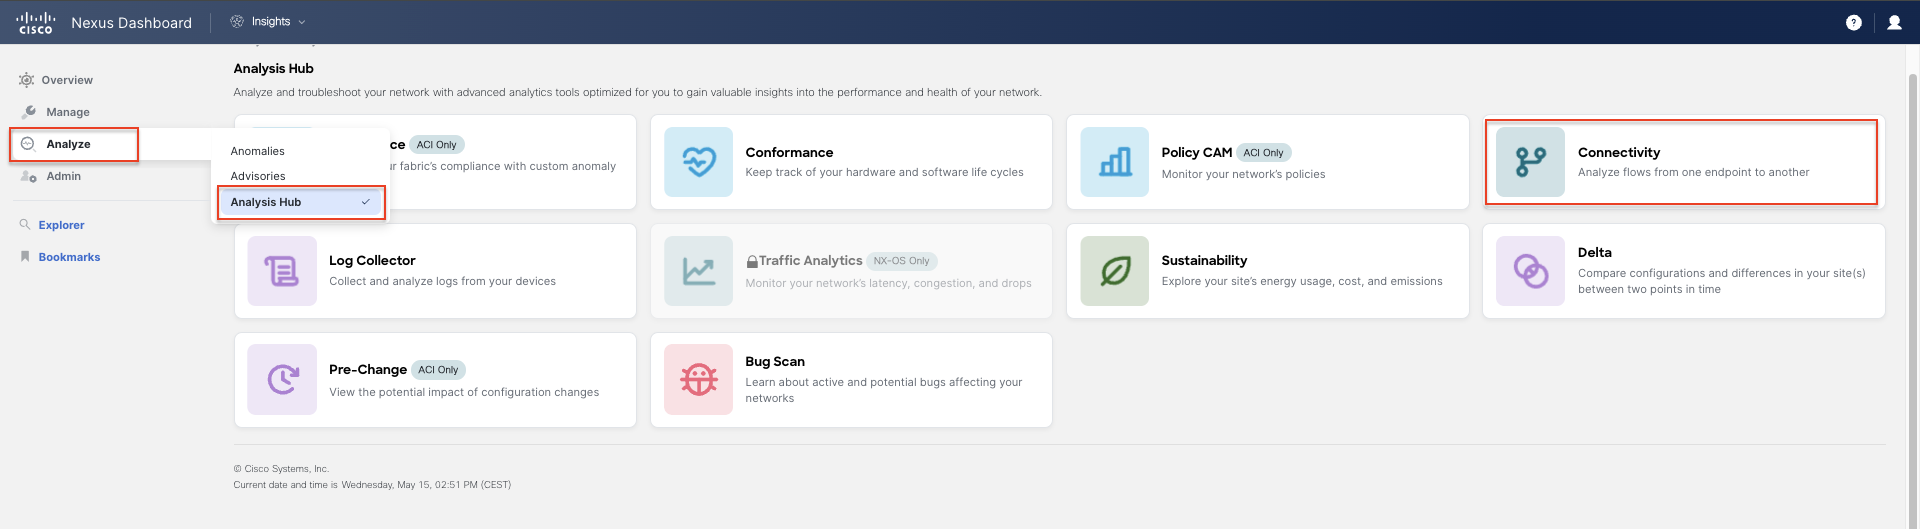
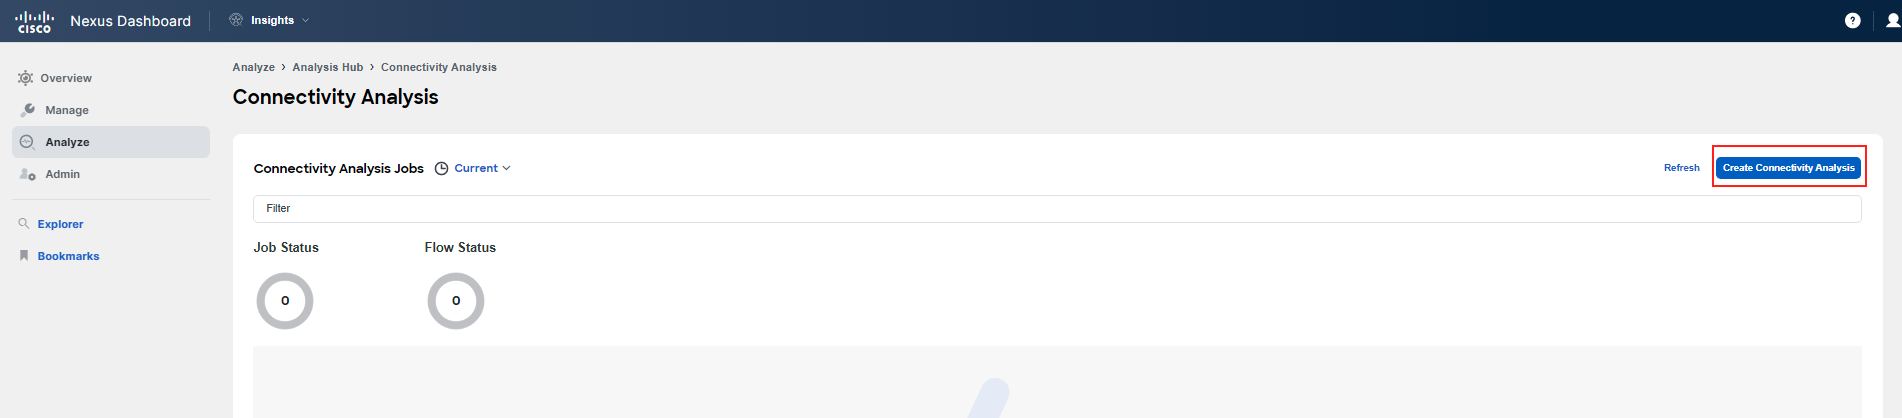
Start by navigating from the global menu to Analyze > Analysis Hub > Connectivity and click on the Create Connectivity Analysis button.
Step 2
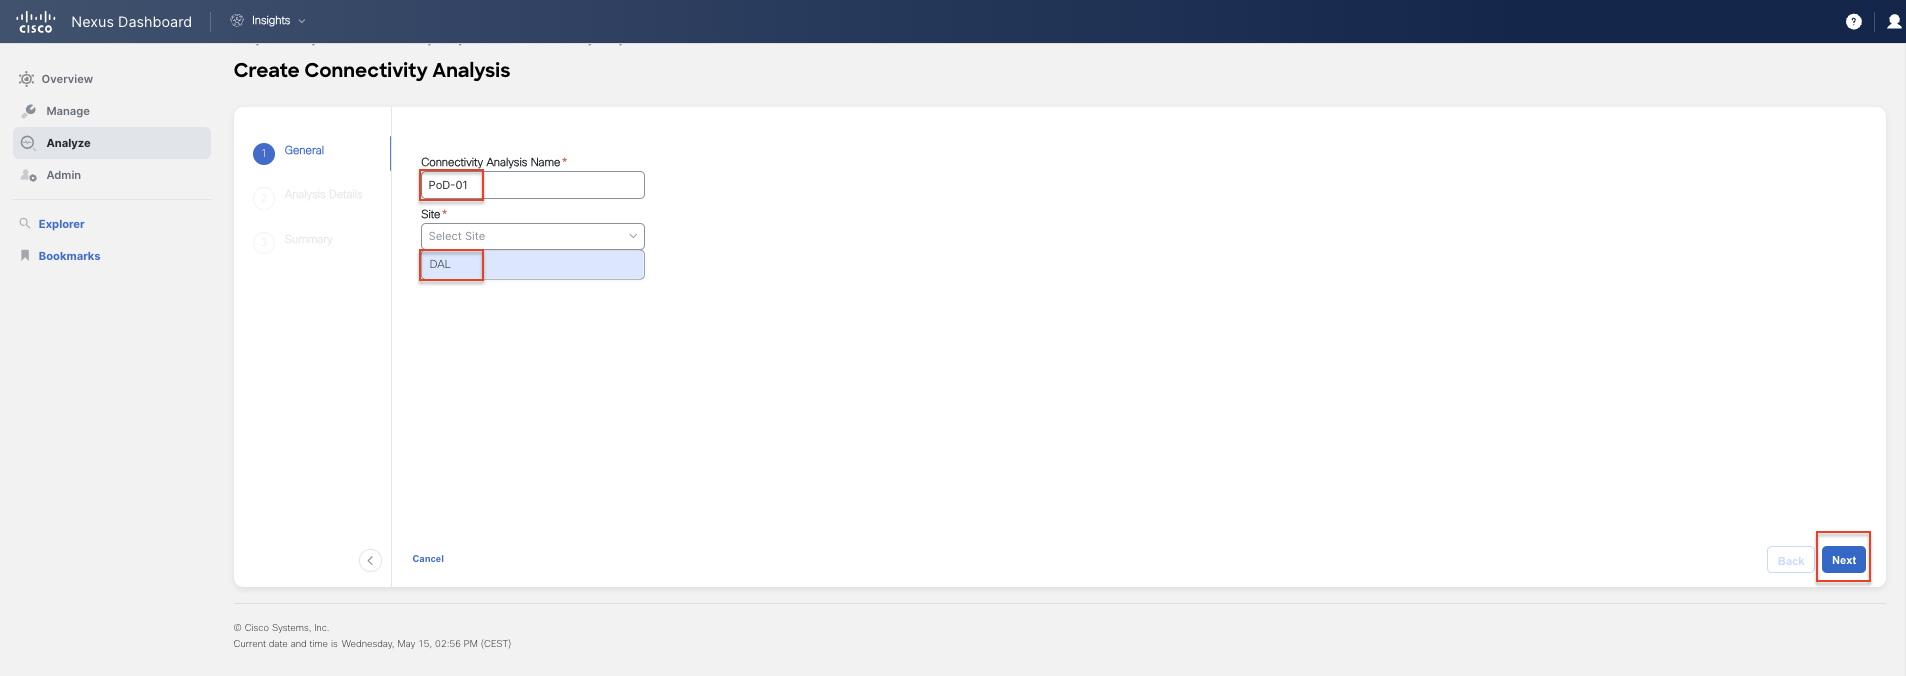
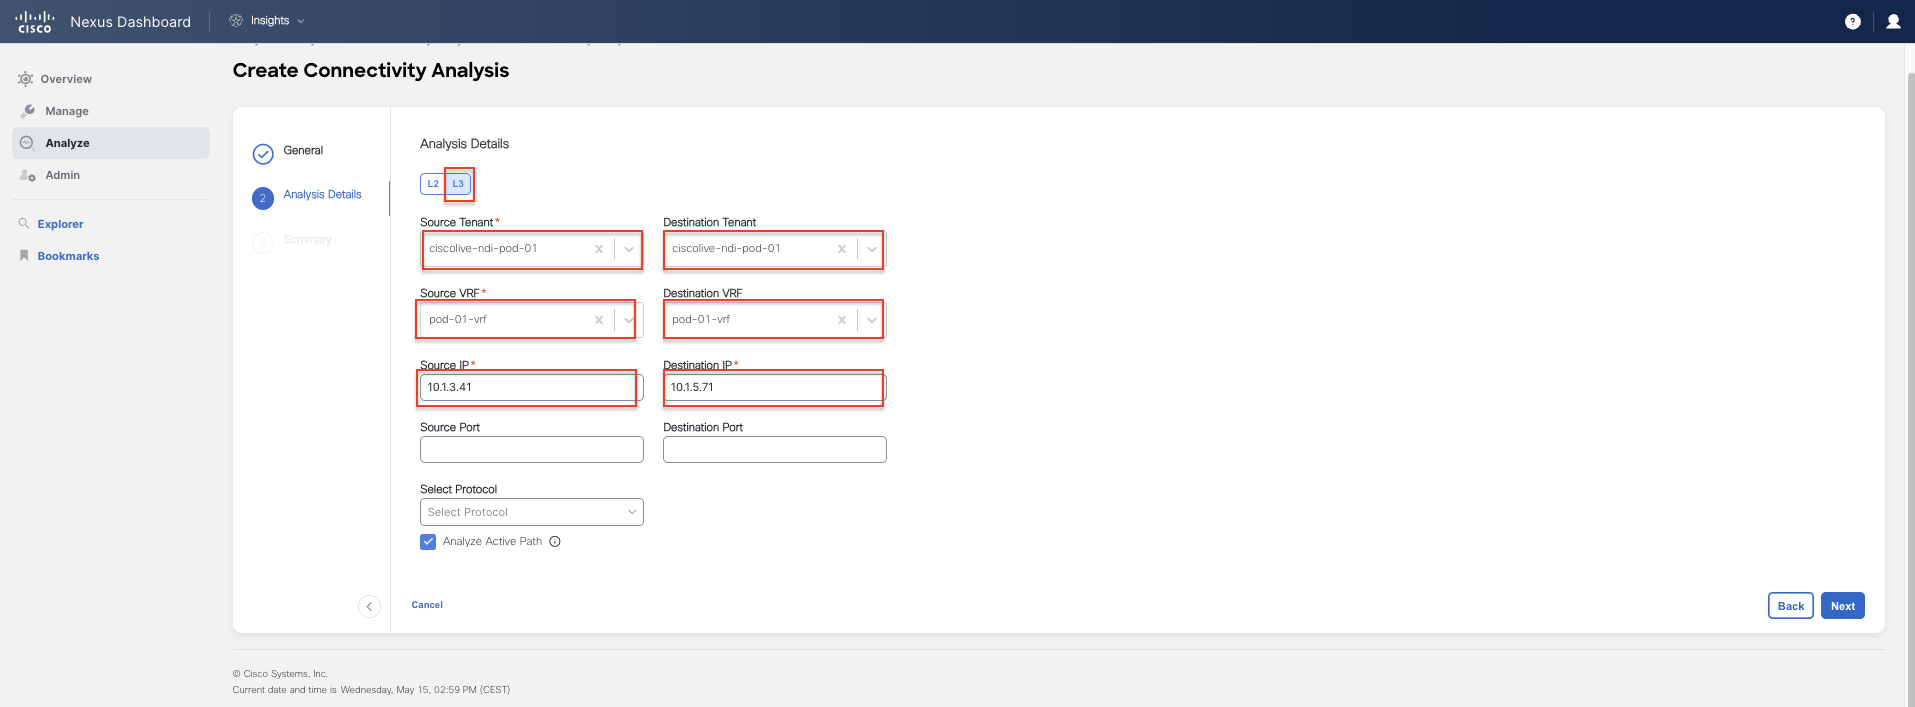
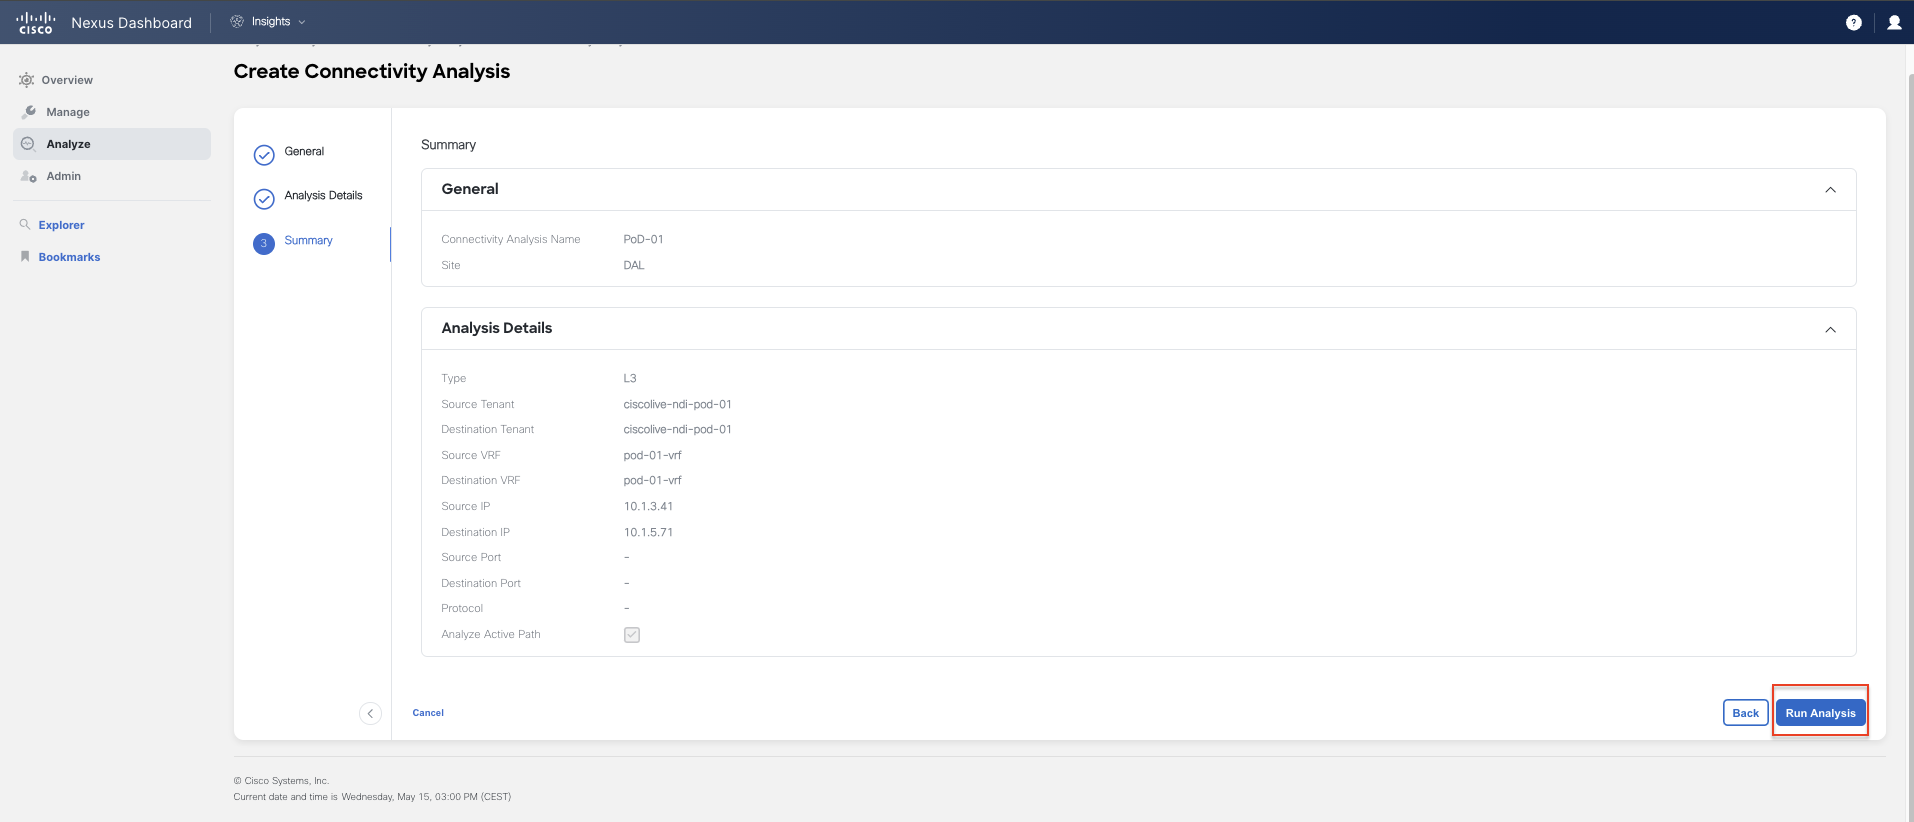
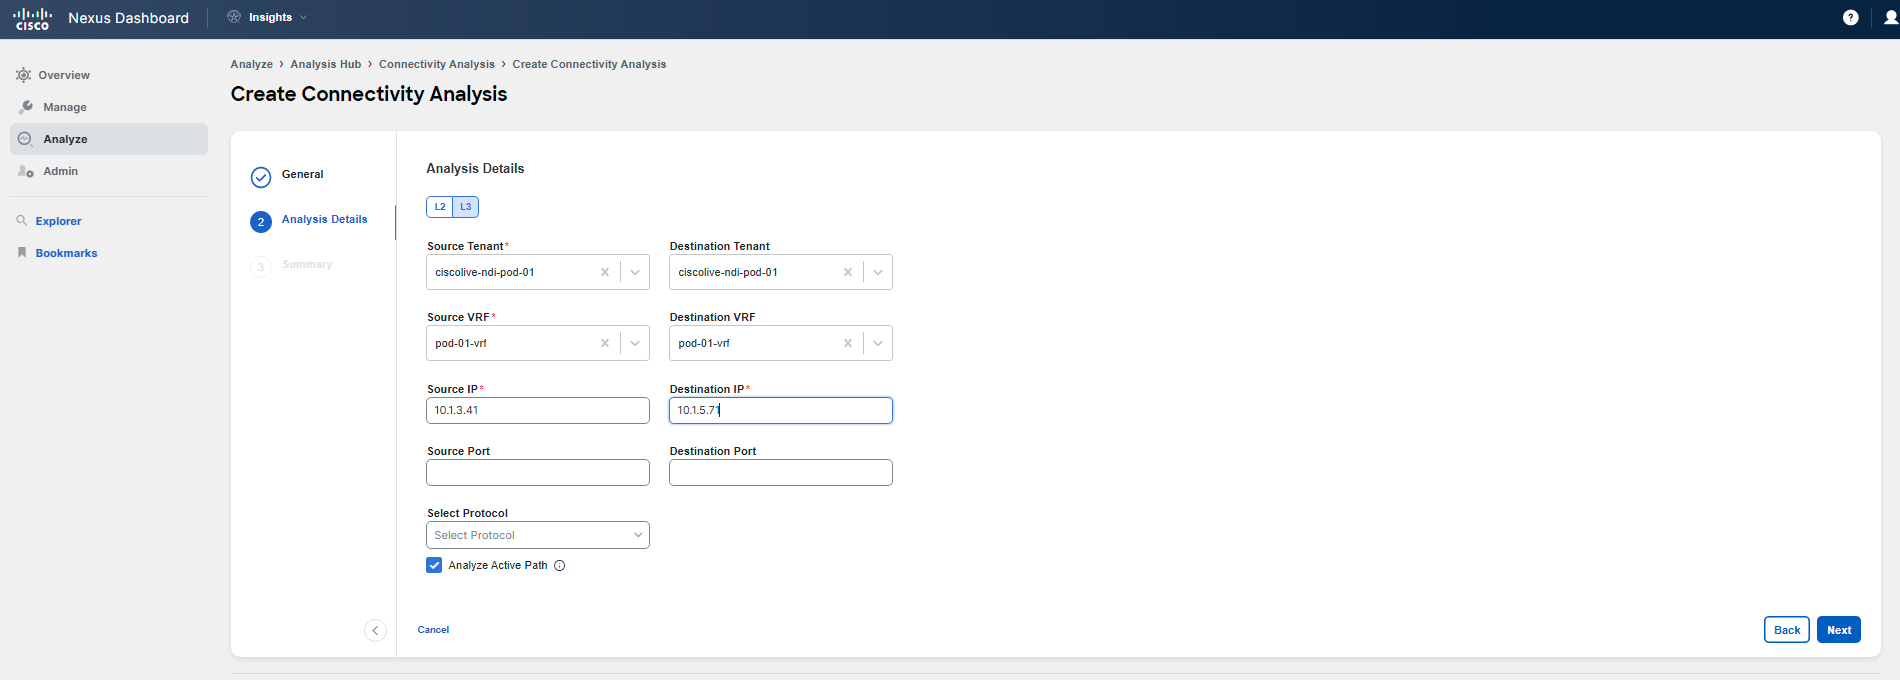
Creating a Connectivity Analysis requires a few steps, which are highlighted in the upcoming screenshots. Please use them for your reference. Give it a proper name that will include your PodID, use your tenant, which belongs to your POD, and specify the source/destination IPs. These are mentioned in the scenario description, as they are the known IPs of the application tiers. The source should be: 10.x.3.41 and the destination should be: 10.x.5.71, where x stands for your PodID.
Step 3
Connectivity Analysis will take a few minutes to run; it should not be more than 2 minutes under normal circumstances. However, depending on the platform load during this lab, it might take longer due to the number of jobs triggered by multiple participants simultaneously. Consult with your proctor if it is taking too long.
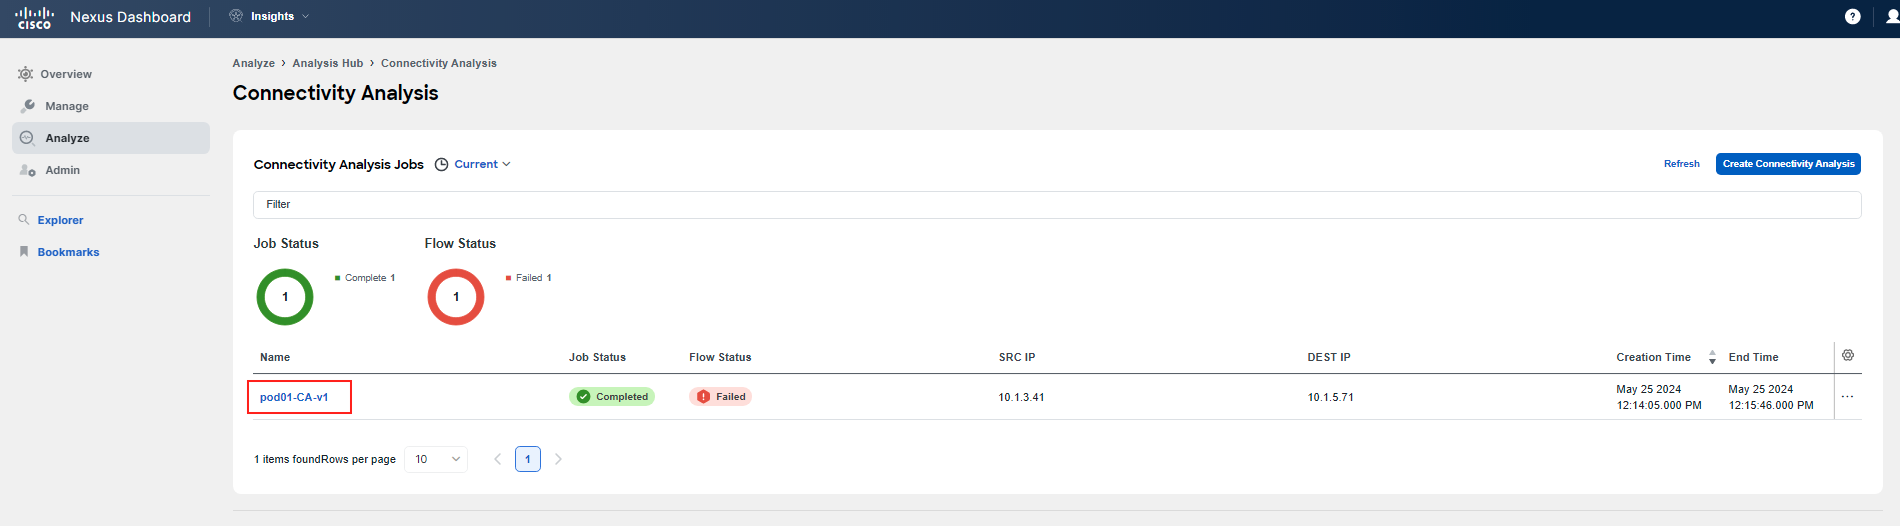
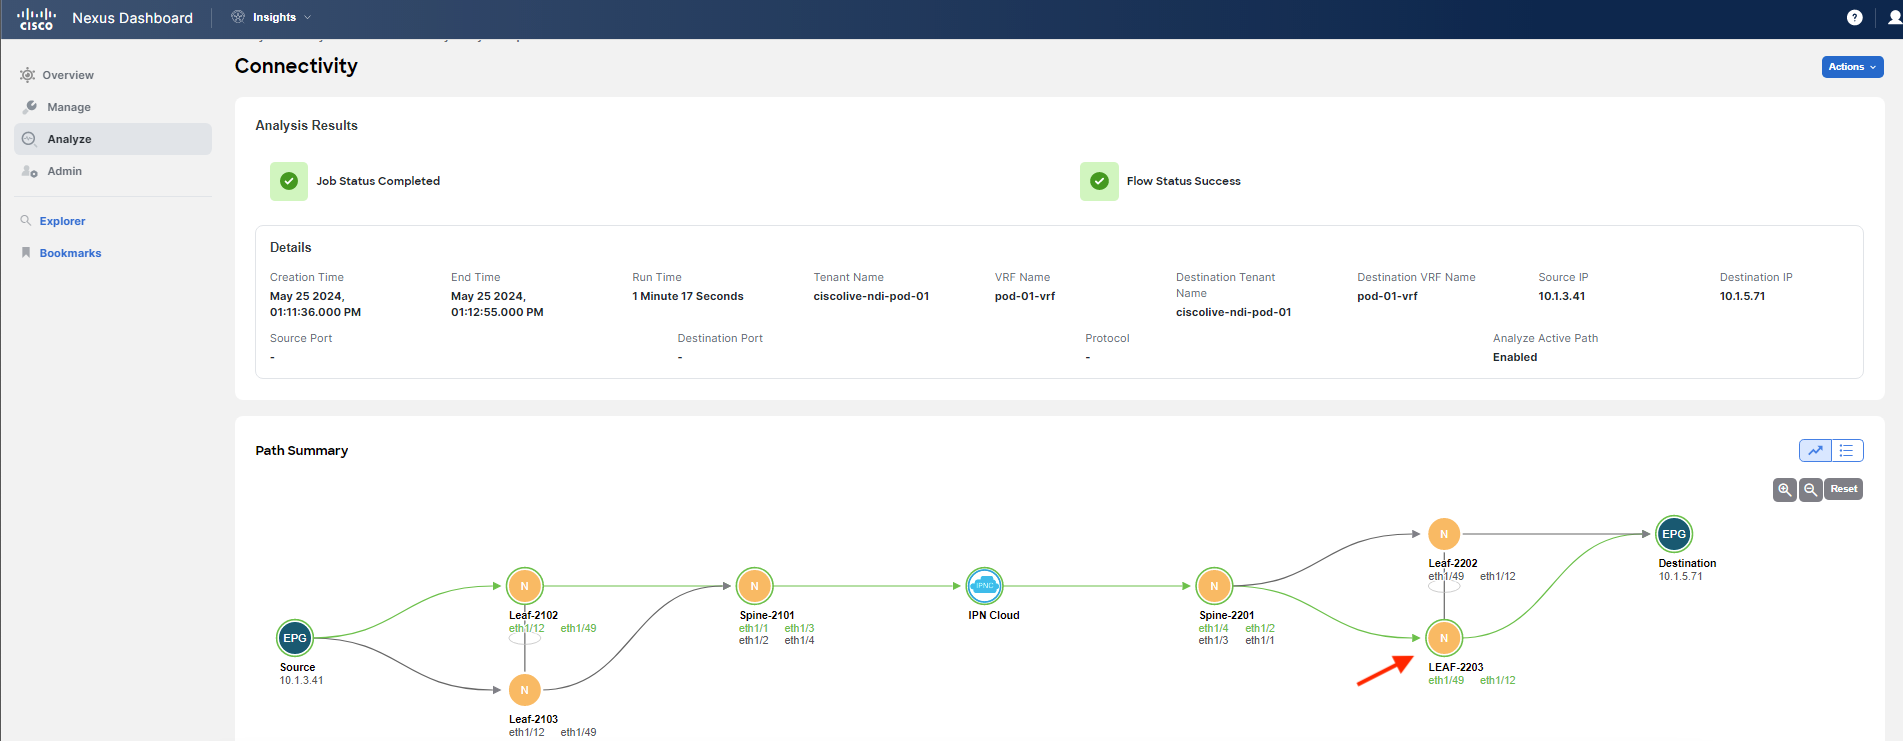
Once the Connectivity Analysis has finished the job, it will fail. That is expected. You should investigate why. Open your analysis by clicking on its name.
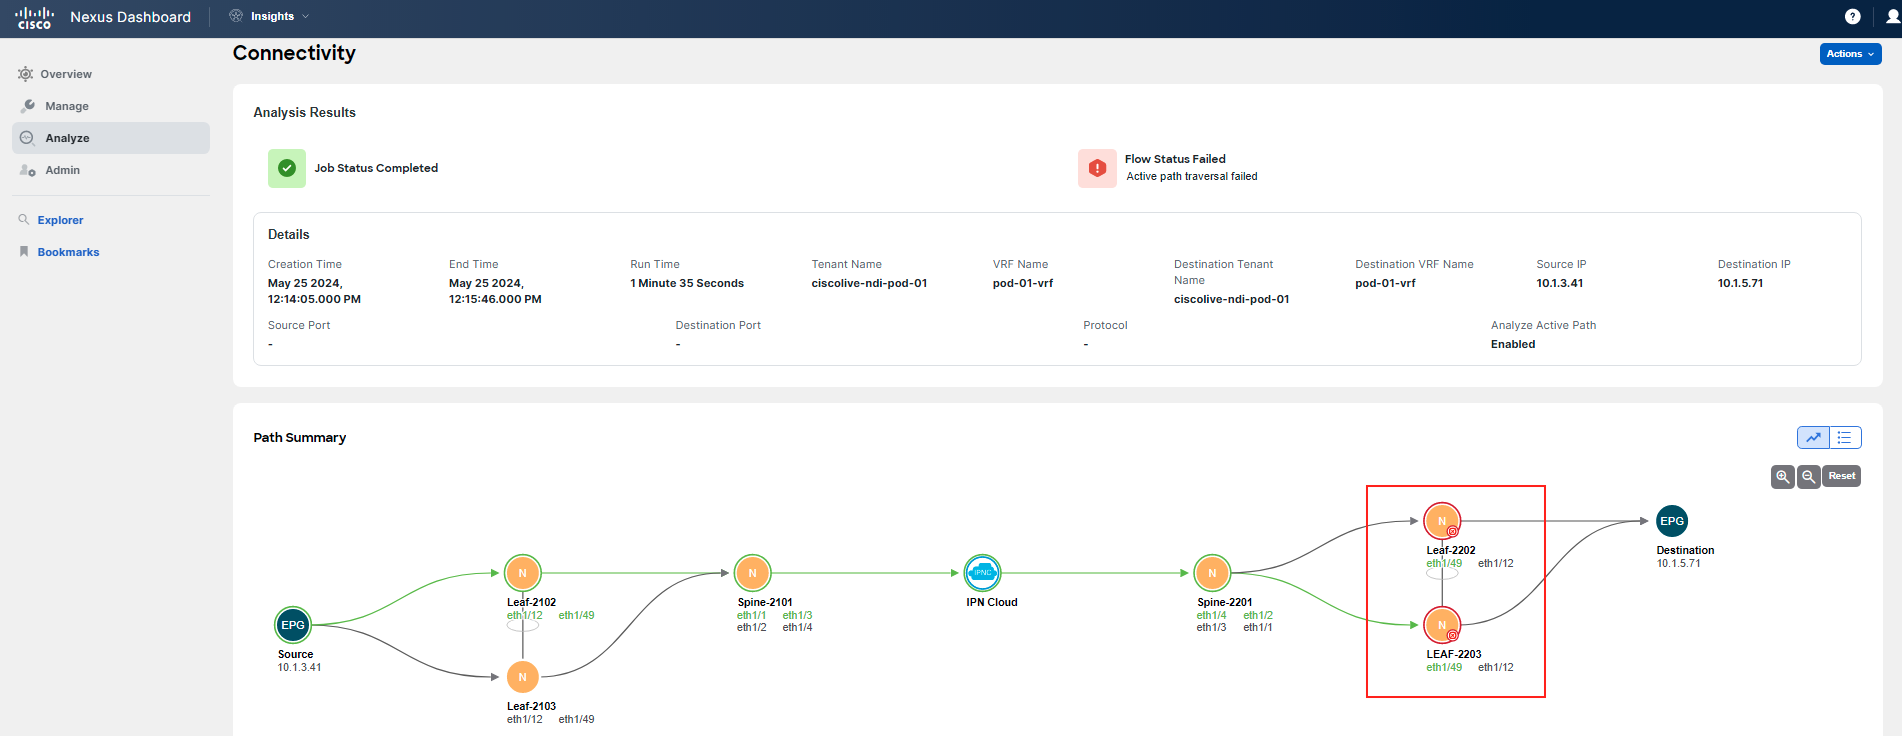
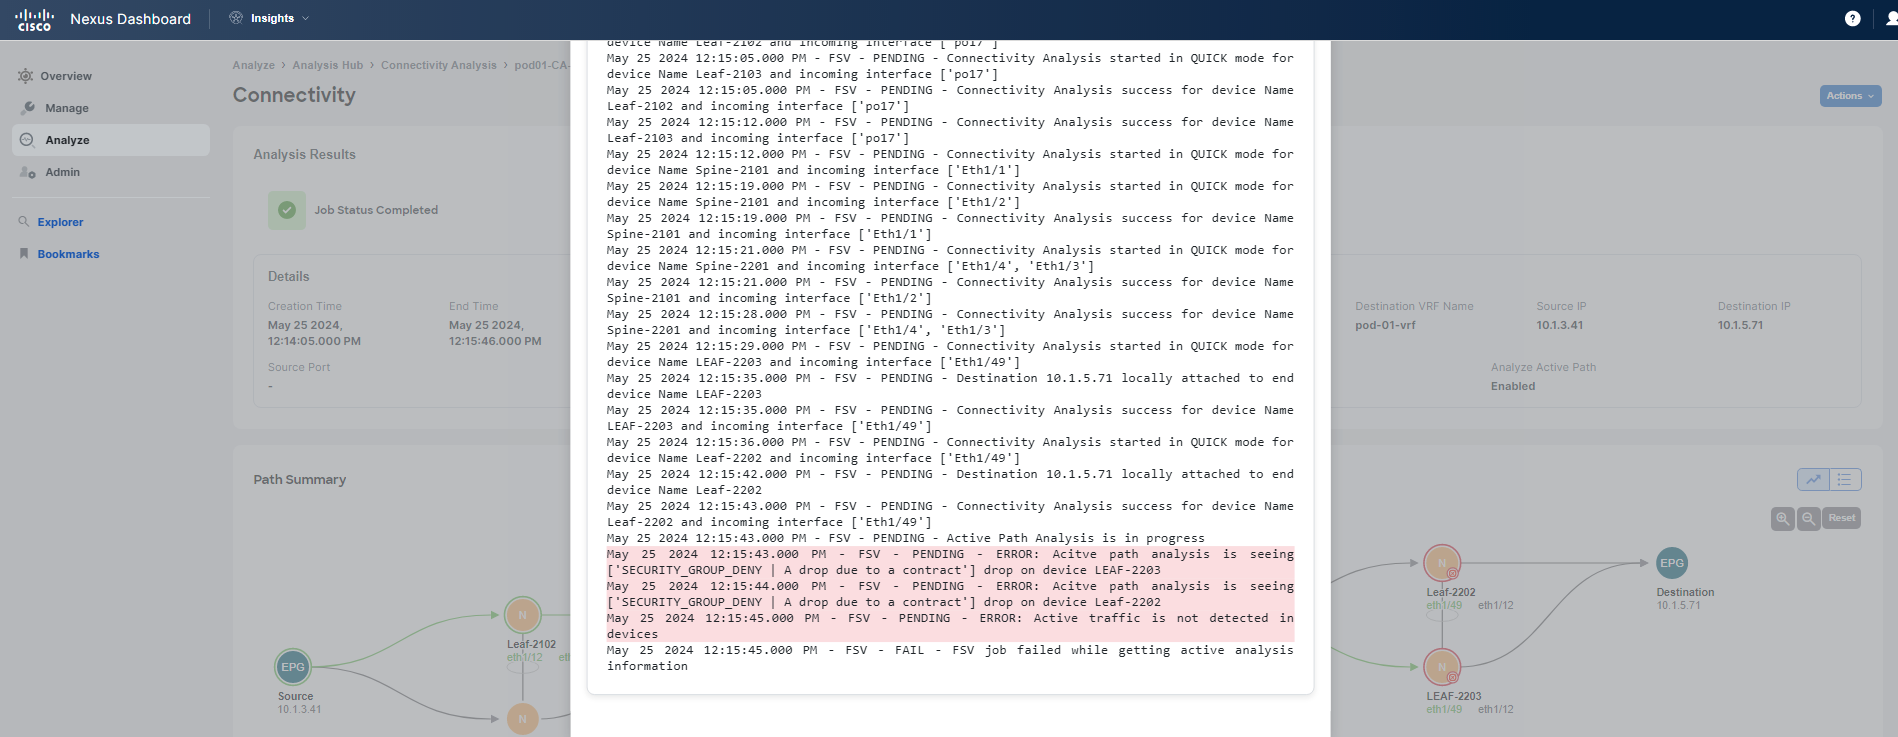
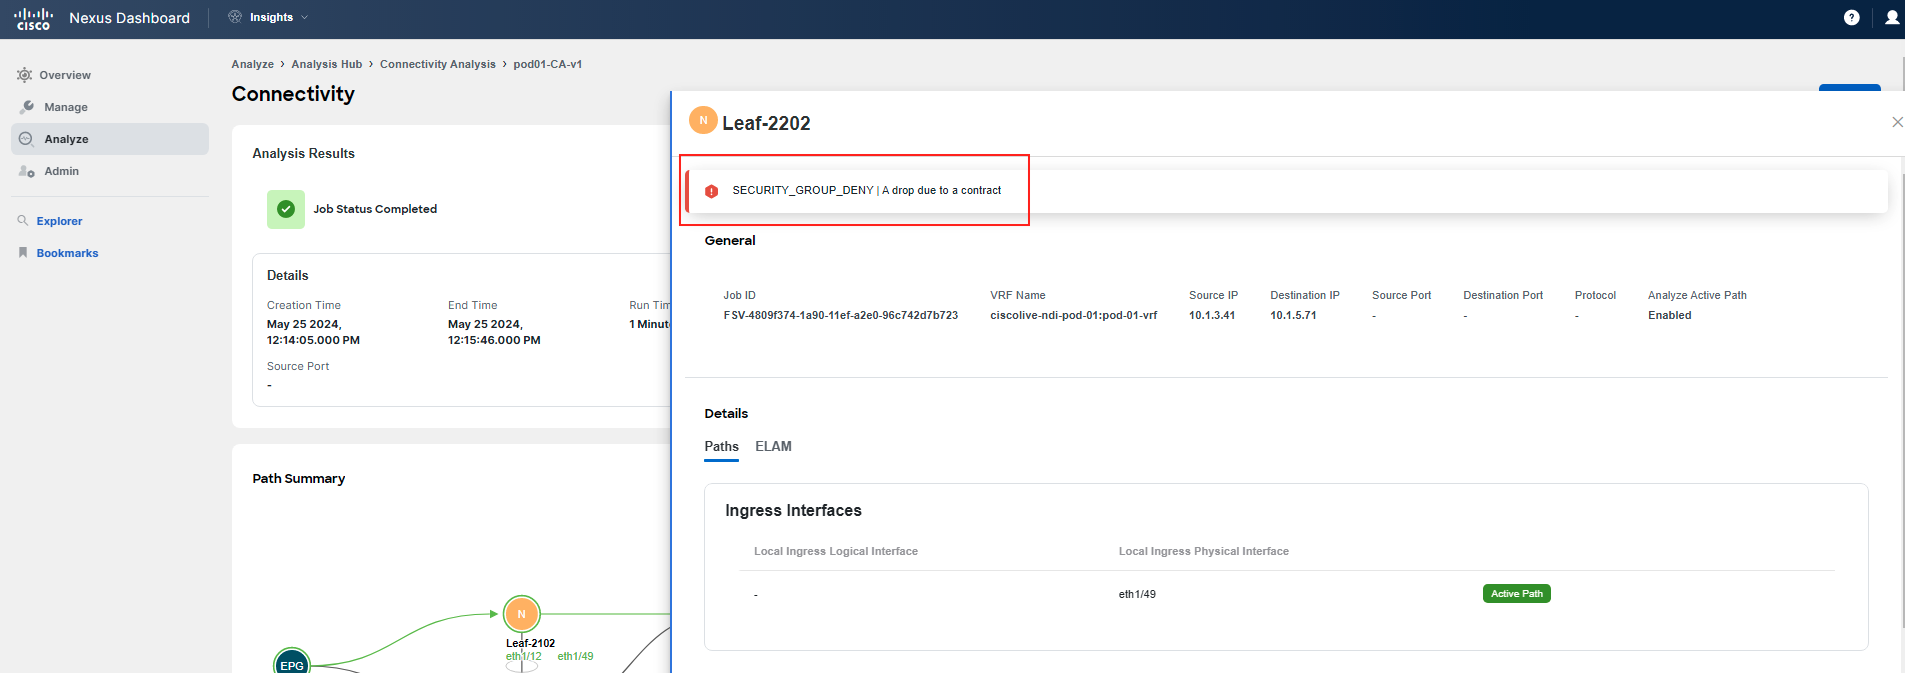
This analysis provides us with all the known information about the traffic between these two endpoints. We can see all available paths, the path that was actually used as primary, and where an issue has been detected. This is a quick yet powerful way to have NDI do all the hard work to gather everything you need to make your troubleshooting easier.
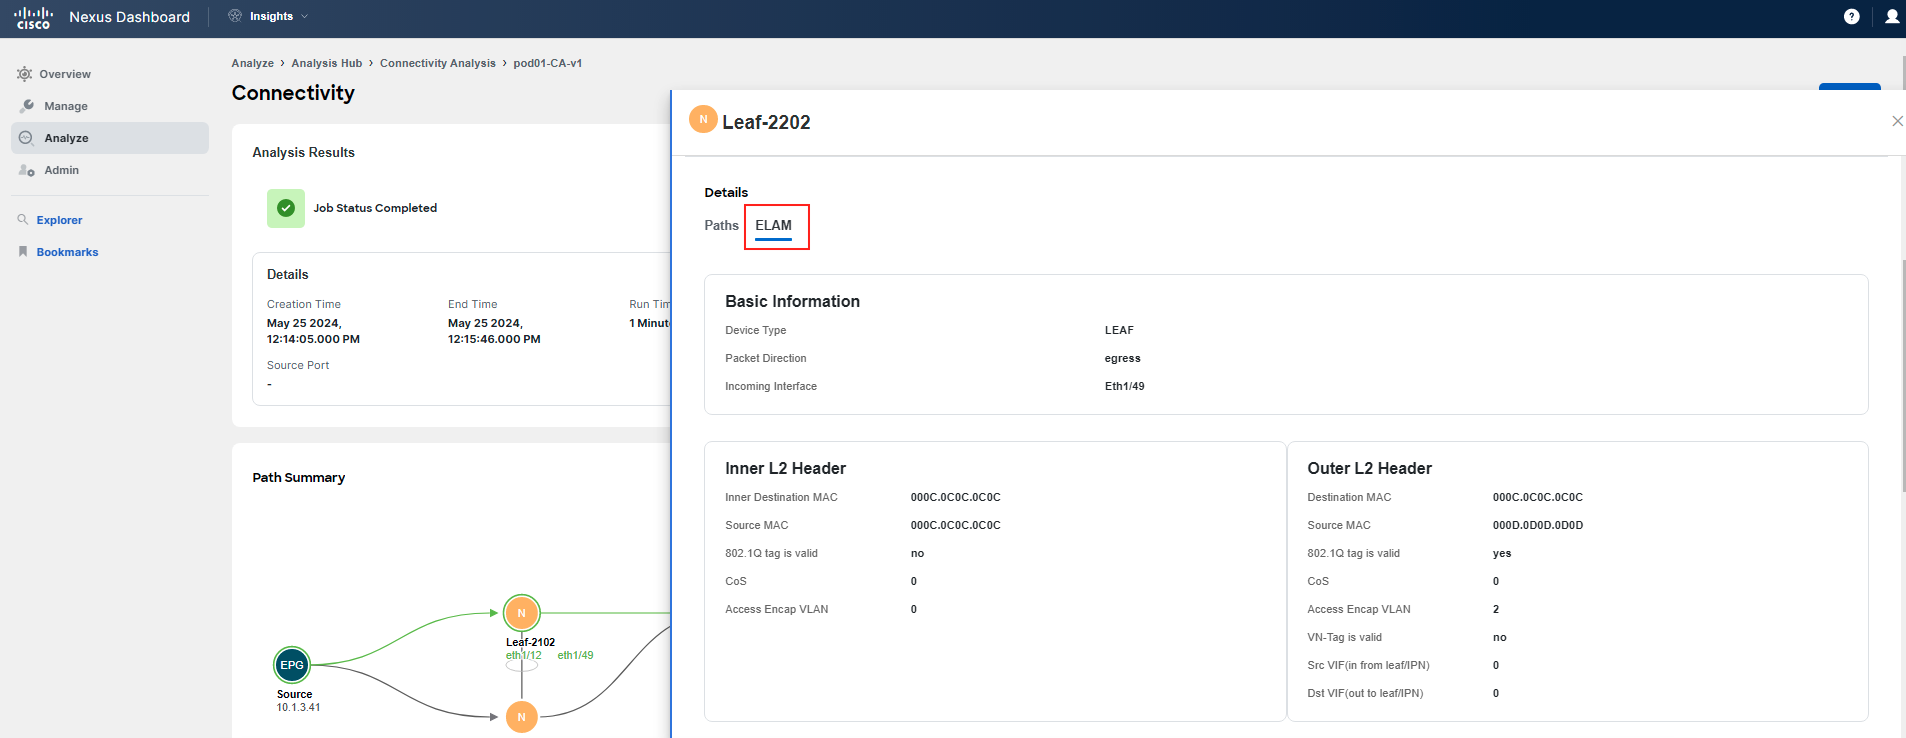
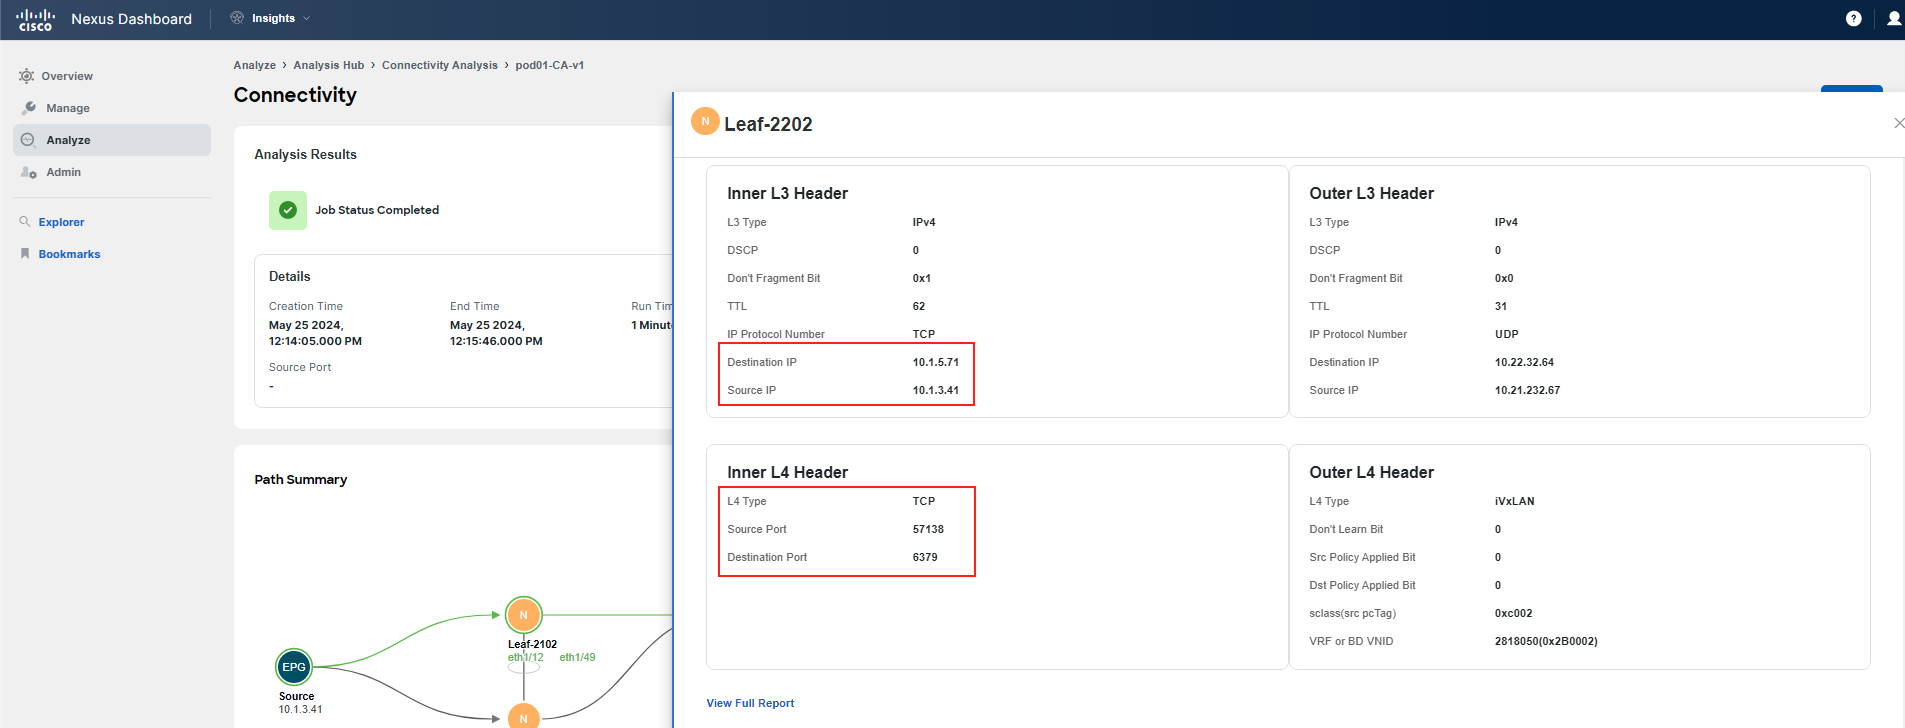
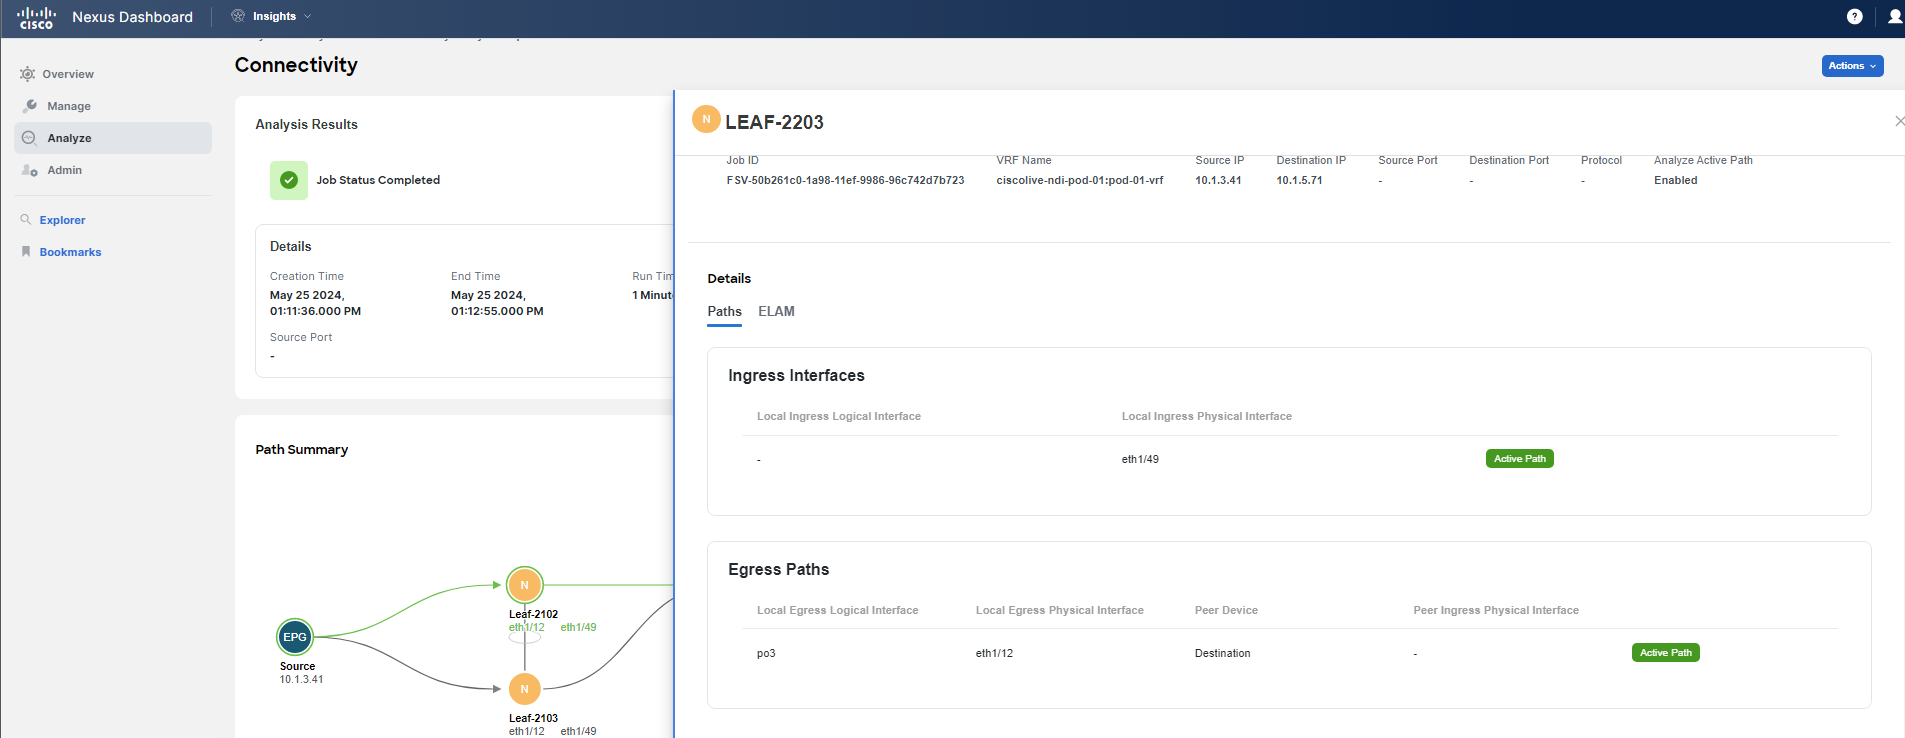
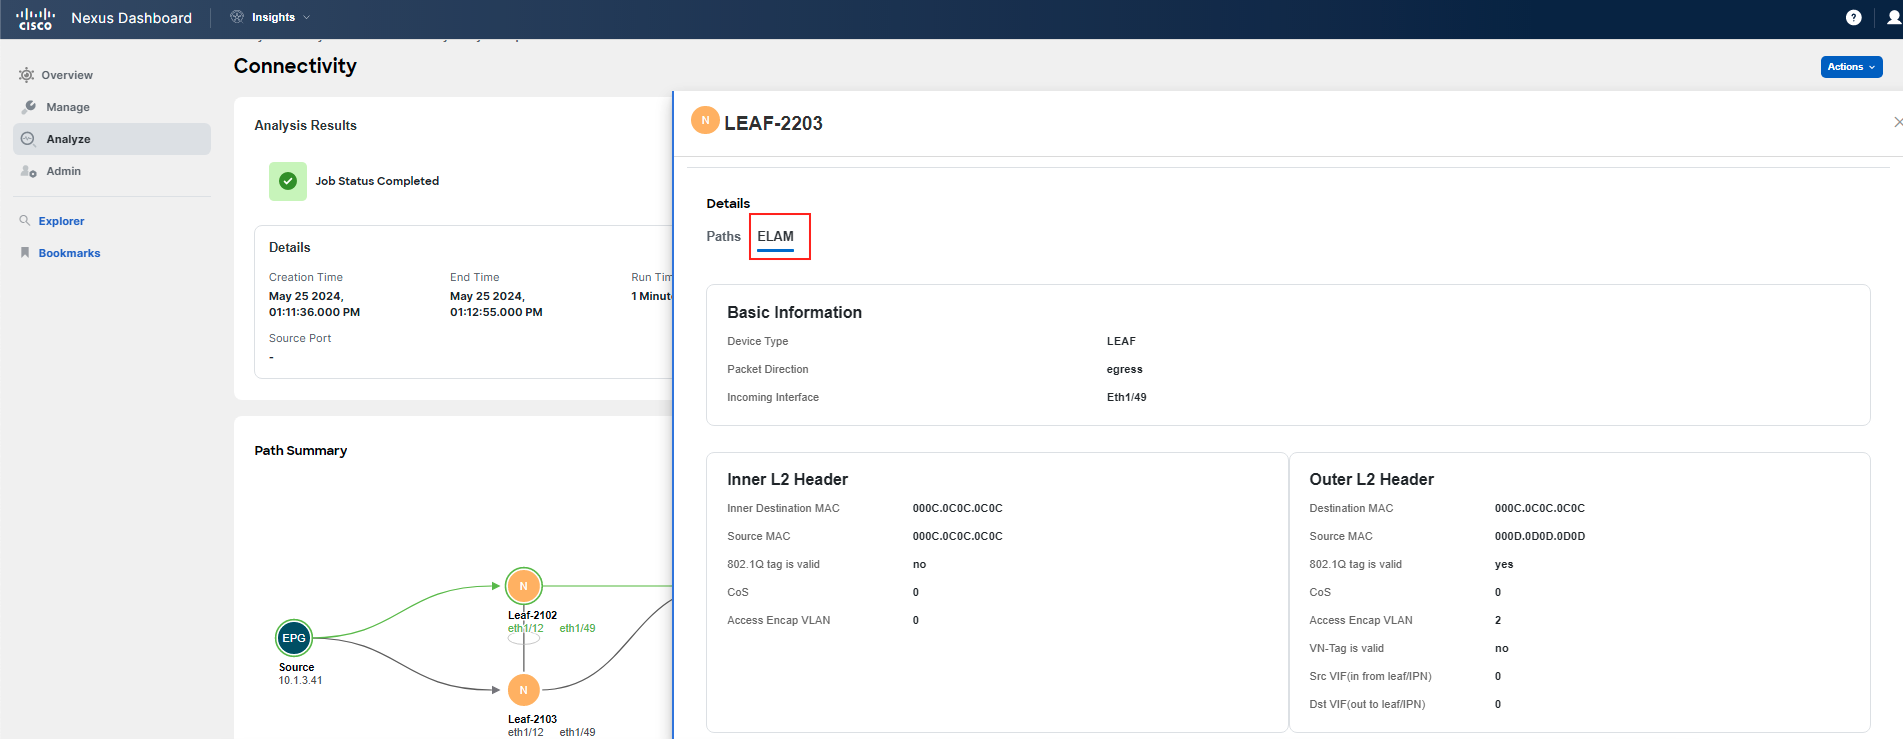
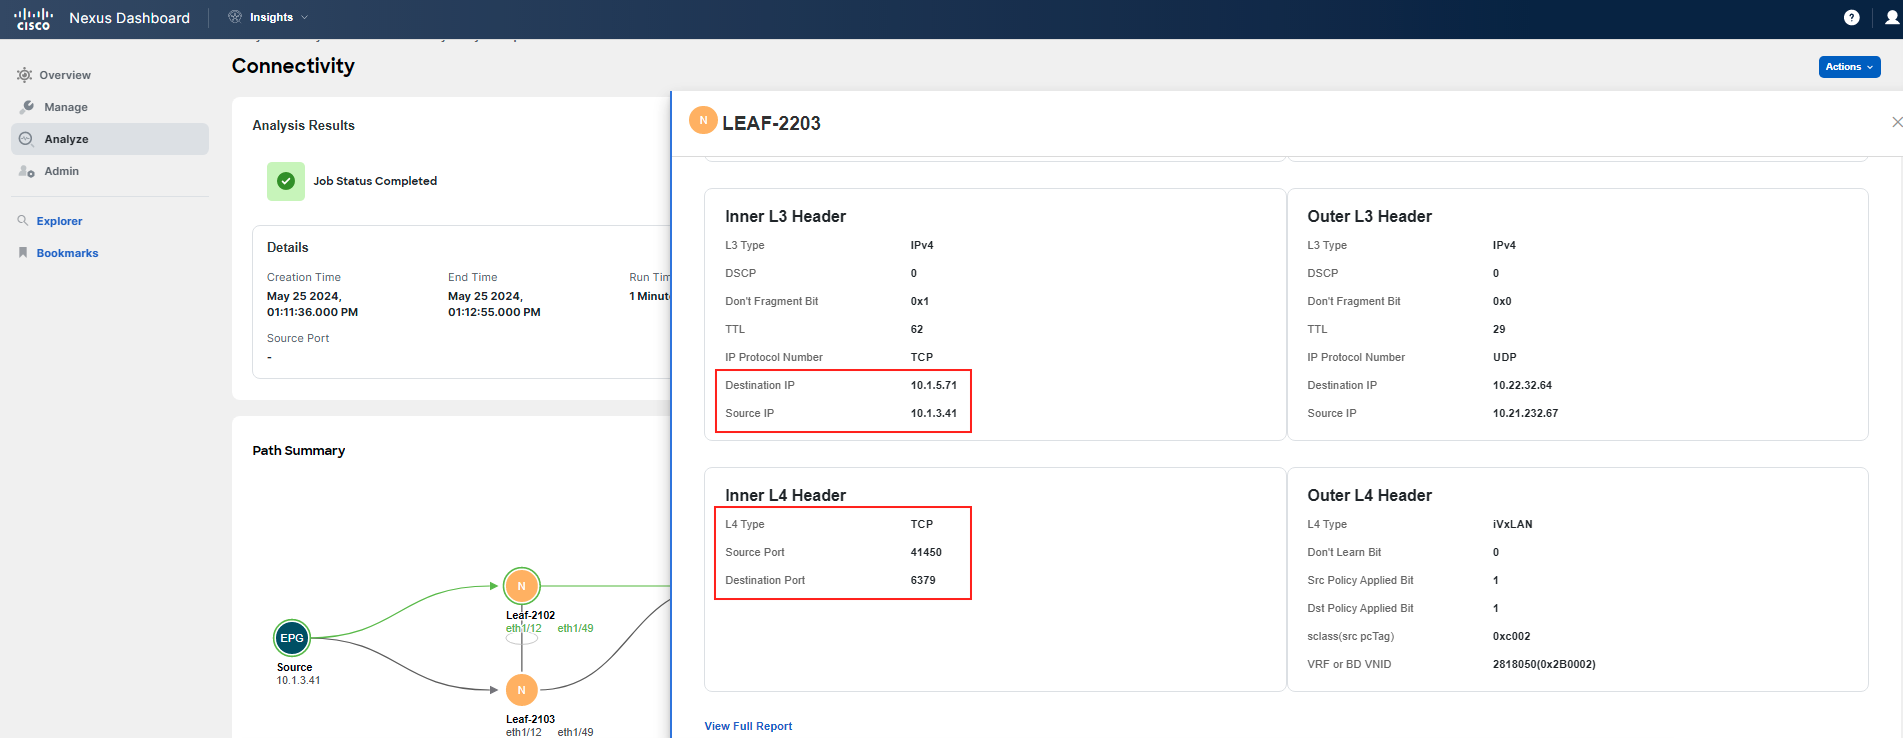
Drill down with ELAM by clicking on the ELAM tab. Investigate the headers information, especially the L4 information. Note down what you discover.
Note
You can also click on the View Full Report button under ELAM to dig really deep and for even deeper troubleshooting, for example, checking Contract Lookup details.
As you have found out, it fails due to a contract issue. Let's continue with the verification checks.
Step 4
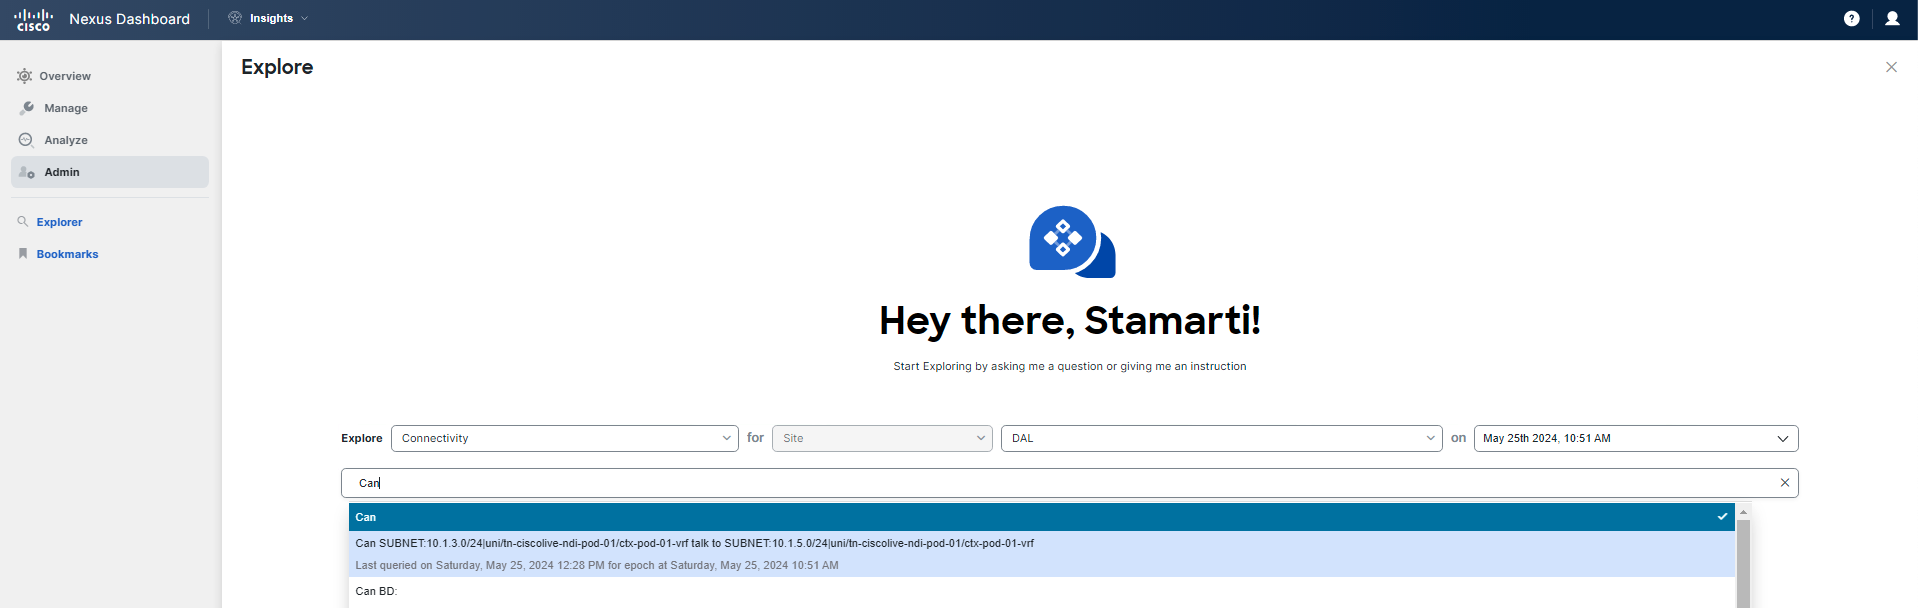
Let's use the Explore feature to get more details related to the application tiers and their communication. Navigate there from the main menu on the left.
Ask Explore if the subnet belonging to EPG cart can communicate with the subnet related to EPG database.
Note
You do not need to type out the entire query. Use the automated text auto-filling feature. You can either filter based on subnets for the app tiers or leverage the EPG names. Make sure you use the correct site DAL and the appropriate pod for the source and destination EPG/subnet.
Example (using pod-1): Can SUBNET:10.1.3.0/24|uni/tn-ciscolive-ndi-pod-01/ctx-pod-01-vrf talk to SUBNET:10.1.5.0/24|uni/tn-ciscolive-ndi-pod-01/ctx-pod-01-vrf
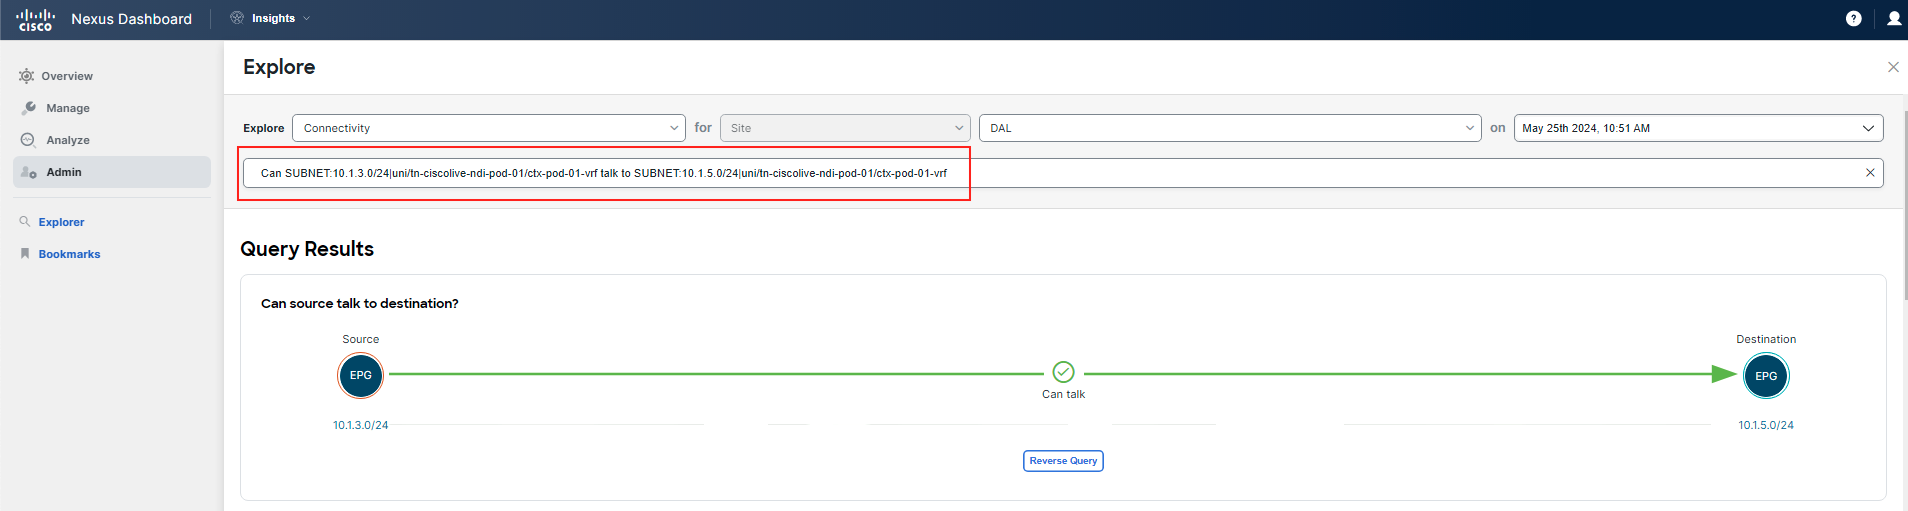
Step 5
First, review the query output. It is green and indicates that the application tiers can communicate with each other, which means that a policy is in place and a contract has been applied. Then, scroll down a bit, and you will see three tabs. Focus specifically on the Policy tab. It appears that the contract is in place, so in theory, everything should work.
Take note of the information from the policy tab, including the contract and communication properties such as protocol and port. Then, compare what you have noted with the findings from the ELAM investigation during the Connectivity Analysis.
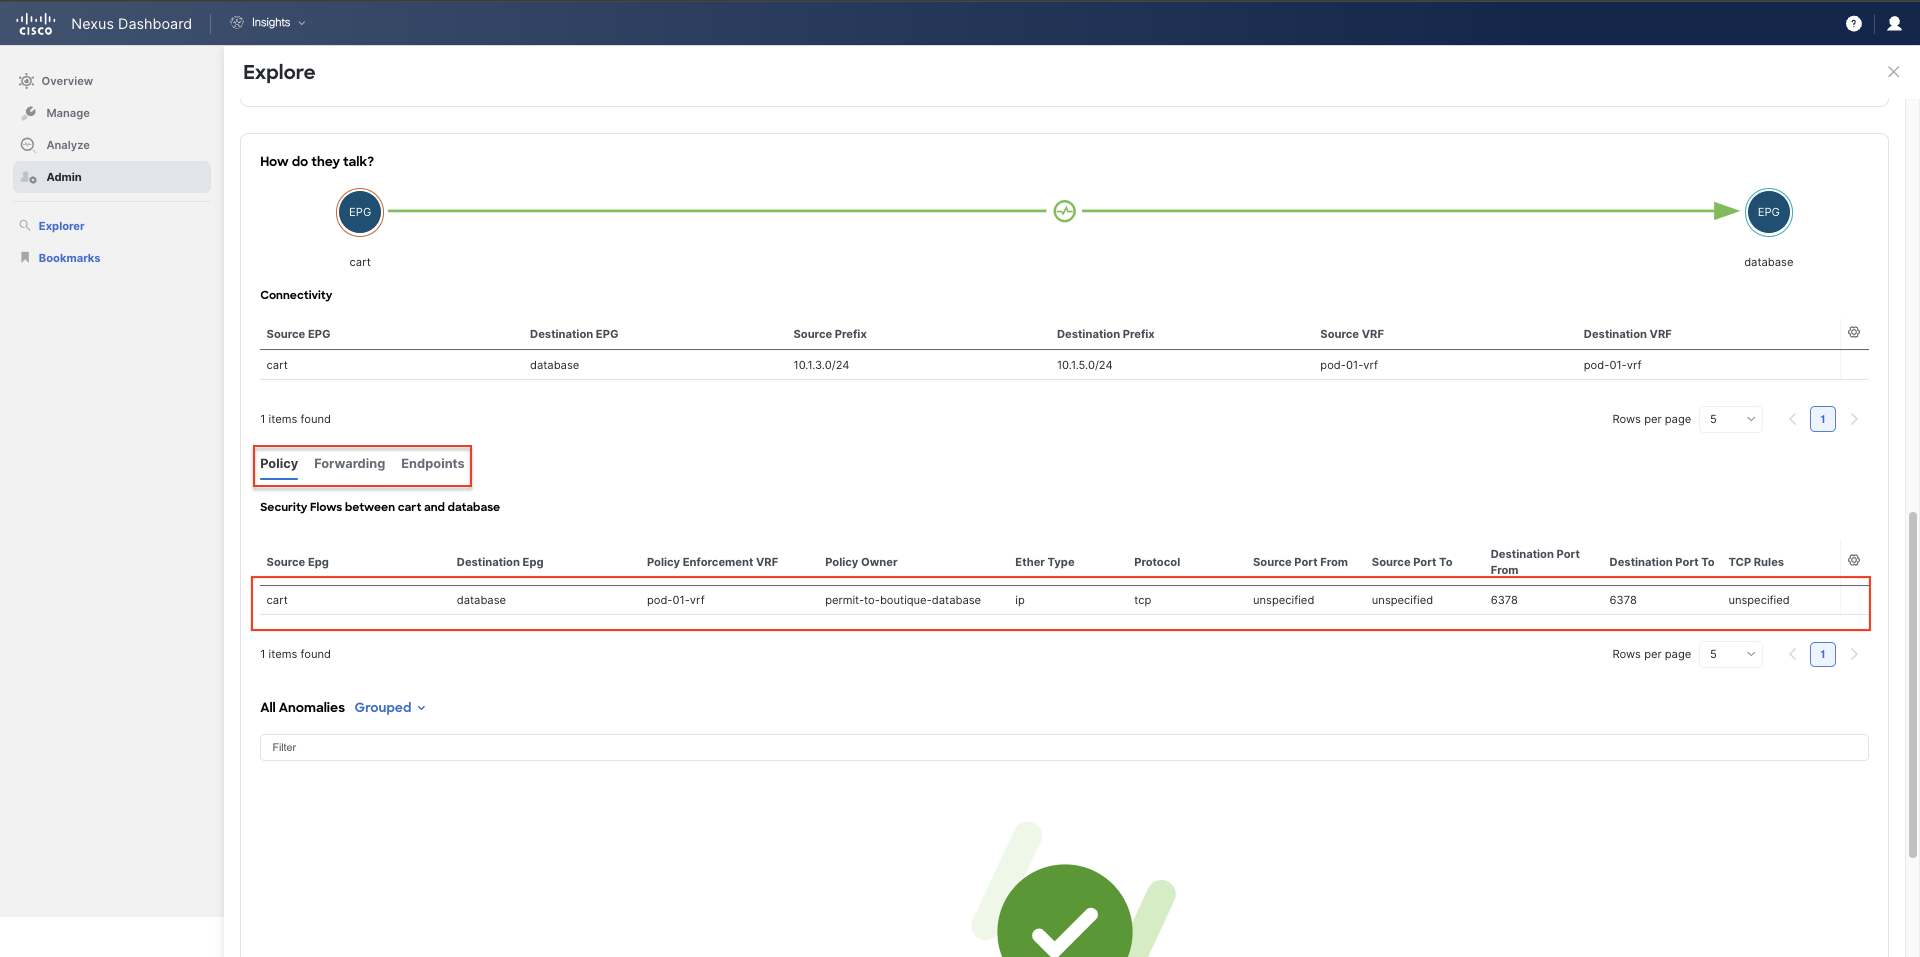
Your comparison should reveal that the port numbers do not match - the actual traffic flow details reviewed with Connectivity Analysis (you discovered the destination port in the actual flow is 6379) versus the deployed policy reviewed with Explore (the configured destination port is 6378).
You have discovered the root cause of the problem. You will address the issue in the upcoming steps.
Fixing the Issue
Step 6
Now, let's examine what you have in your ACI tenant. Connect to ACI and go to your tenant. Check the EPGs in question.
Navigate as follows: Tenant ciscolive-ndi-pod-x > AP boutique-app > EPG cart > Policy > Topology.
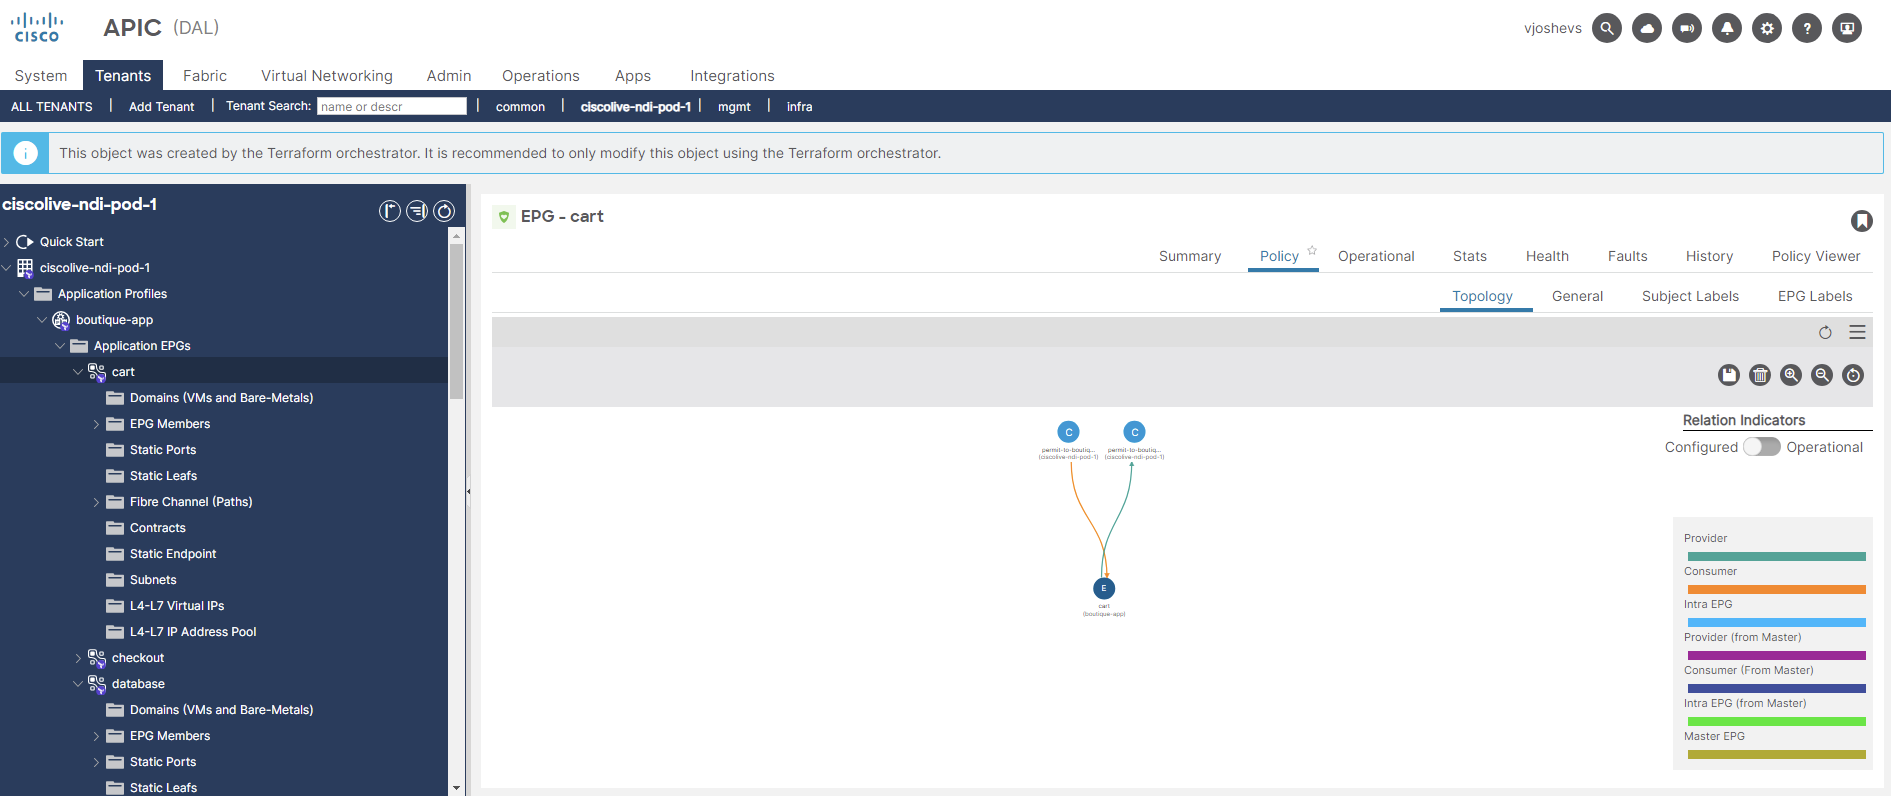
Under one of the contracts, you will also see the name of the filter and associated port which verifies what Explore showed you.
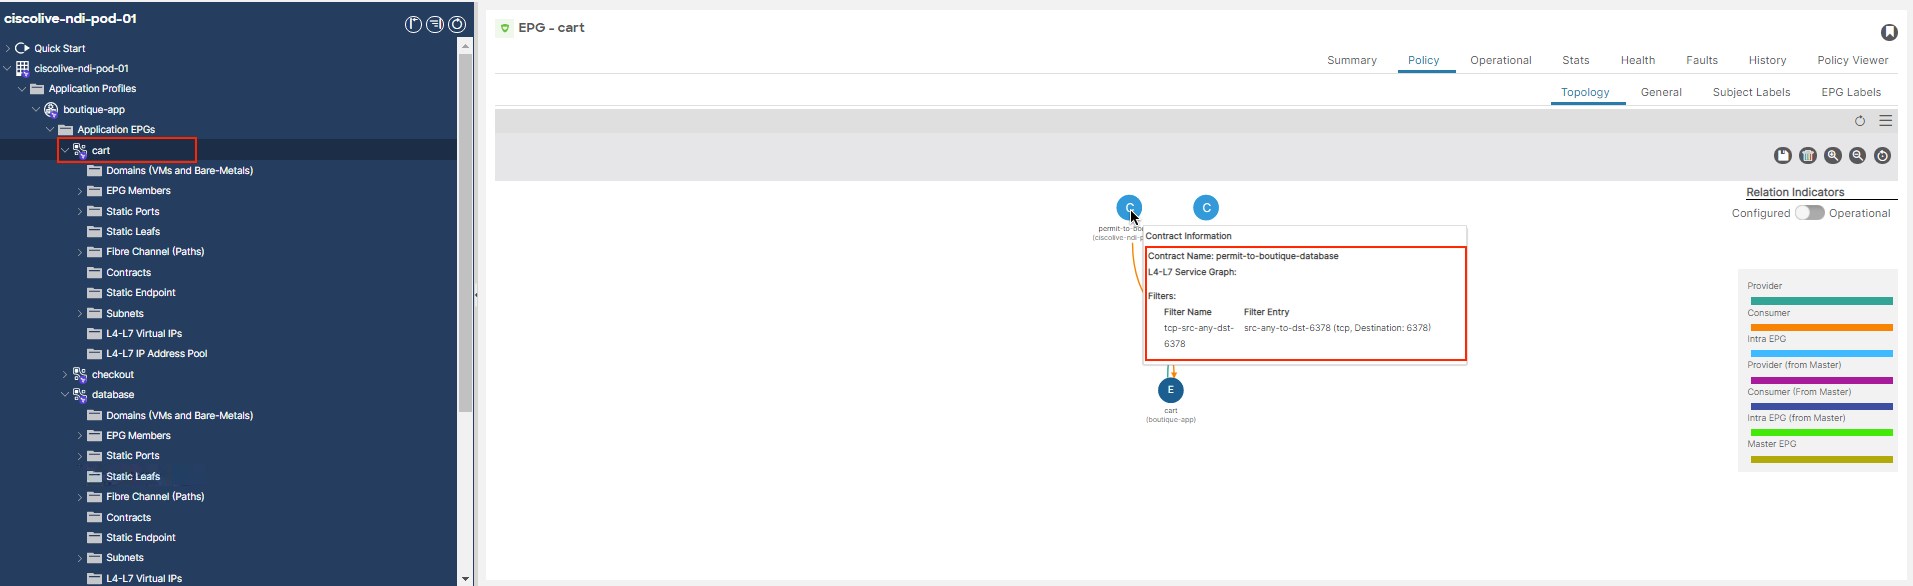
It looks like that during the database migration, it was forgotten to update the related contract to allow communication on the new port.
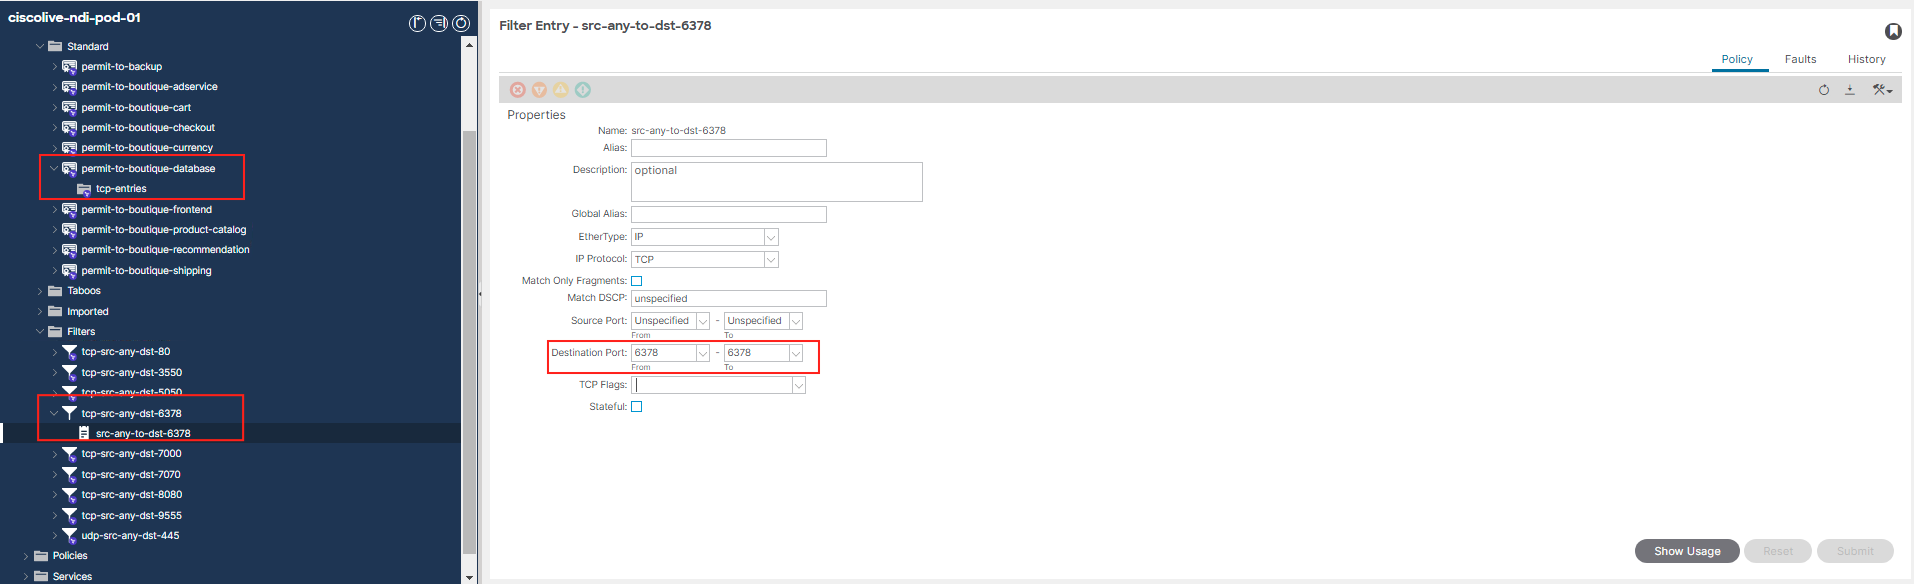
Step 7
You need to update the filter to reflect new and used port. Port should be 6379. Locate the contract filter in the filter menu and change the port to 6379.
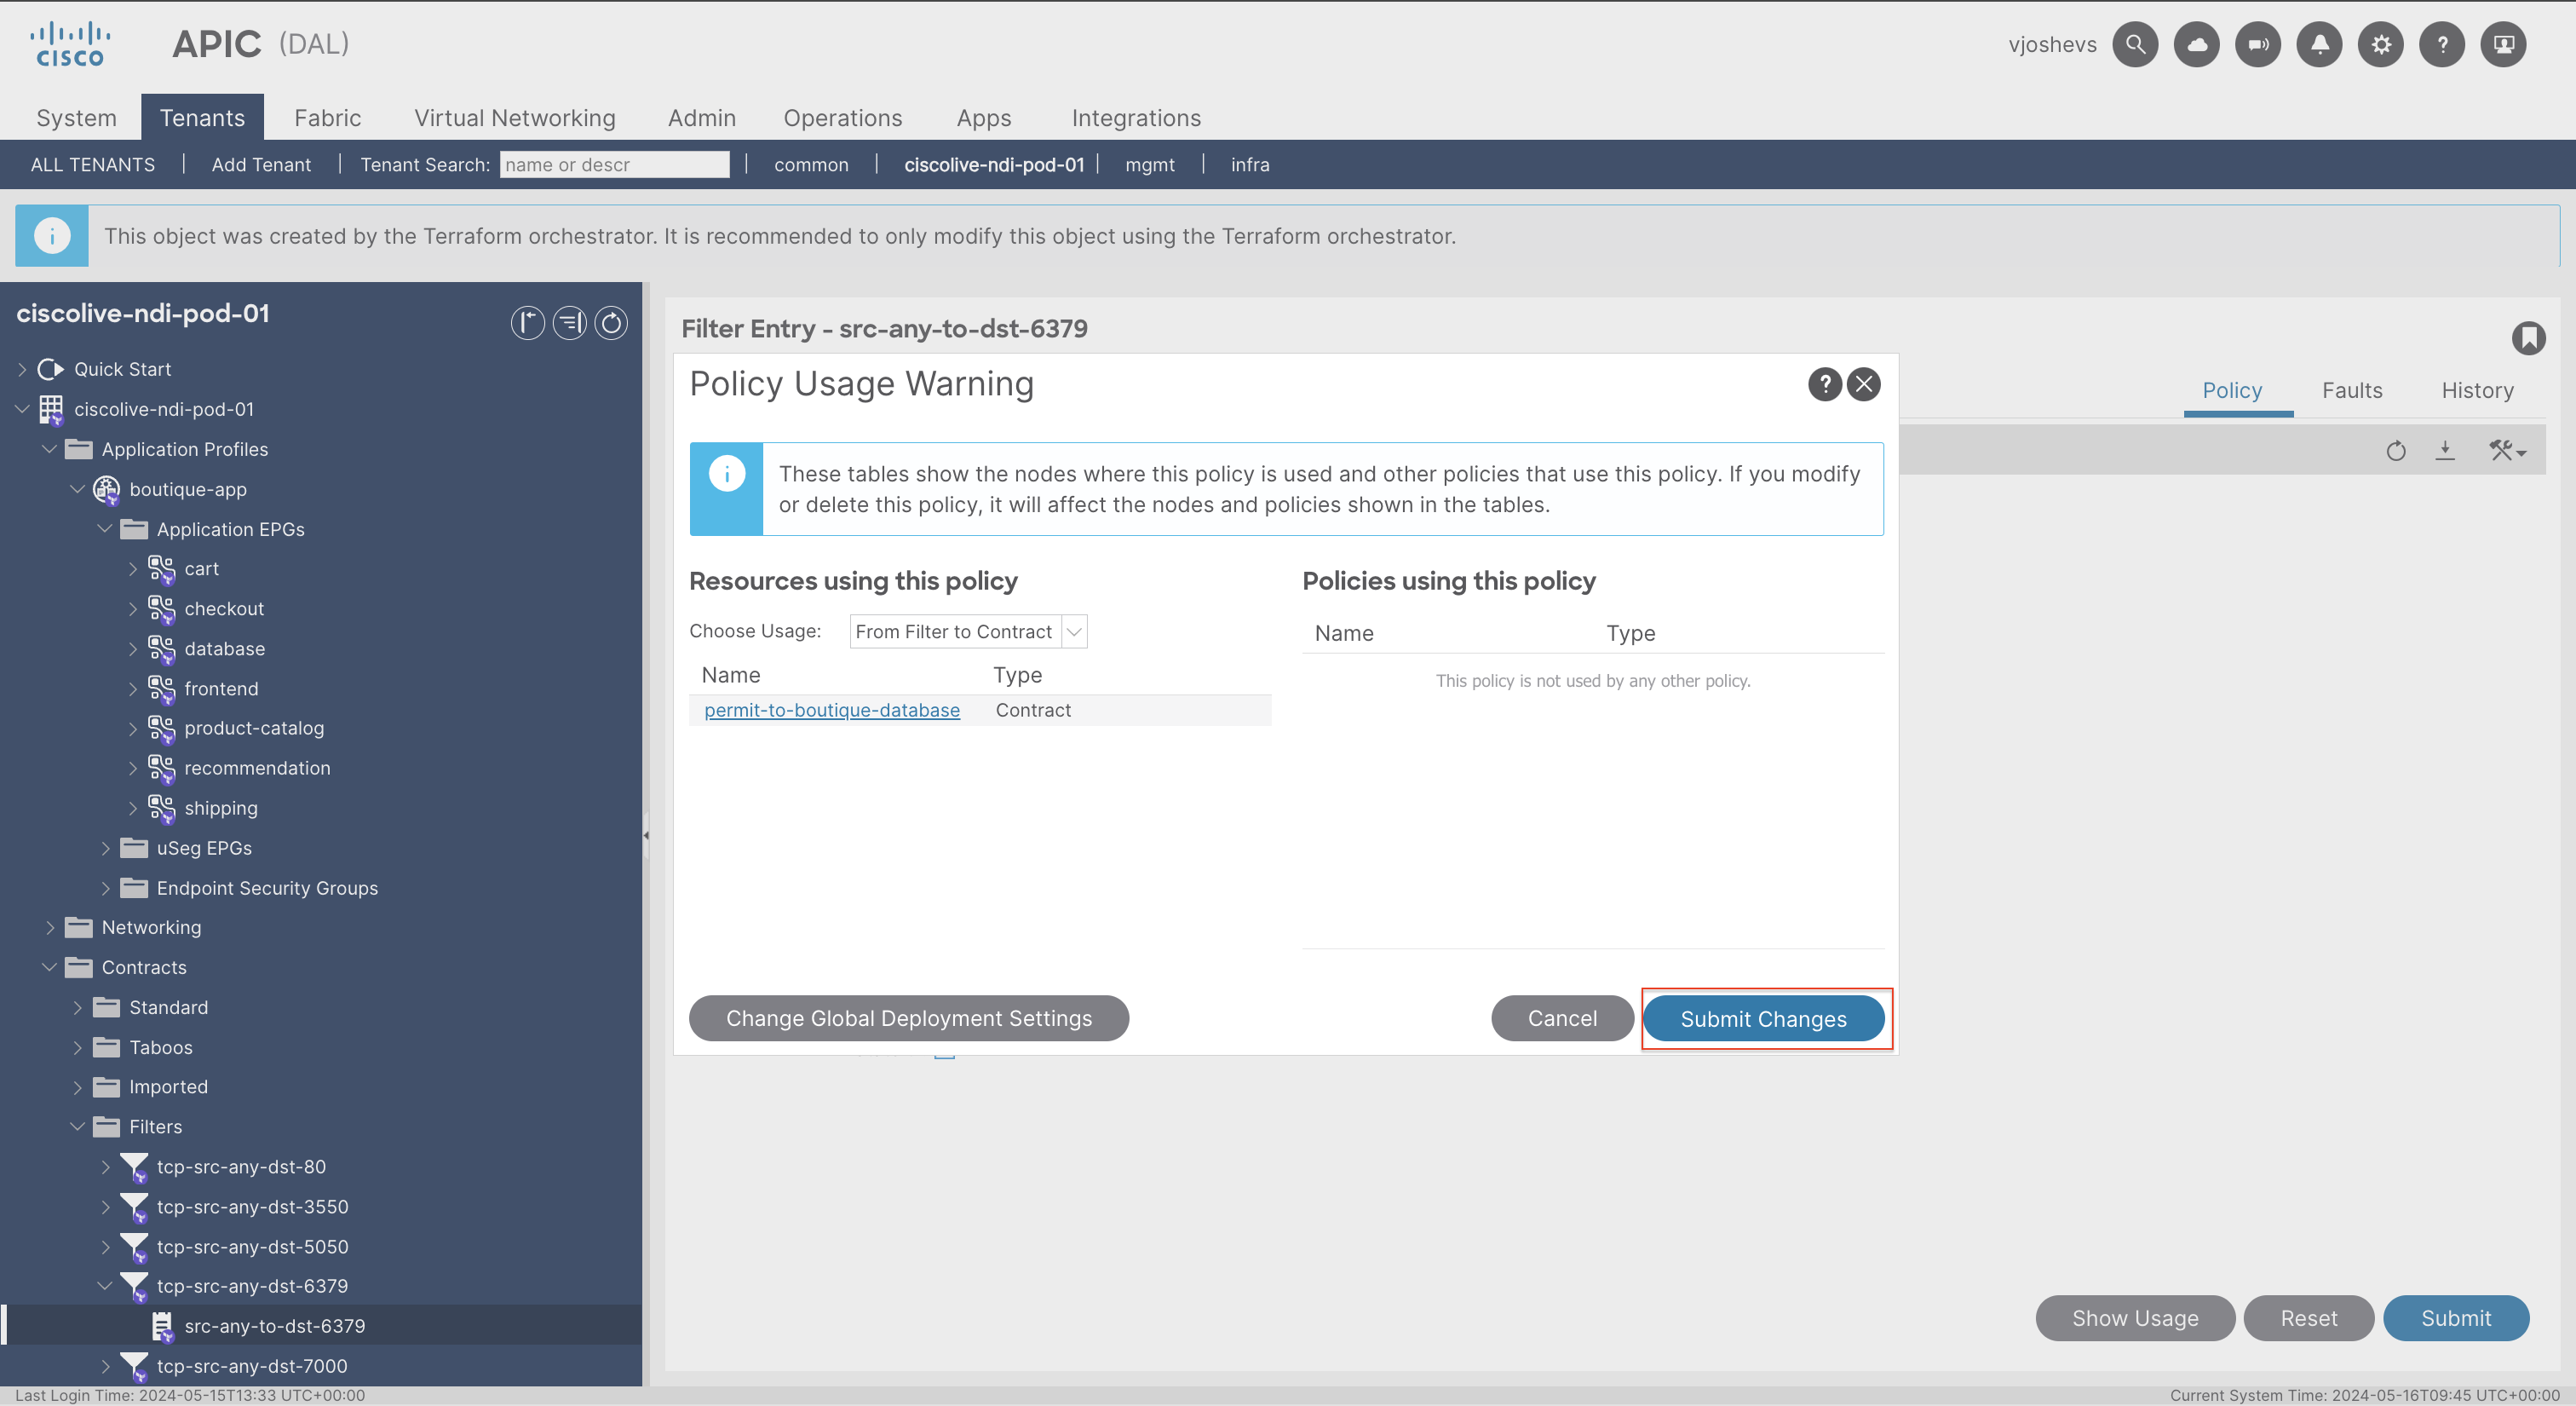
Note
As it is not possible to rename a filter and filter entry, in a normal case, you would have to delete the filter and recreate it. For simplicity, in this case, you only change the port number. This is also a good example to consider naming conventions.
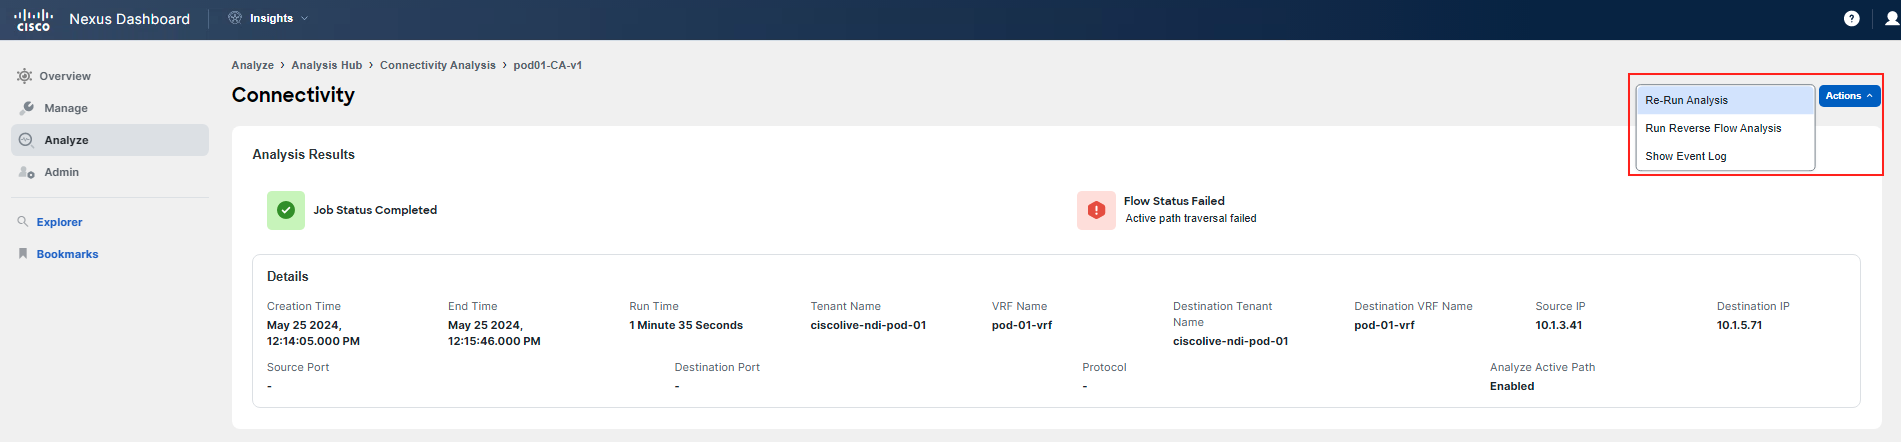
Step 8
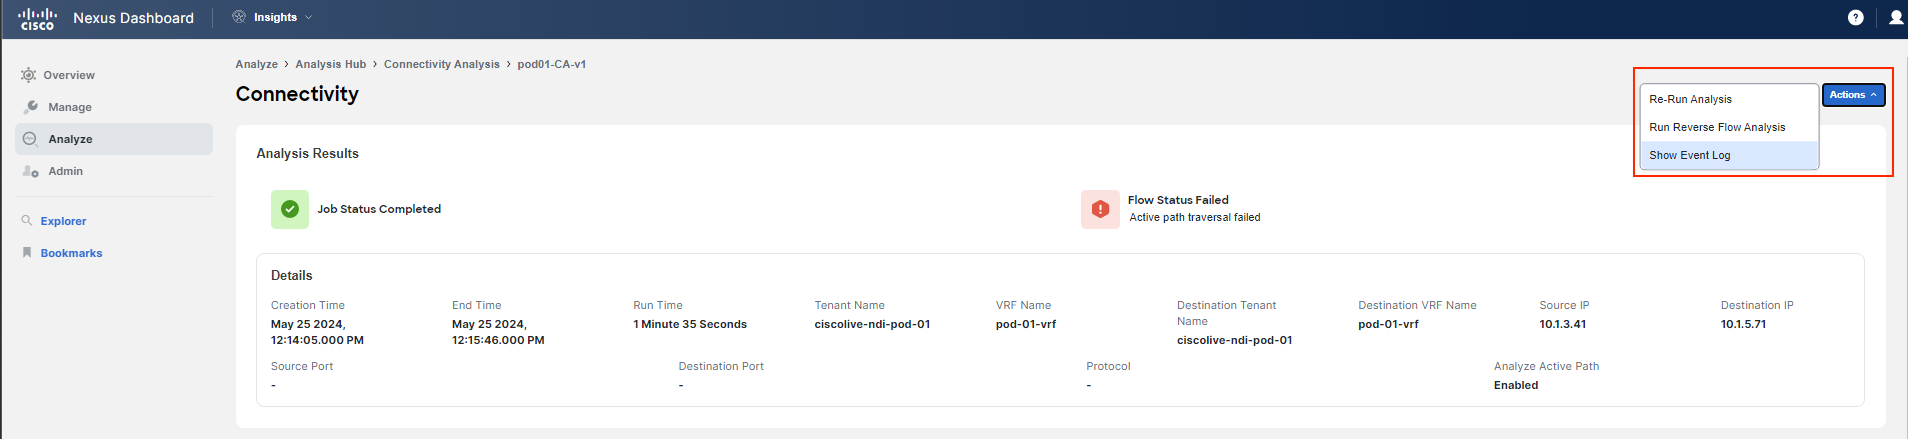
Go back to Nexus Dashboard Insights to verify that the remediation fixed the problem. Use Connectivity Analysis for final verification. Navigate to your analysis that failed previously and re-run it by clicking on the Actions button and selecting the Re-run Analysis option.
The window with the analysis setup will open. Add the suffix "v2" to the name and then click on the Next button multiple times to go through the analysis configuration steps. You do not need to change anything else. It may again take several minutes. You can either pick up your work on the previous use-case and come back later or review the screenshots below, depending on how much time you have left, or just wait for your analysis to finish. Consult with your proctor about this.
Note
Use the IP addresses related to your POD as before. The screenshot below is for reference only.
Step 9
After the analysis has finished the job, review the results. You can see that there is no more packet drop on the leaf as before. Click on the leaf in question and review the details of ELAM. Check the header information as you did before.
ELAM is a very powerful tool that translates the states and information from the ASIC level into a human-friendly format. You can see very detailed information from the perspective of L2/L3/L4 headers.
After you verified that there are no more drops and that the communication is working again, you can reply to billing team: "the issue has been solved".
You are done with this use-case and may move to the next one.