Use-Case 6 - Troubleshooting Flows Scenario 2
Troubleshooting Flows with Flow Telemetry, Explore, and Delta
Nexus Dashboard Insights provides capabilities to collect flows on demand. Flows provide deep insights at a flow level, giving details such as average latency or packet drop indicators. It also raises anomalies when the latency of the flows increases or when packets get dropped due to congestion or forwarding errors.
In this use-case, you will use this capability to troubleshoot broken application communication.
Scenario
You received the following message from the application team: "It seems the 'currency' service is not working. Our customers are reporting that they cannot set their 'currency'. This is impacting our 'frontend' pages and 'cart' service. Please find out what's going on and fix it as soon as possible. We already see customers leaving our e-shop."
Additional information
There was a maintenance window yesterday during which some ACI configuration changes were made to harden/secure the ACI fabric related to the L3out policy. The change window started on June 4th at 10:00 PM PT (June 5th 5:00 AM UTC) and lasted around 3 hours. This time-range information is provided for the purpose of Delta Analysis, and the configuration was pushed at some point in time. For flow visibility, please look at the latest time range when reviewing Flow Telemetry Anomalies. IP addressing for 'frontend': 10.x.1.0/24 and 'checkout': 10.x.4.0/24, where x is your PodID. IP addressing for 'currency': 10.100.150.0/24. This is shared across Pods.
Note
You can also check the Application Structure & Communication information in the Application Topology section, which is part of the flow use-cases section if you haven't done so already. You can find it in the left side navigation.
Based on all this information, you can either try to figure out the problem yourself without reviewing the steps in the Solution section or follow the guide to find the root cause of the problem.
Solution
Step 1
Log in to Nexus Dashboard Insights to review the state of your network and communications between application tiers. Having reviewed the application tiers and how they should communicate, you know the addressing, so your first step is to check if the "frontend" and "checkout" tiers can communicate with the "currency" tier.
Step 2
Start by checking for any Flow Events in the fabric. Navigate to Manage > Sites, click on the DAL site, and then the Anomalies tab. Filter for the Connectivity category. You will see various anomalies related to connectivity. We want to focus on Flow Telemetry Events.
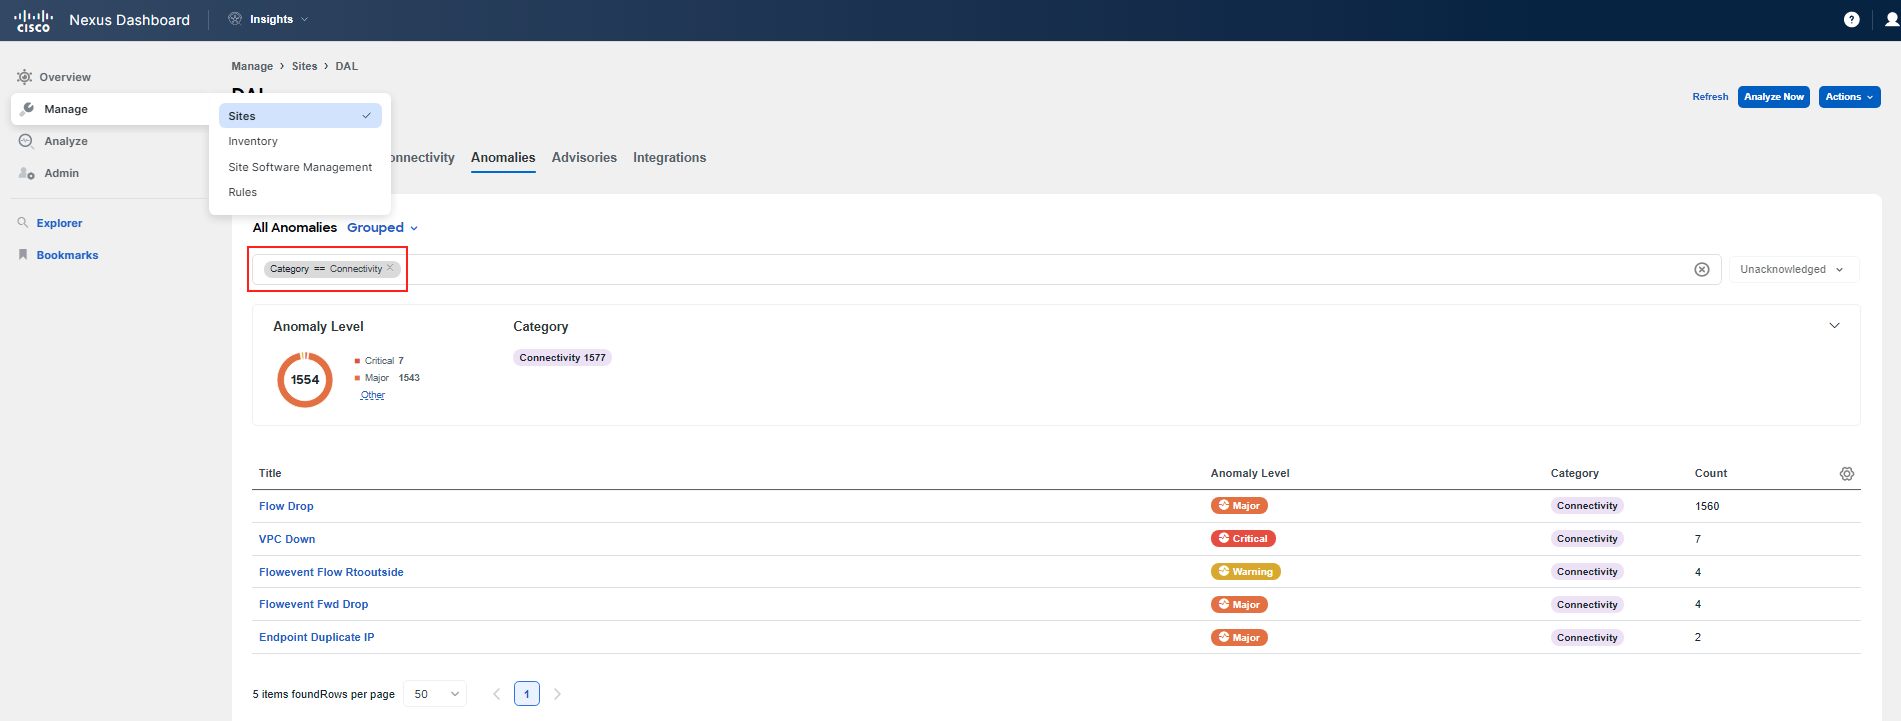
Note
Your view might be slightly different since you've worked on previous use-cases and as this view is shared among all Pods.
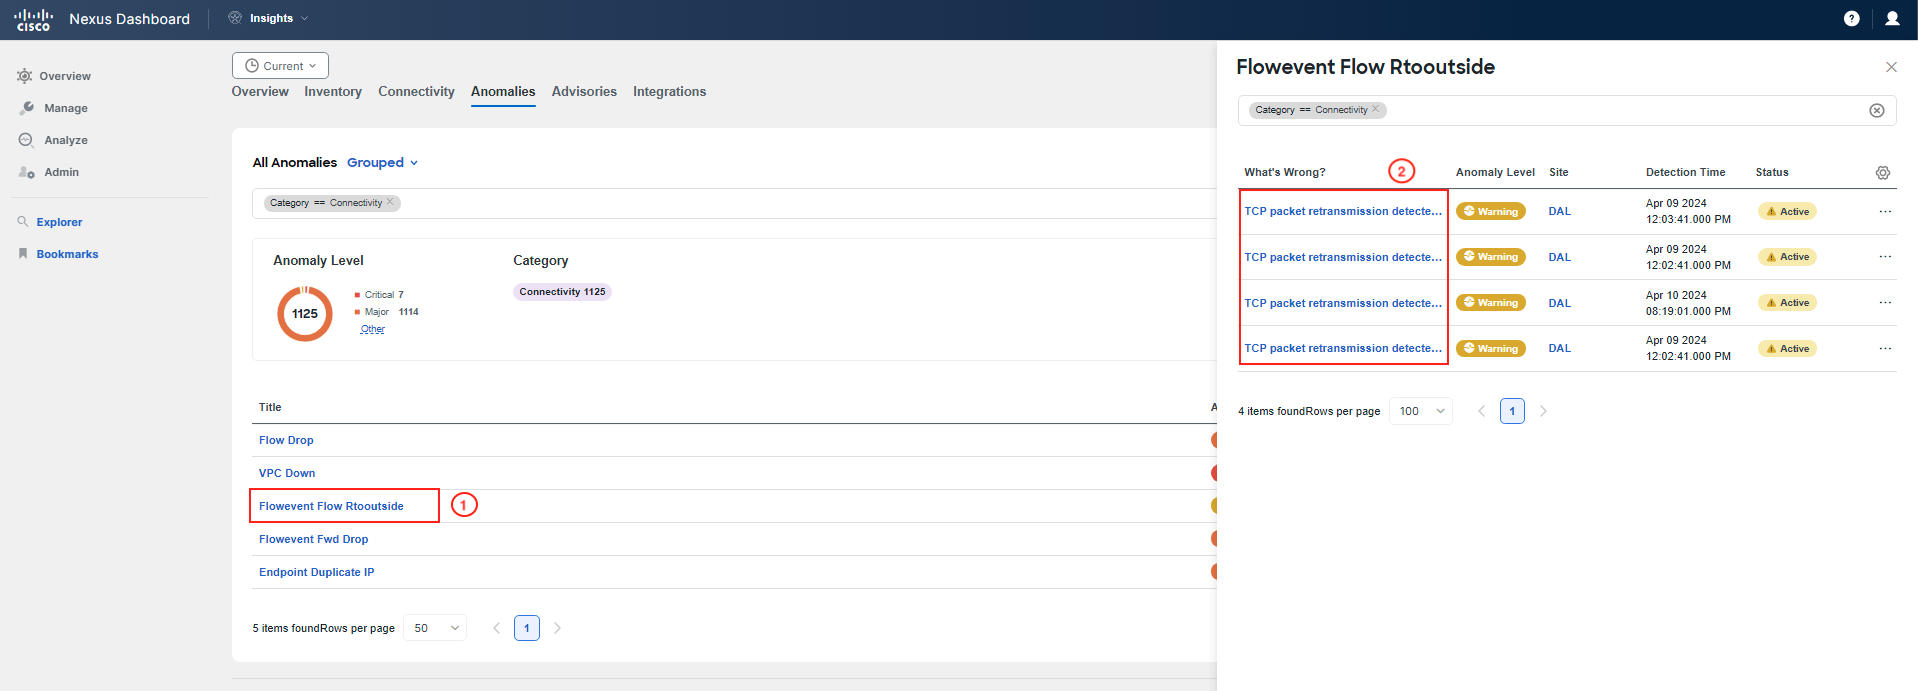
You can observe that there are two types of Flow Telemetry Events. The first one is the Flowevent Flow Rtooutside; click on it and examine this anomaly. If this anomaly is not present, simply move on.
Upon a quick examination, you did not find anything relevant.
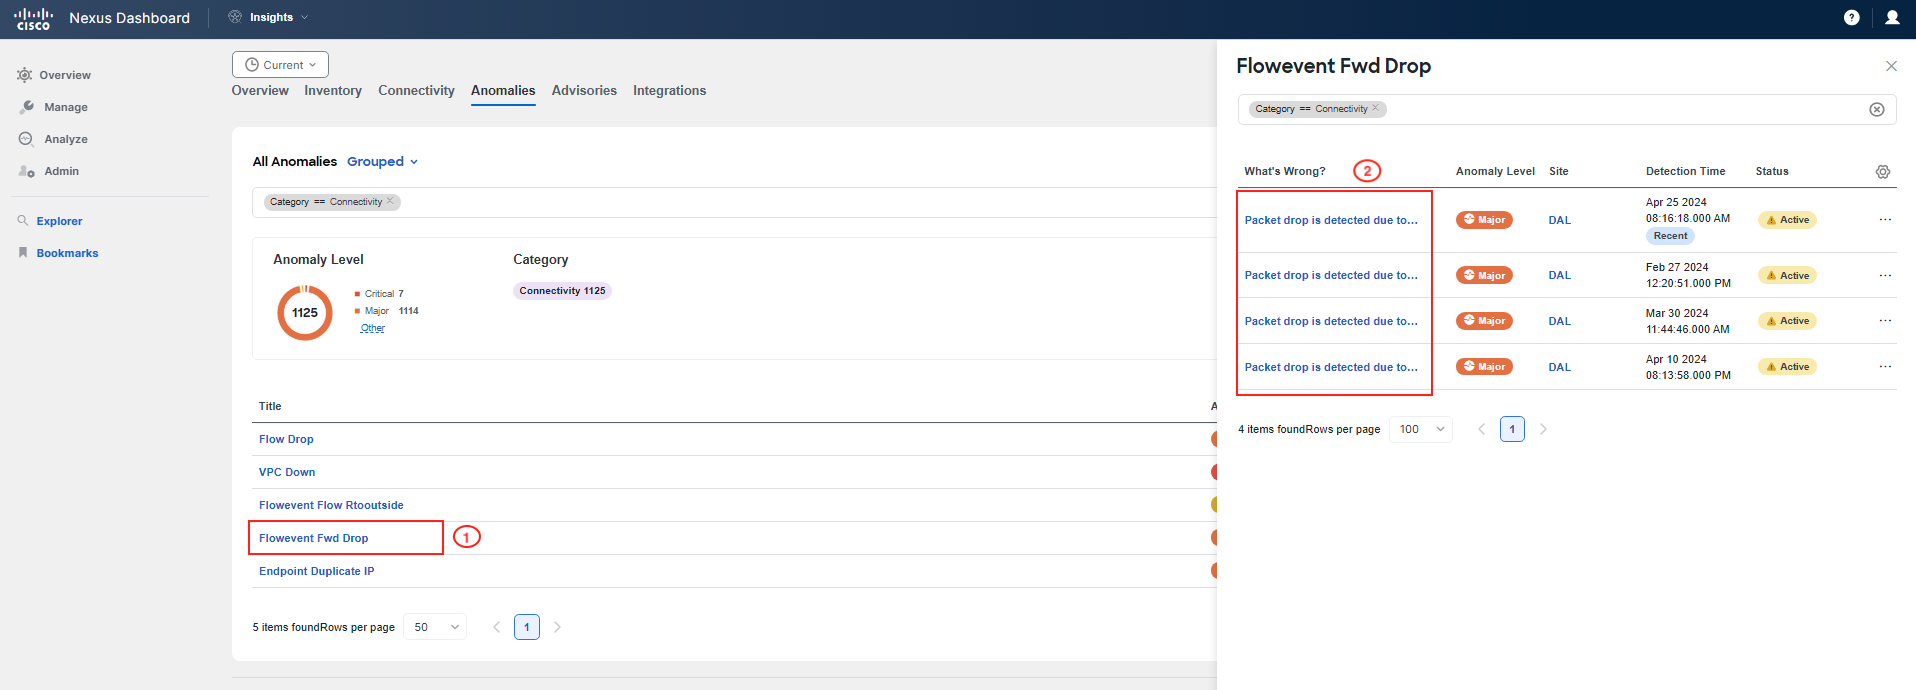
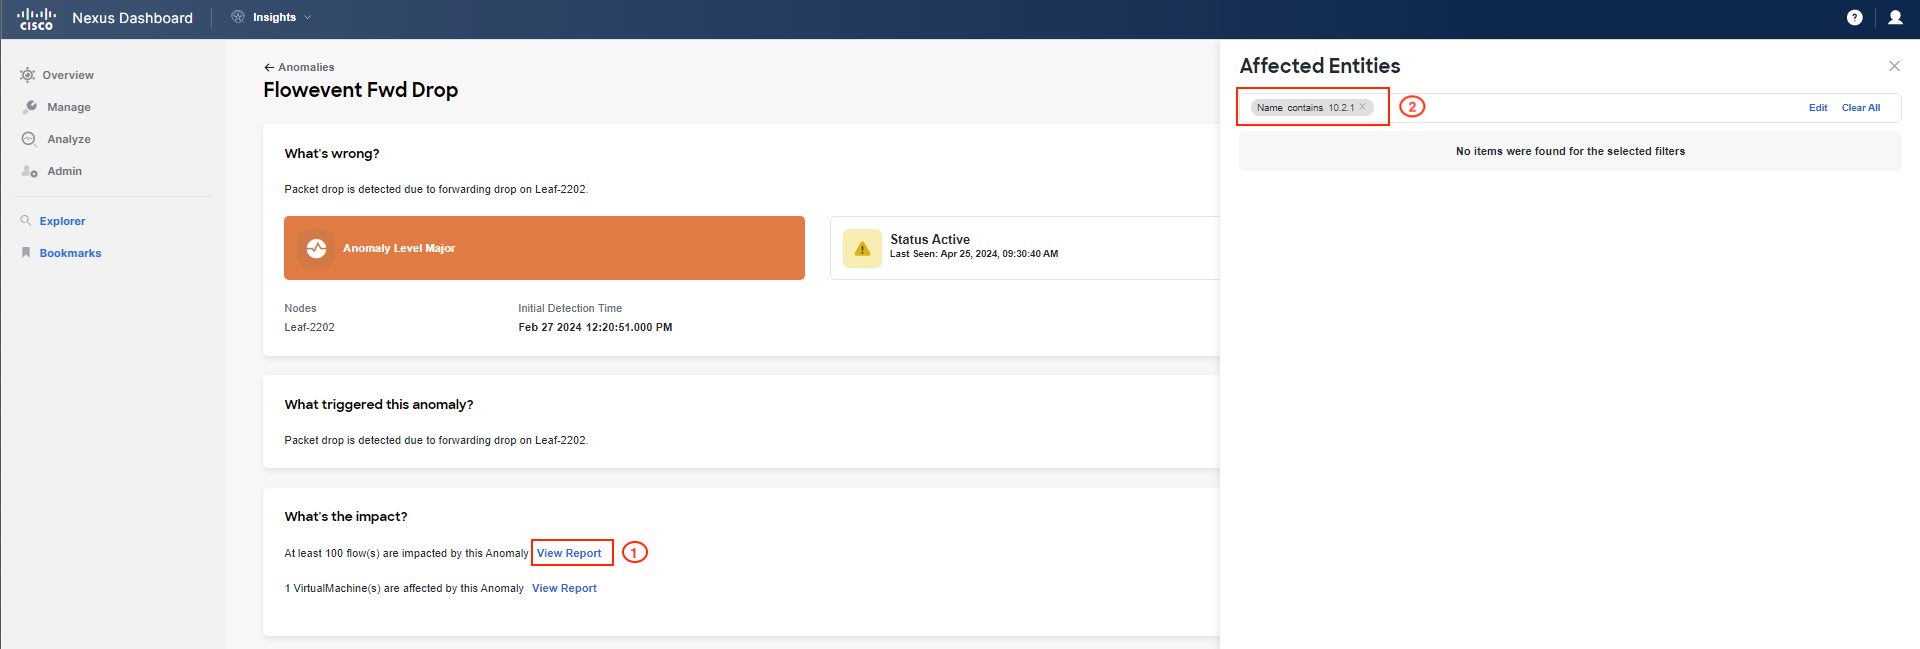
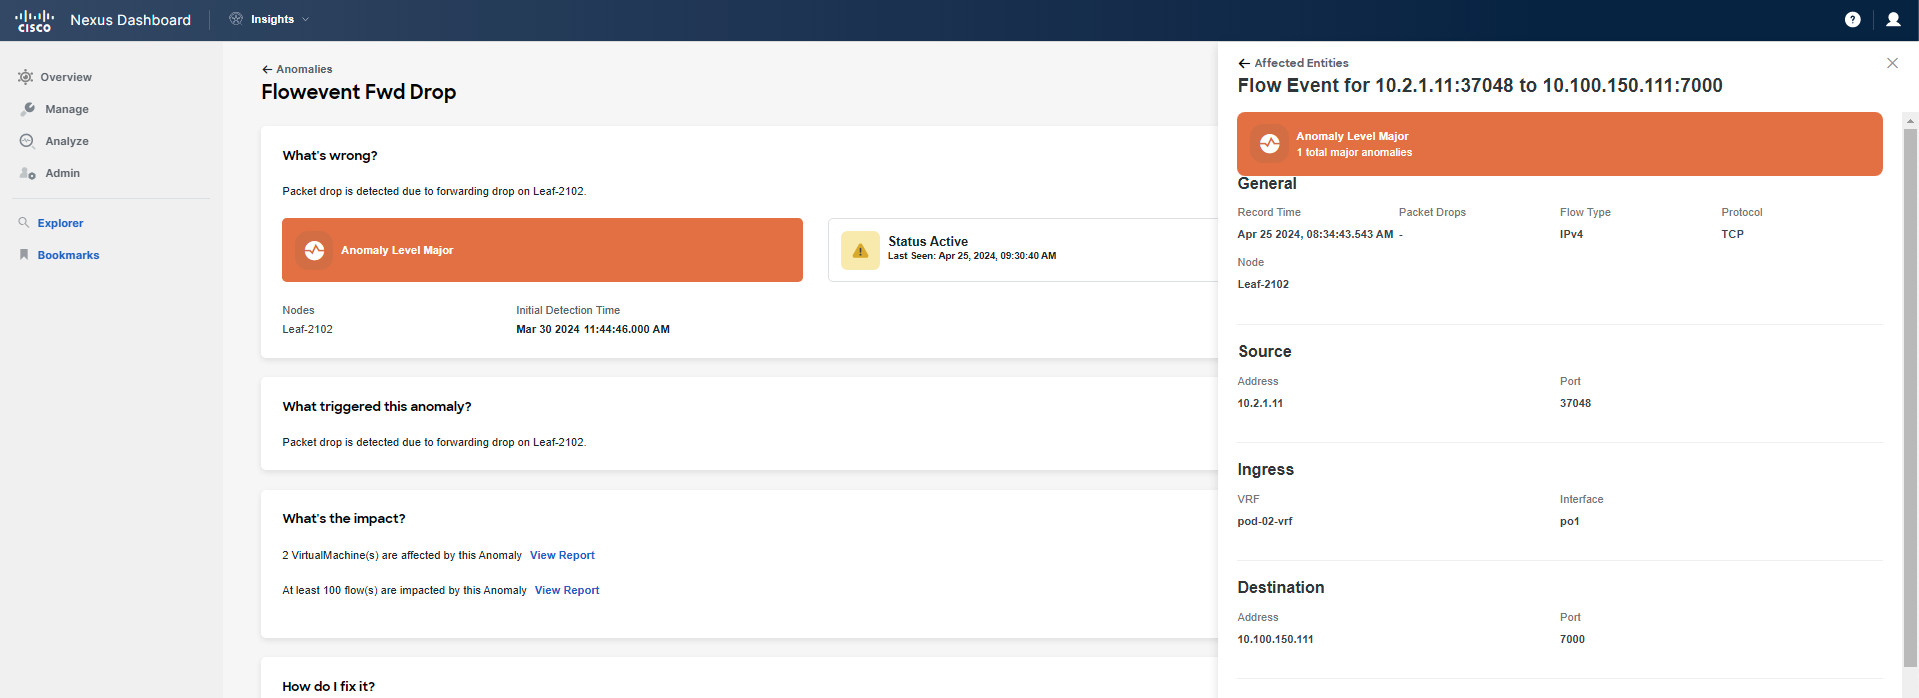
So, you then click on Flowevent Fwd Drop, and investigate the part highlighted as what's wrong. If you hover your pointer over it, you will see that these refer to packet drops on leaf switches. Click on one of them to review further.
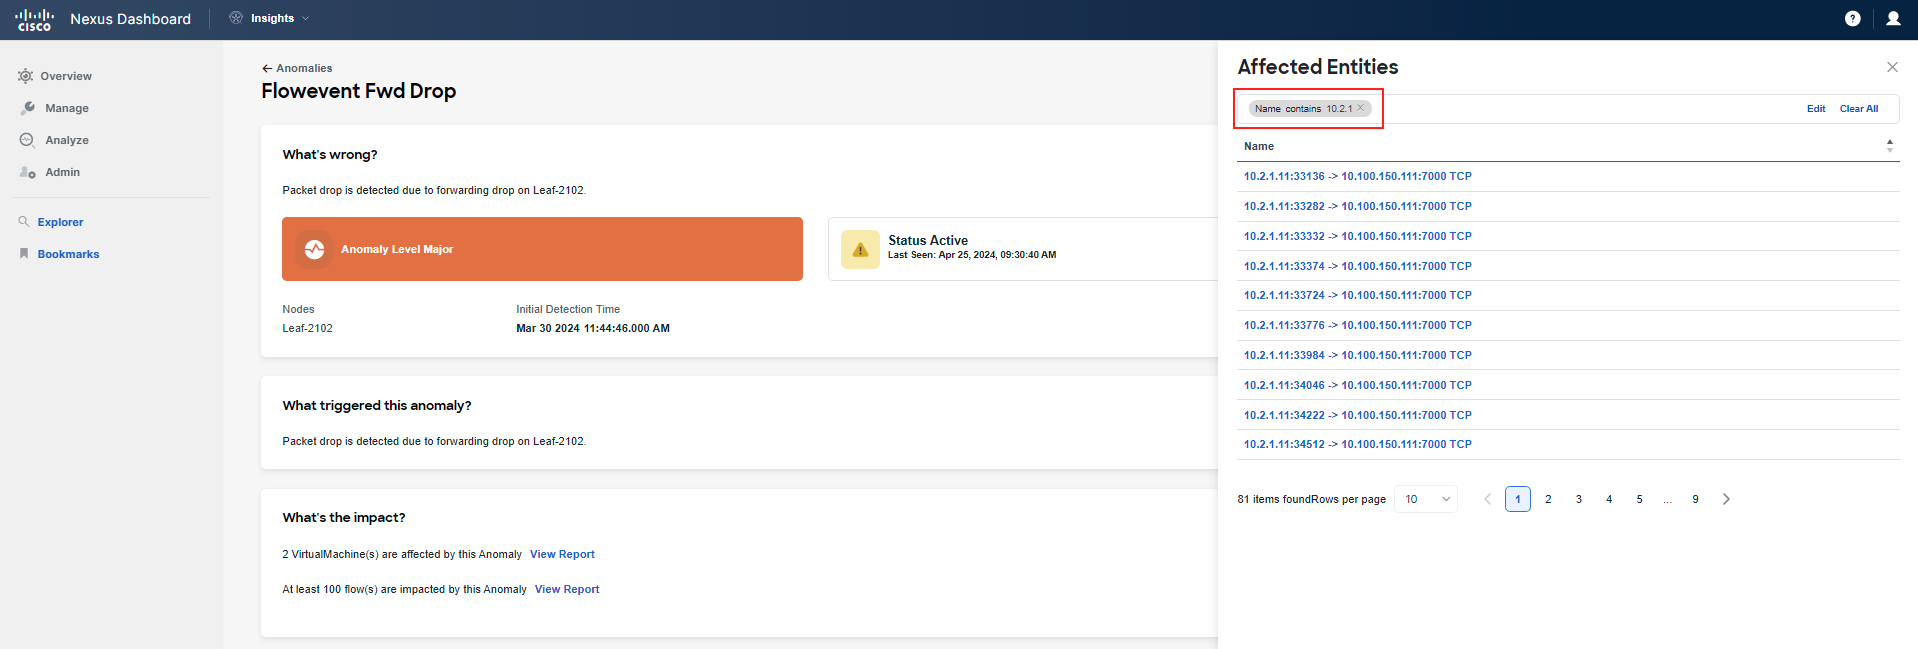
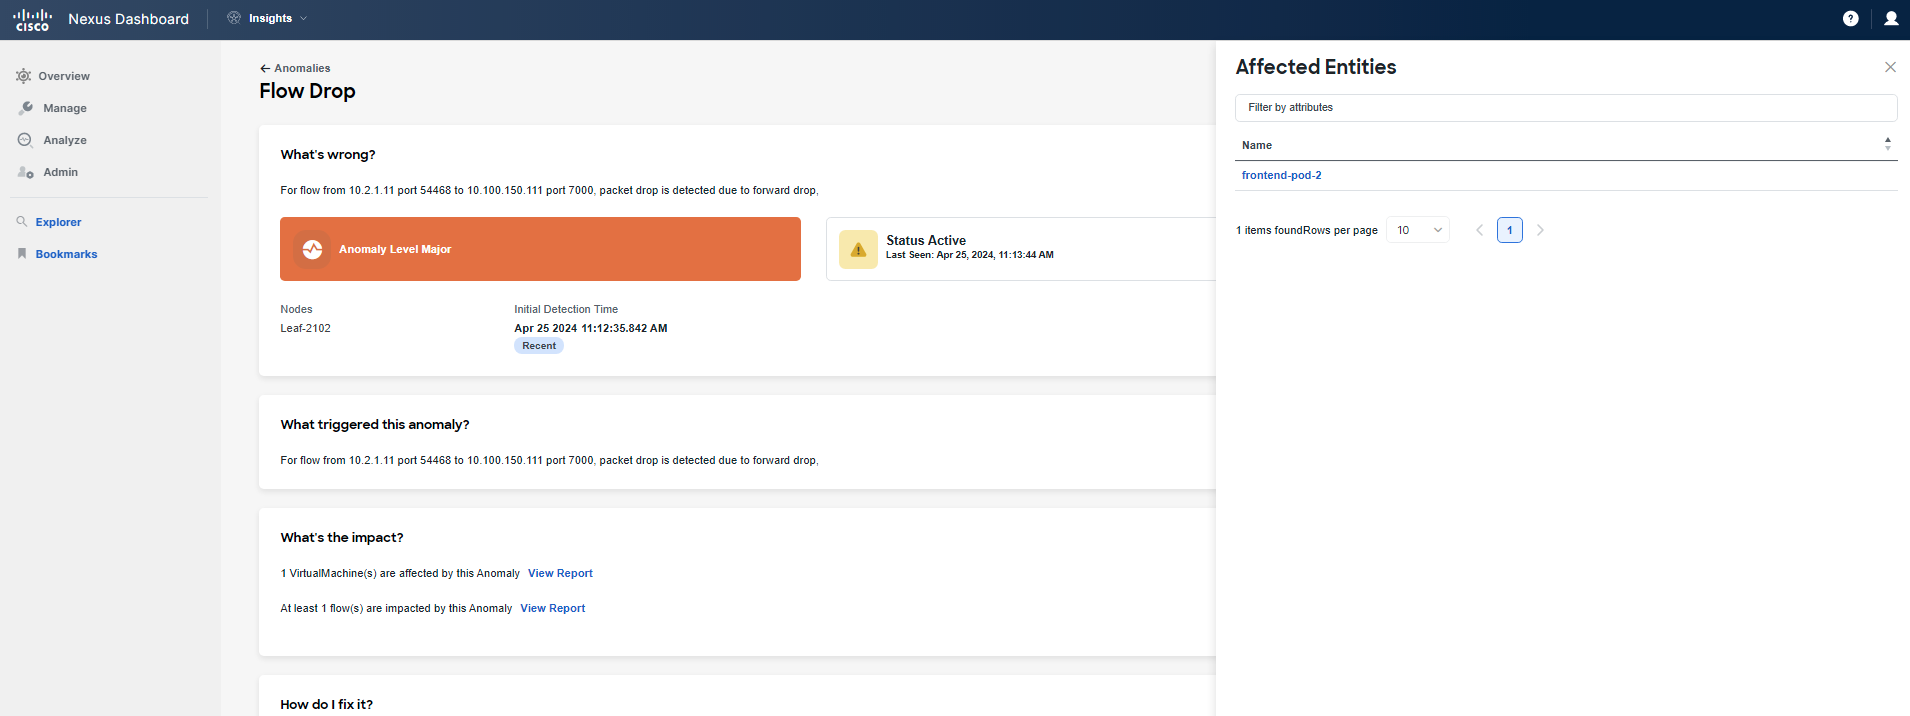
Now, focus on What's the impact to check related flows and VMs. Click on View Report and filter the list of flows with the IP address of "frontend/checkout". If you cannot find any flows, go back and select another leaf under What's wrong for Flowevent Fwd Drop. Repeat this process until you find flow(s) related to your Pod.
Warning
If you cannot find any flows, raise your hand and call a lab proctor. Due to the nature of the lab setup and many tenants having the same scenario issue, it may happen that the UI does not show your specific flows. There is a UI limit of displaying only 100 flows, although the platform stores all of them in storage. The business unit developing the product made this decision to speed up UI refresh and loading times. This is already being reviewed for improvement based on our feedback. So if you cannot find your flow, you can either review the screenshots in this step or call a proctor who will check which IP address you should use for filtering. This IP address will be from a different pod.
Note
IP addressing for "frontend": 10.x.1.0/24 and "checkout": 10.x.4.0/24, where x is your PodID. Please use the contains option when defining the query. The screenshots below are exemplary only; you need to reference your PodID and use the proper addressing assigned to your Pod.
A Little Bit of Theory
Flow telemetry events are always on and pervasive, with no requirement for rules to be configured beforehand. Flow telemetry enables the triggering of events upon their occurrence. The packets are exported to the collector for analysis. Flow telemetry events enhance and complement the flow capabilities in Nexus Dashboard Insights, enriching anomaly generation for both flow telemetry and flow telemetry events. The data export to Nexus Dashboard Insights is done directly from the hardware without the control plane needing to process the data. Statistics are assembled into packets with a configurable MTU size and a defined header. These packets are sent as in-band traffic from the Cisco ACI fabric. Headers are configured by software, and the streamed packets are UDP packets.
Step 3
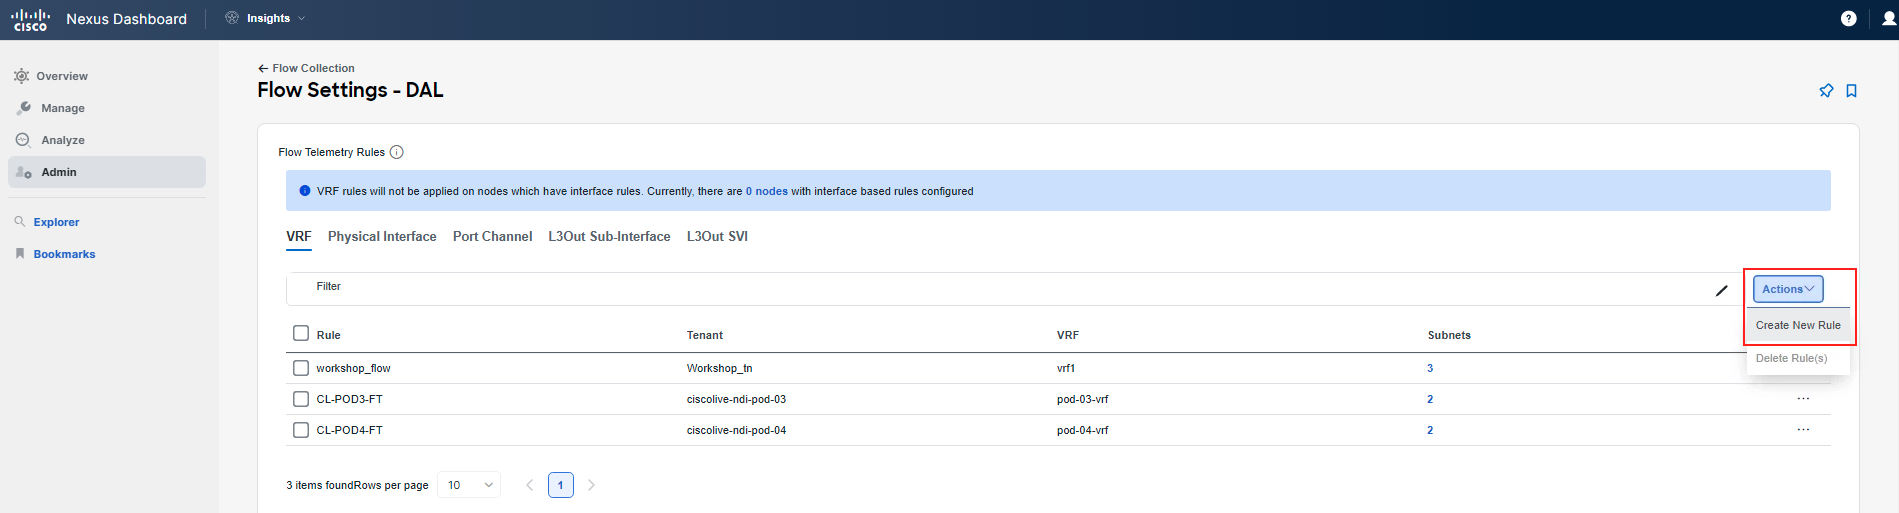
You have confirmed that the problem lies with forwarding, as you can see flow event drops being reported by Nexus Dashboard Insights. Flow events provide basic information. As the next step, you want to drill down. To obtain full Flow Telemetry, you need to configure granular flow rules. Therefore, navigate to Admin > System Settings > Flow Collection. Follow the screenshots to perform flow rule configuration.
Note
You will use the subnets assigned to your Pod. "Frontend": 10.x.1.0/24 and "checkout": 10.x.4.0/24, where x is your PodID. You can double-check this in APIC. Further note that since this is a shared environment, and you may have already configured some FT rules for a previous use-case, some of the screens might appear differently to you.
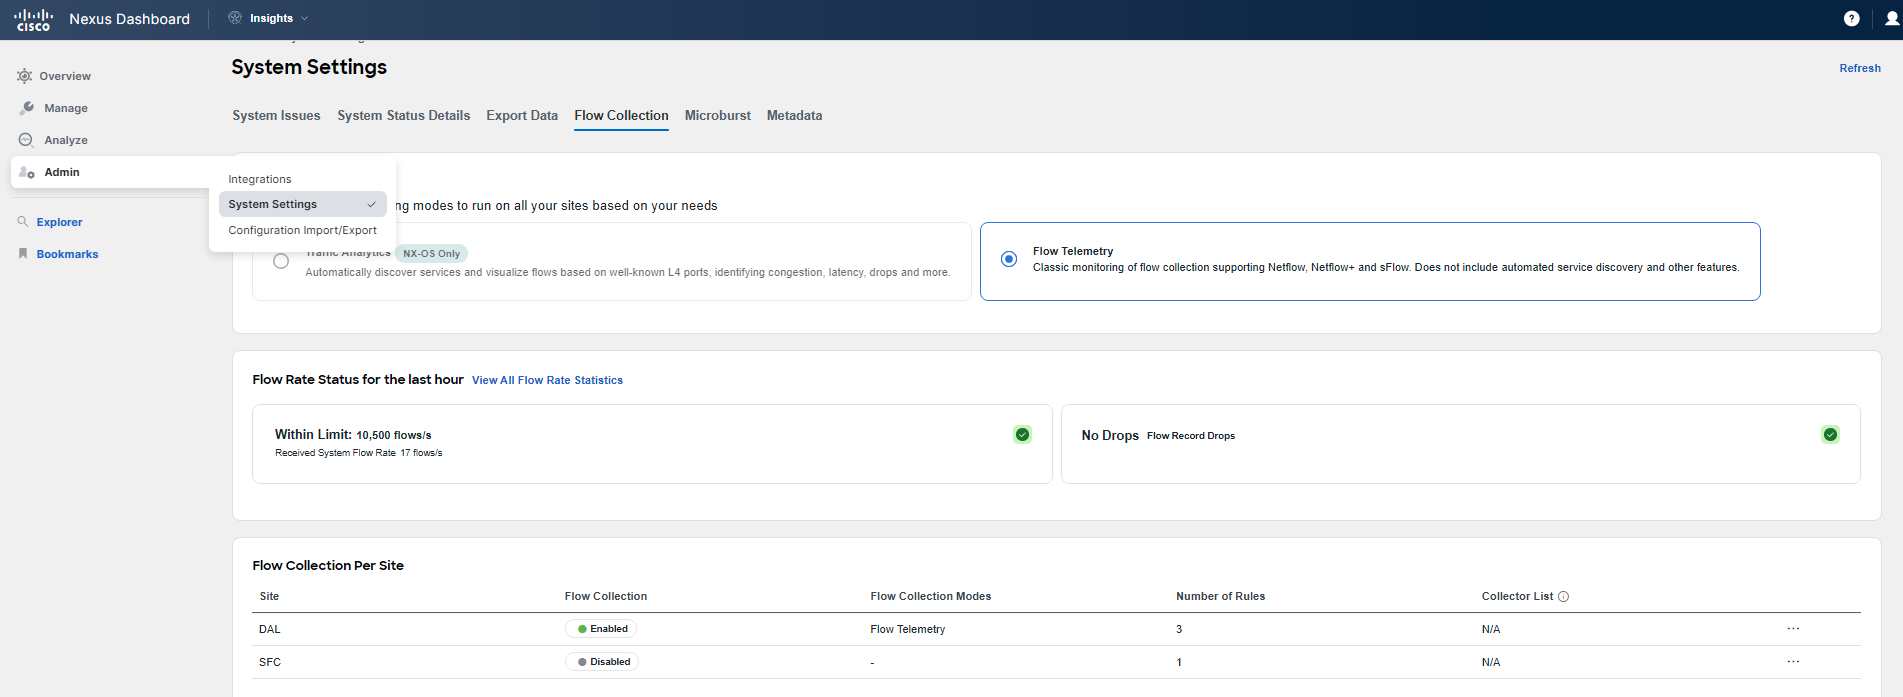
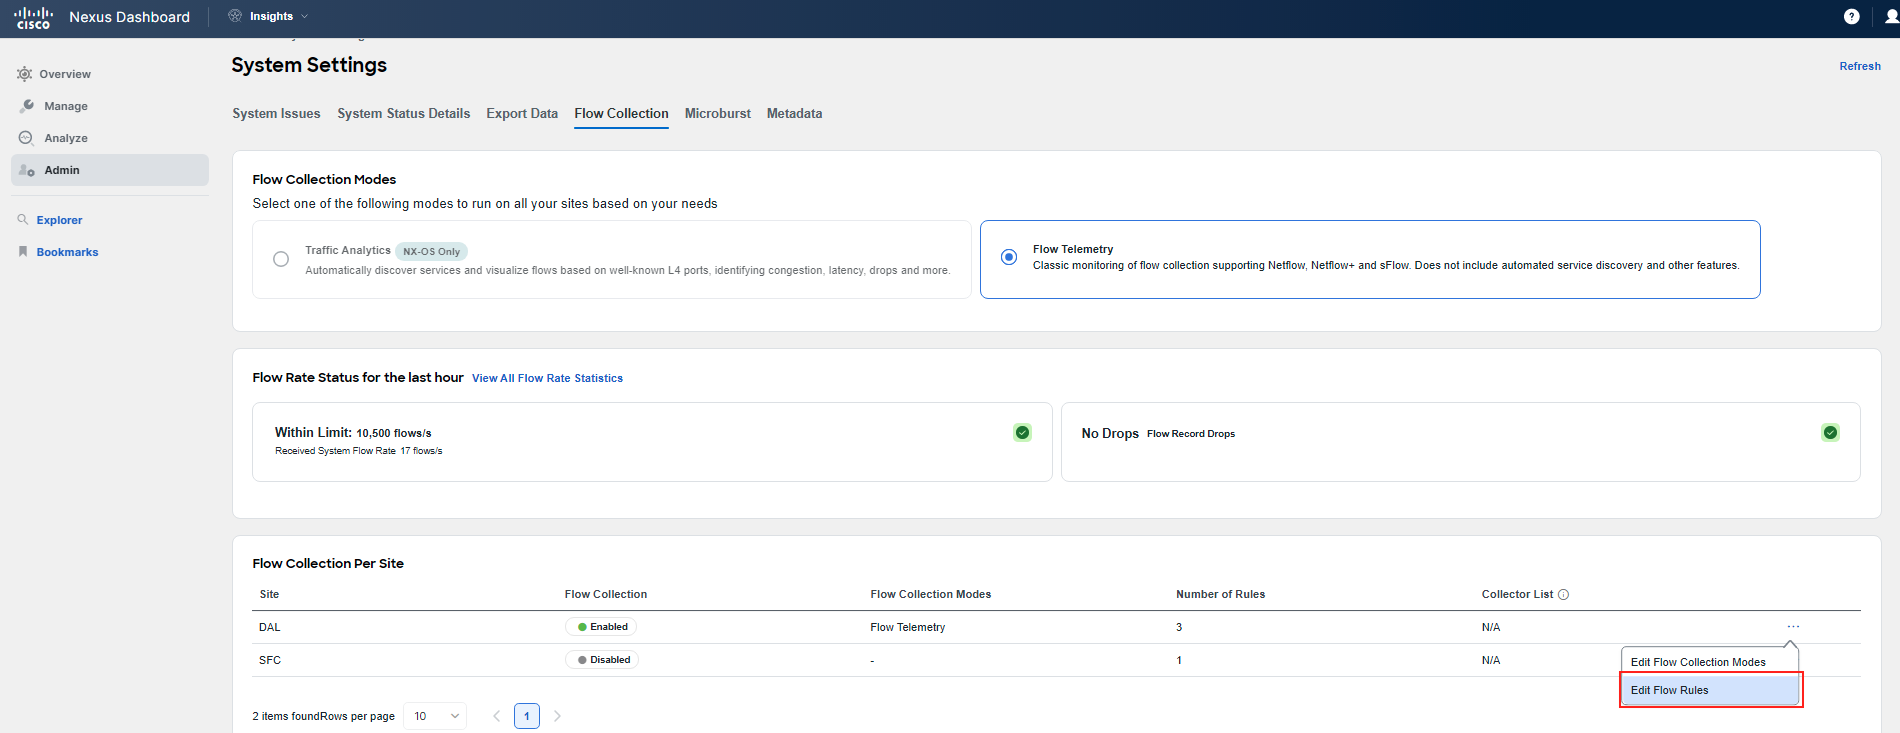
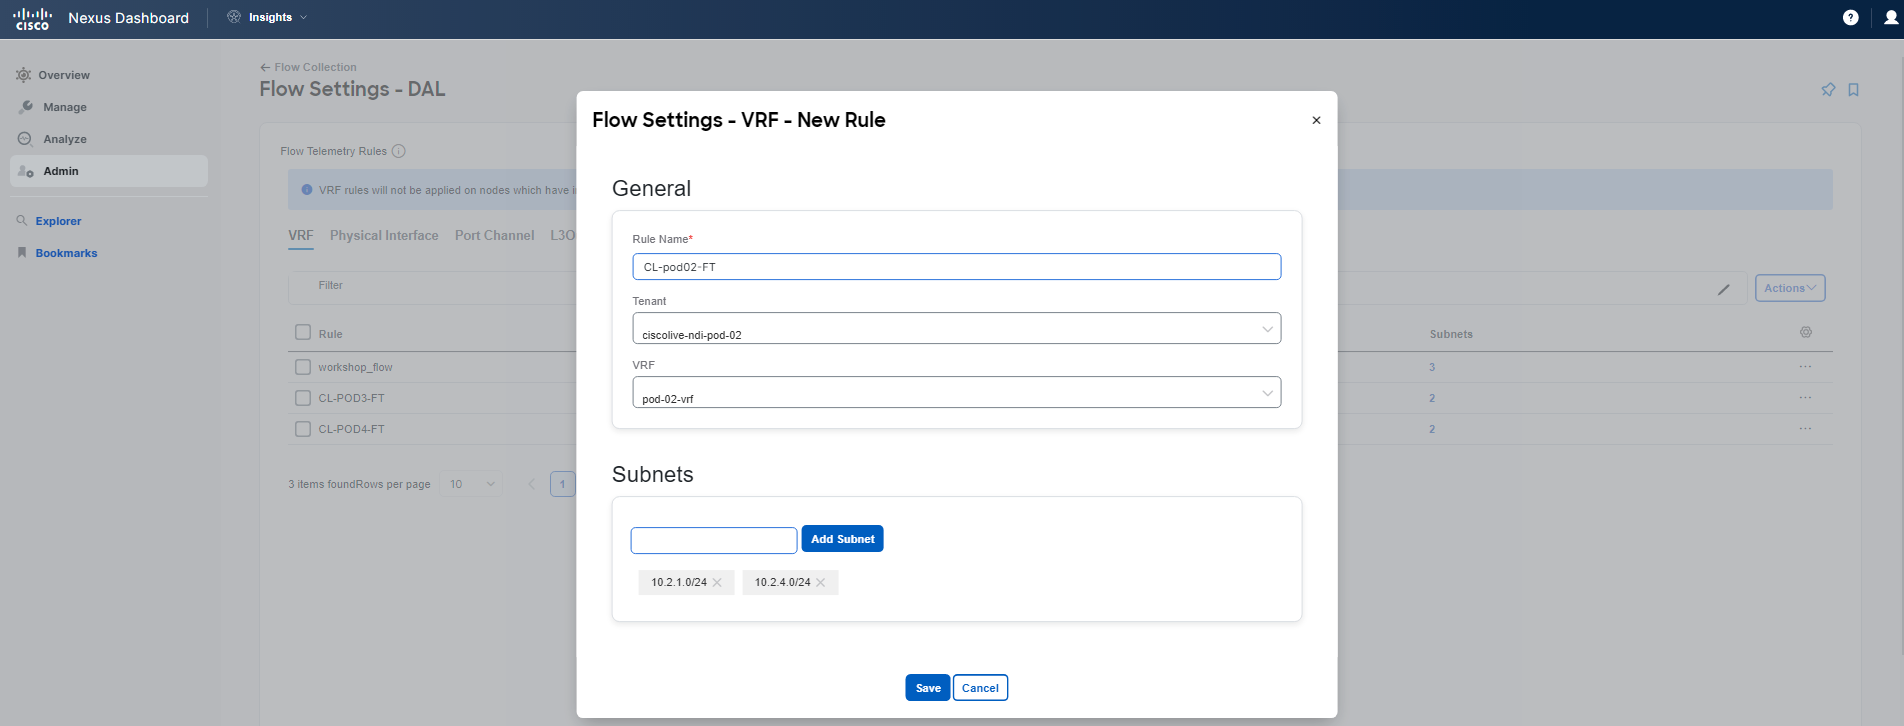
After specifying the subnets, click the Save button. You are done with the flow rules configuration. Give Nexus Dashboard Insight about 5 minutes to start displaying the collected granular Flow Telemetry records.
A Little Bit of Theory
The Flows page under a particular site displays telemetry information collected from various devices in an online site. The Flow records allow the user to visualize the flows per site. For a particular site, you can view flows by Anomaly Score, Packet Drop Indicator, and Average Latency. The flows engine also runs machine-learning algorithms on the behavior of the flows to raise anomalies, such as average latency, packet drop indicator, and flow move indicator. There is a graph that represents the anomalies in the behavior over a period of time. Flow telemetry and analytics provide in-depth visibility into the data plane. Flows collect the flow records streamed from the nodes and convert them into understandable EPG-based flow records.
Step 4
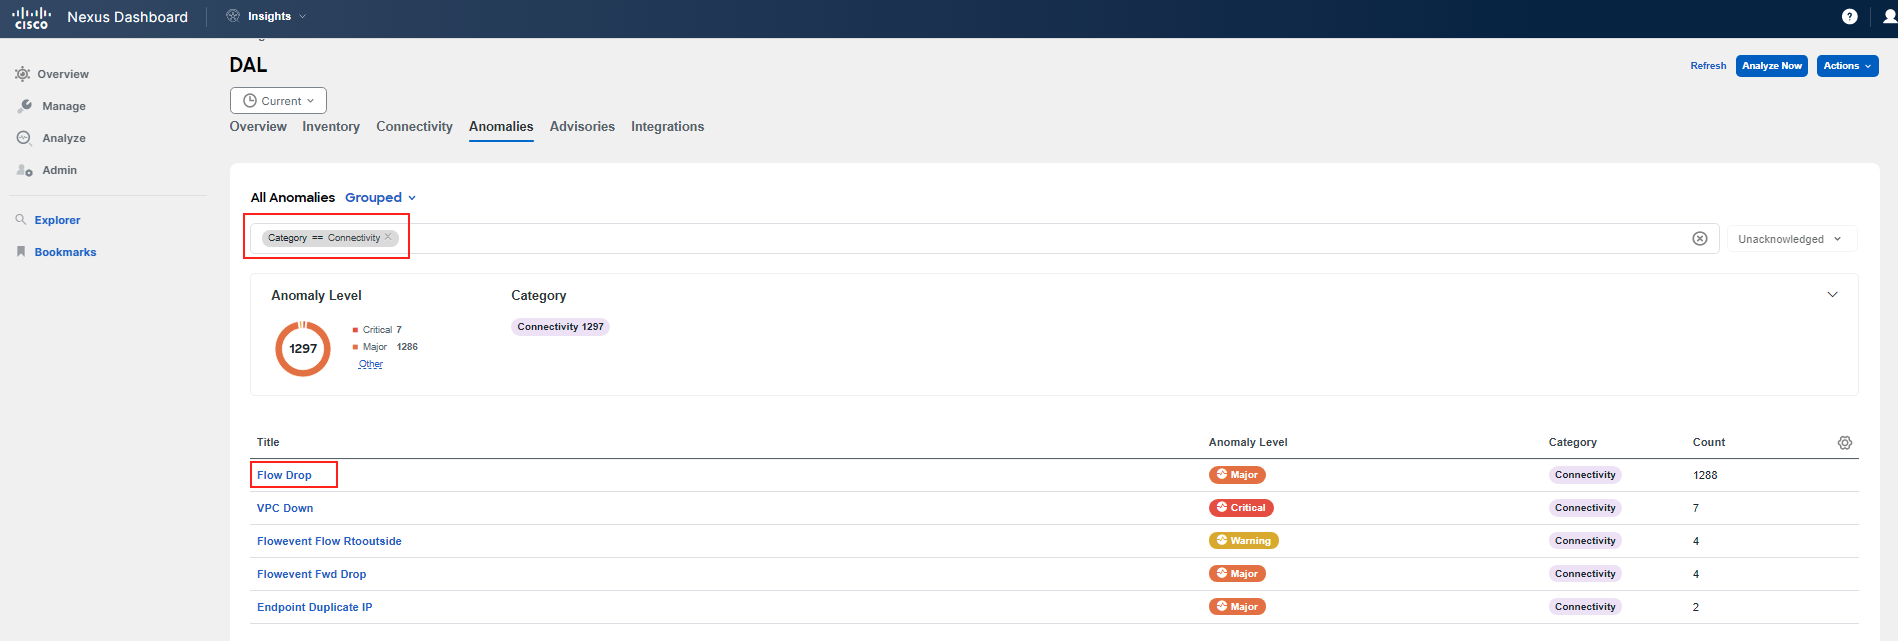
Navigate again to Manage > Sites > DAL > Anomalies. Now, you will investigate another type of connection anomaly - the Flow Drop anomaly. Click on it and explore.
Note
To easily identify your flow, please use the filter with the prefix, What's wrong contains 10.x.1.11, where x is your PodID. The screenshots below are exemplary only; you need to reference your PodID and use the proper addressing assigned to your Pod. Also, the timestamps in the screenshots are not to be used as a reference; you should see the latest anomalies.
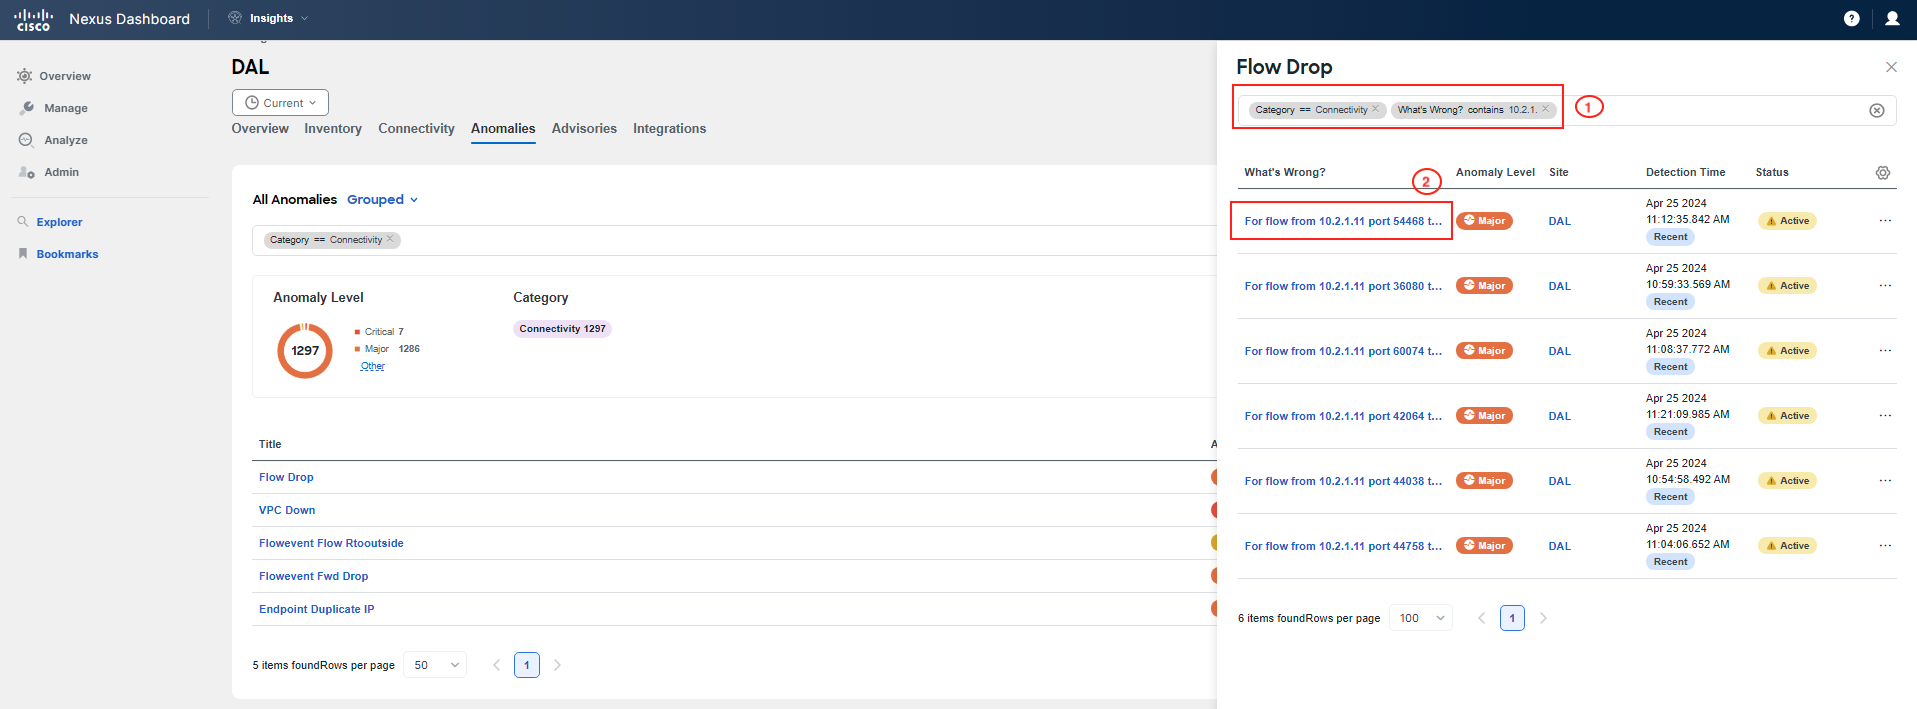
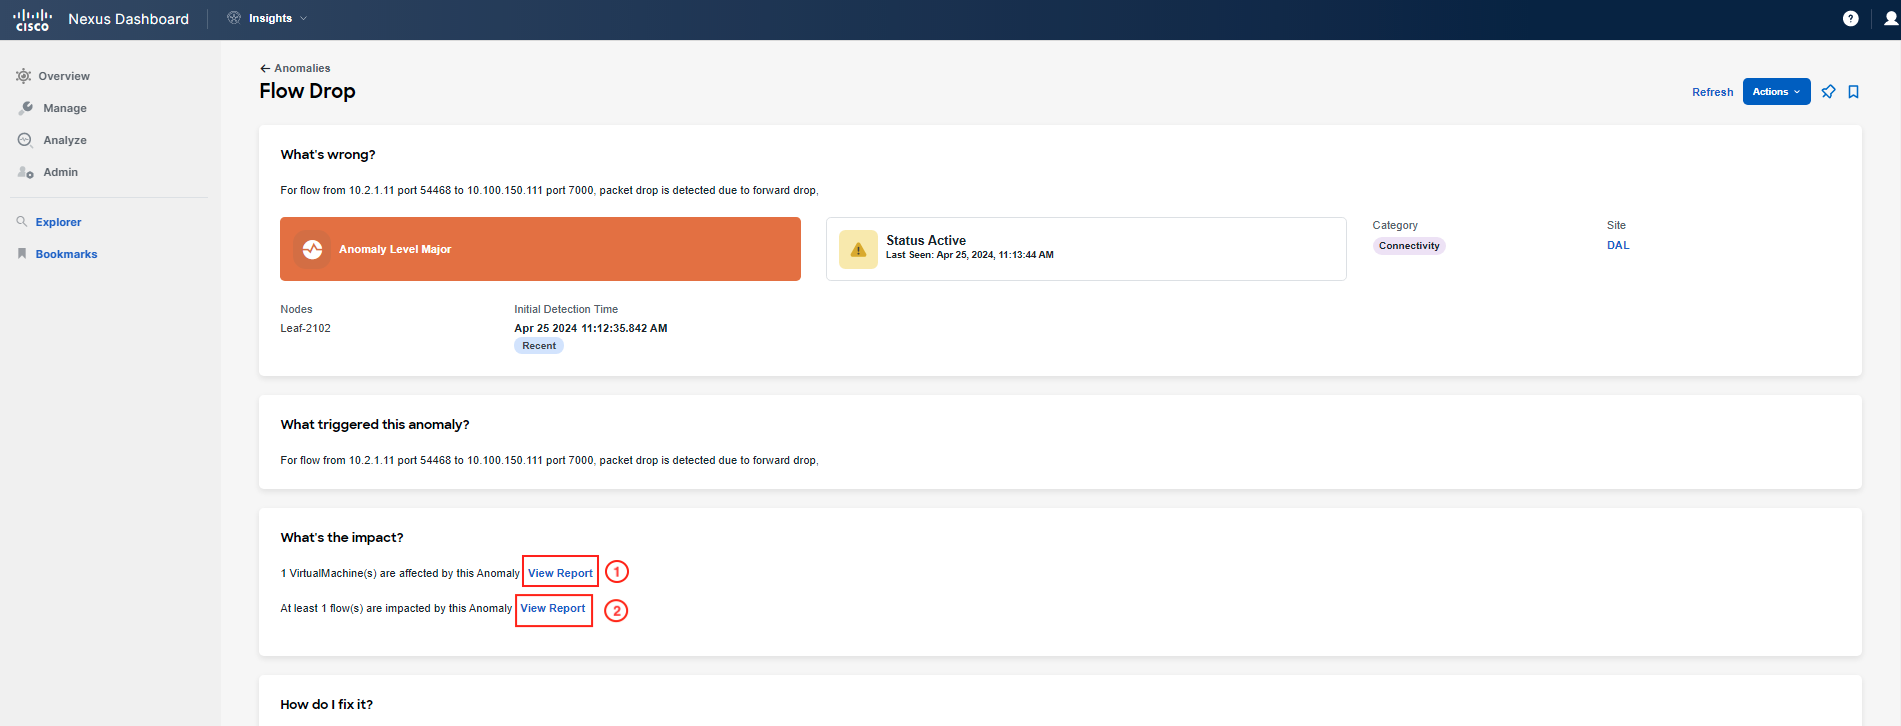

After reviewing the list of individual Flow Drop anomalies, you will notice that there are forwarding drops originating from the "frontend" VM with IP address 10.x.1.11 and the "checkout" VM with IP address 10.x.4.51, where x represents your PodID. The destination in both cases is the "currency" service with an IP address of 10.100.150.111.
Note
The "currency" service is hosted outside of ACI, hence its IP address is common across Pods.
Step 5
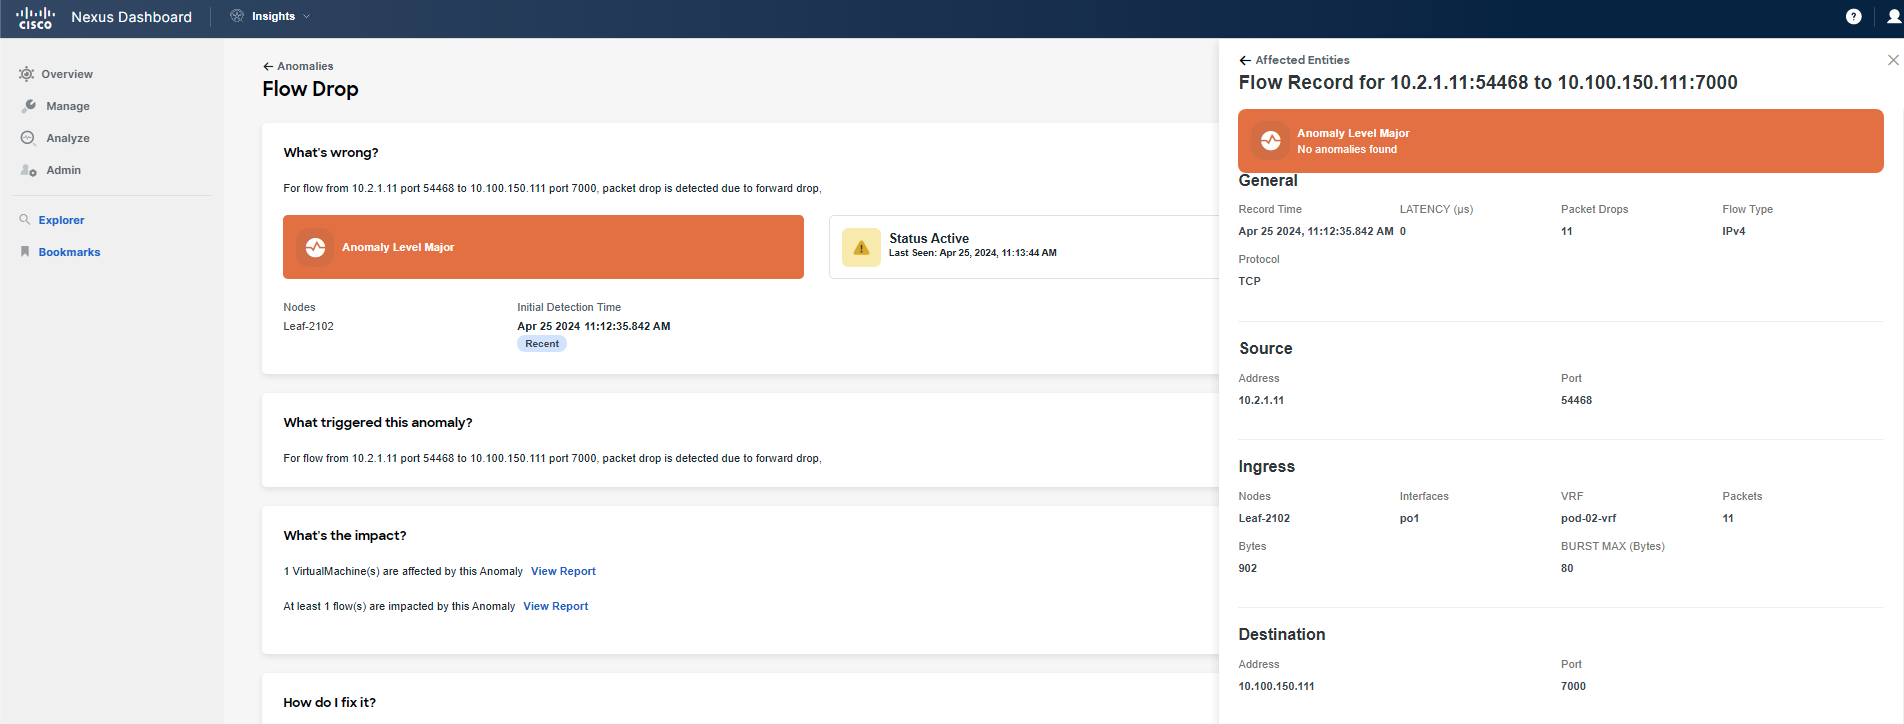
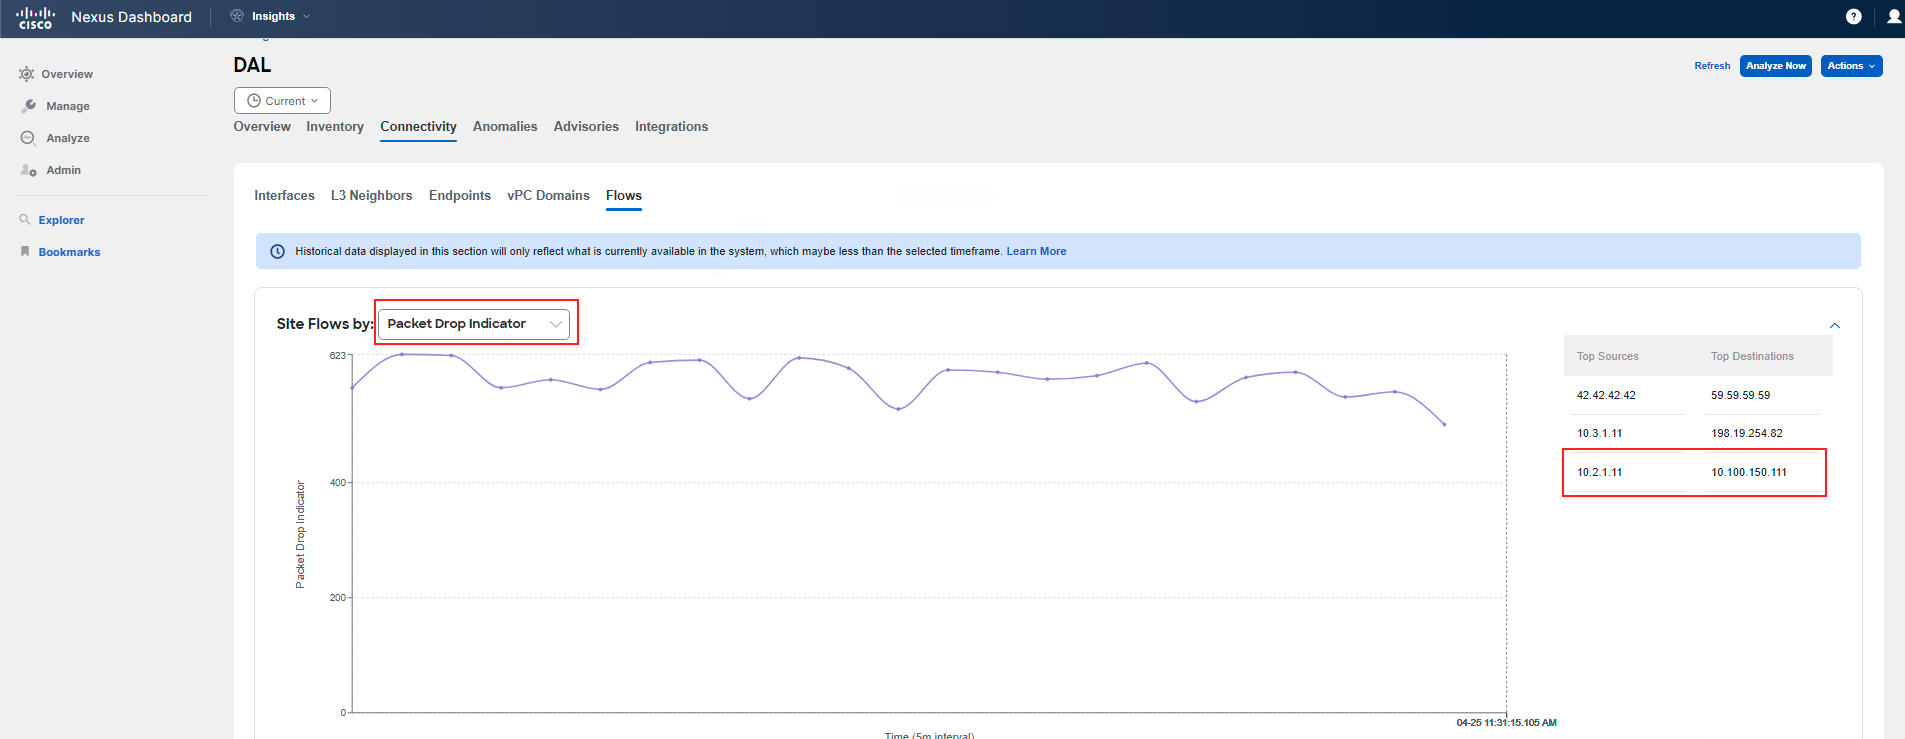
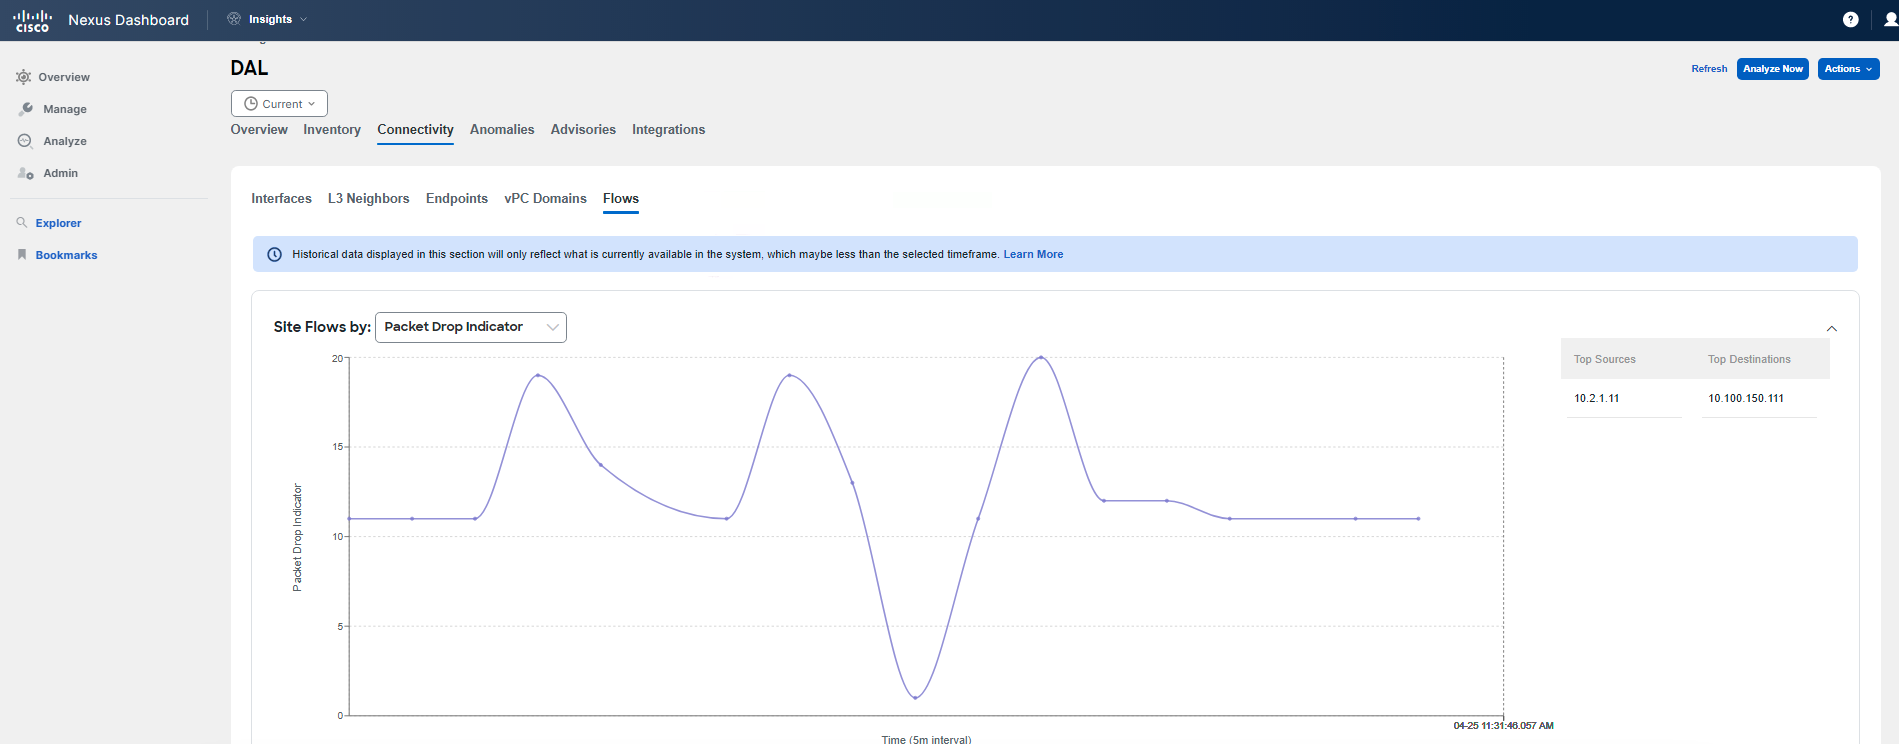
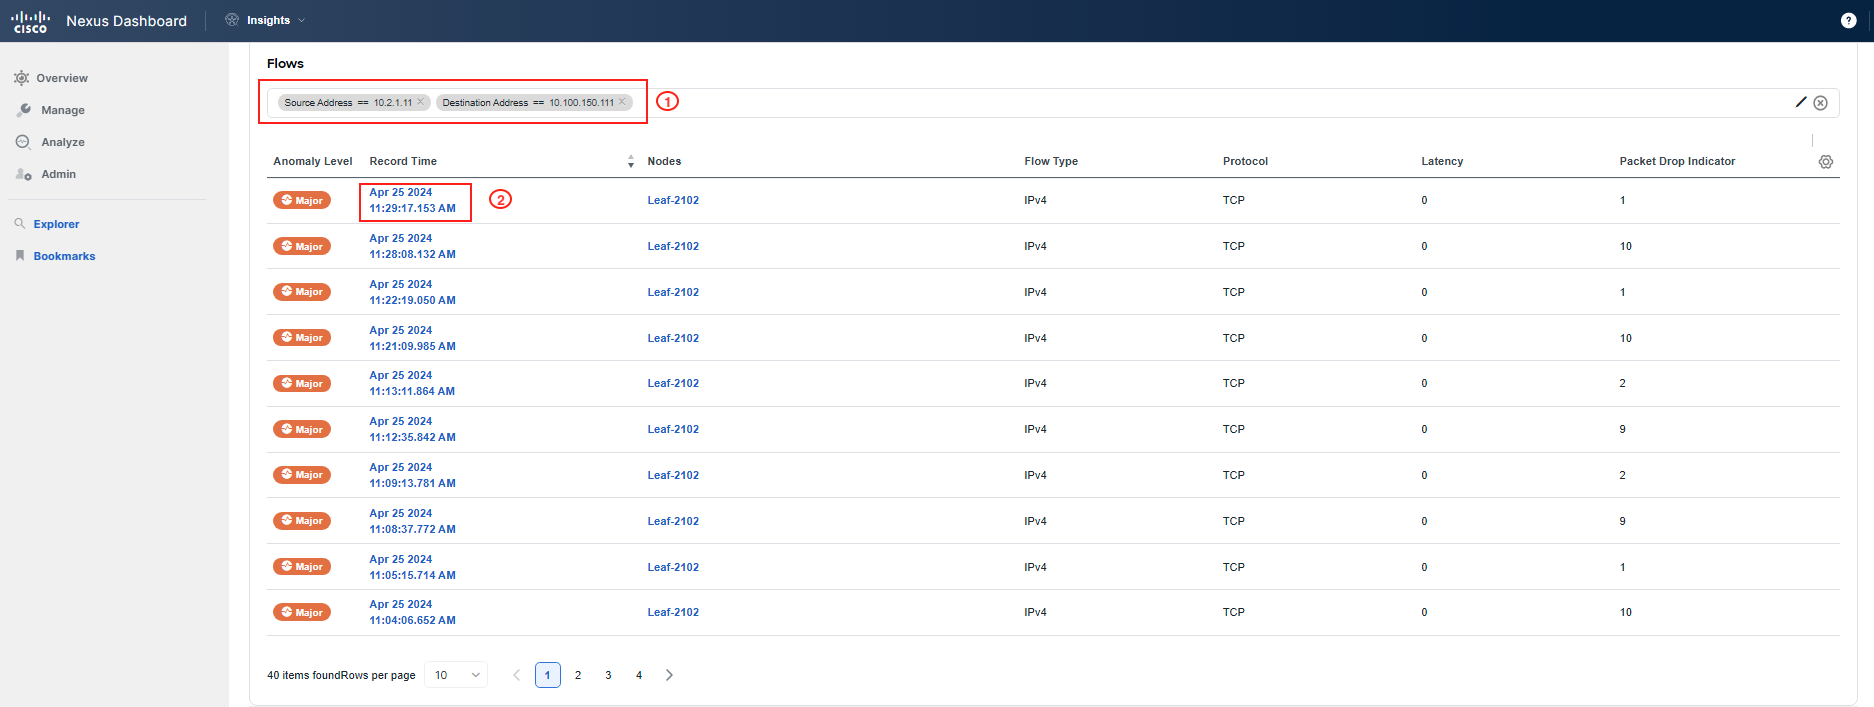
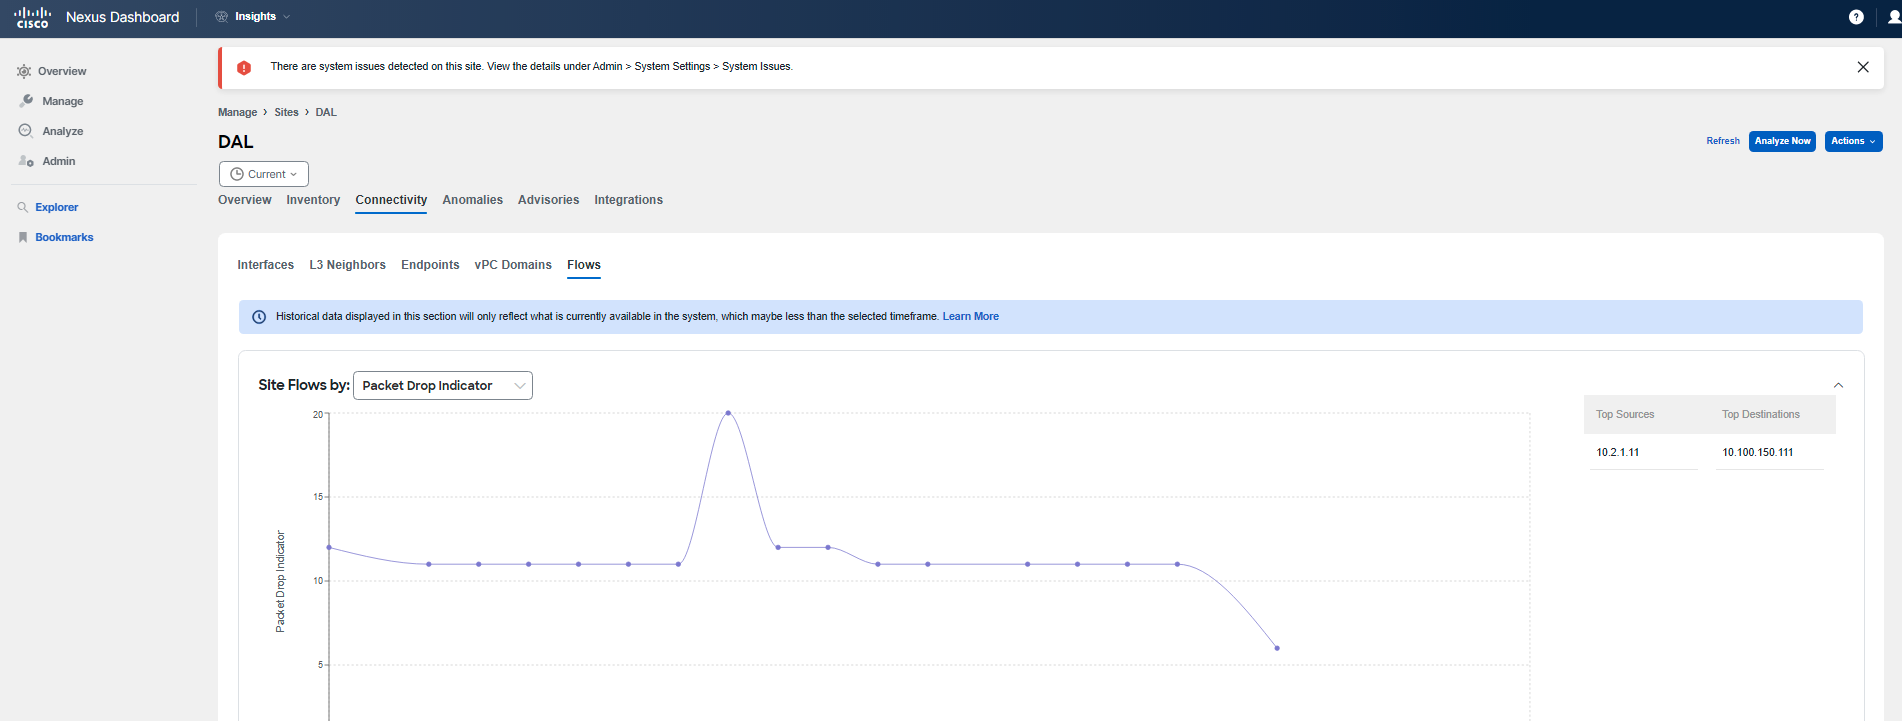
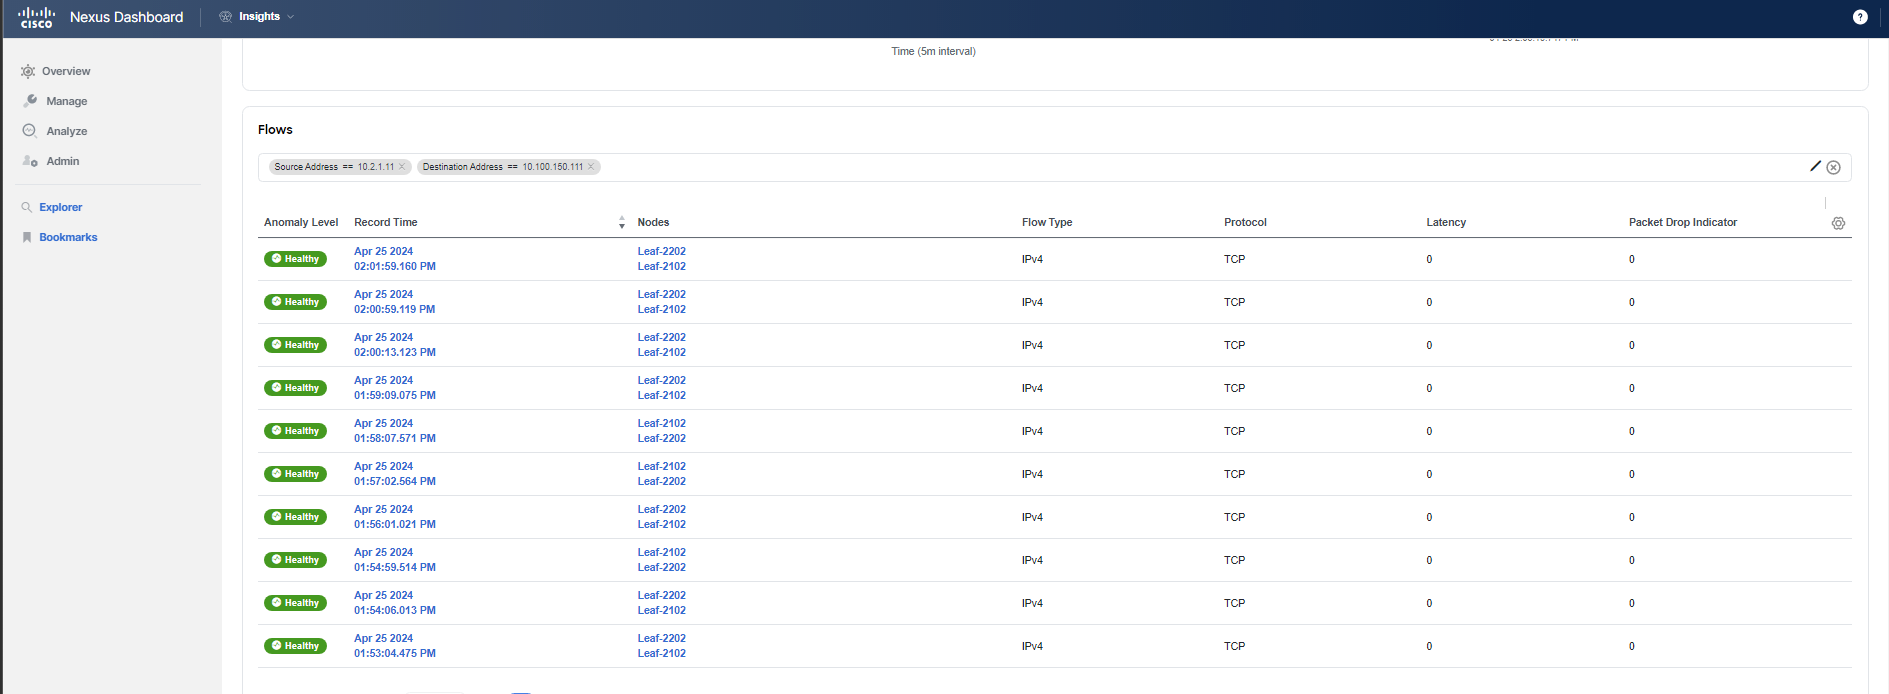
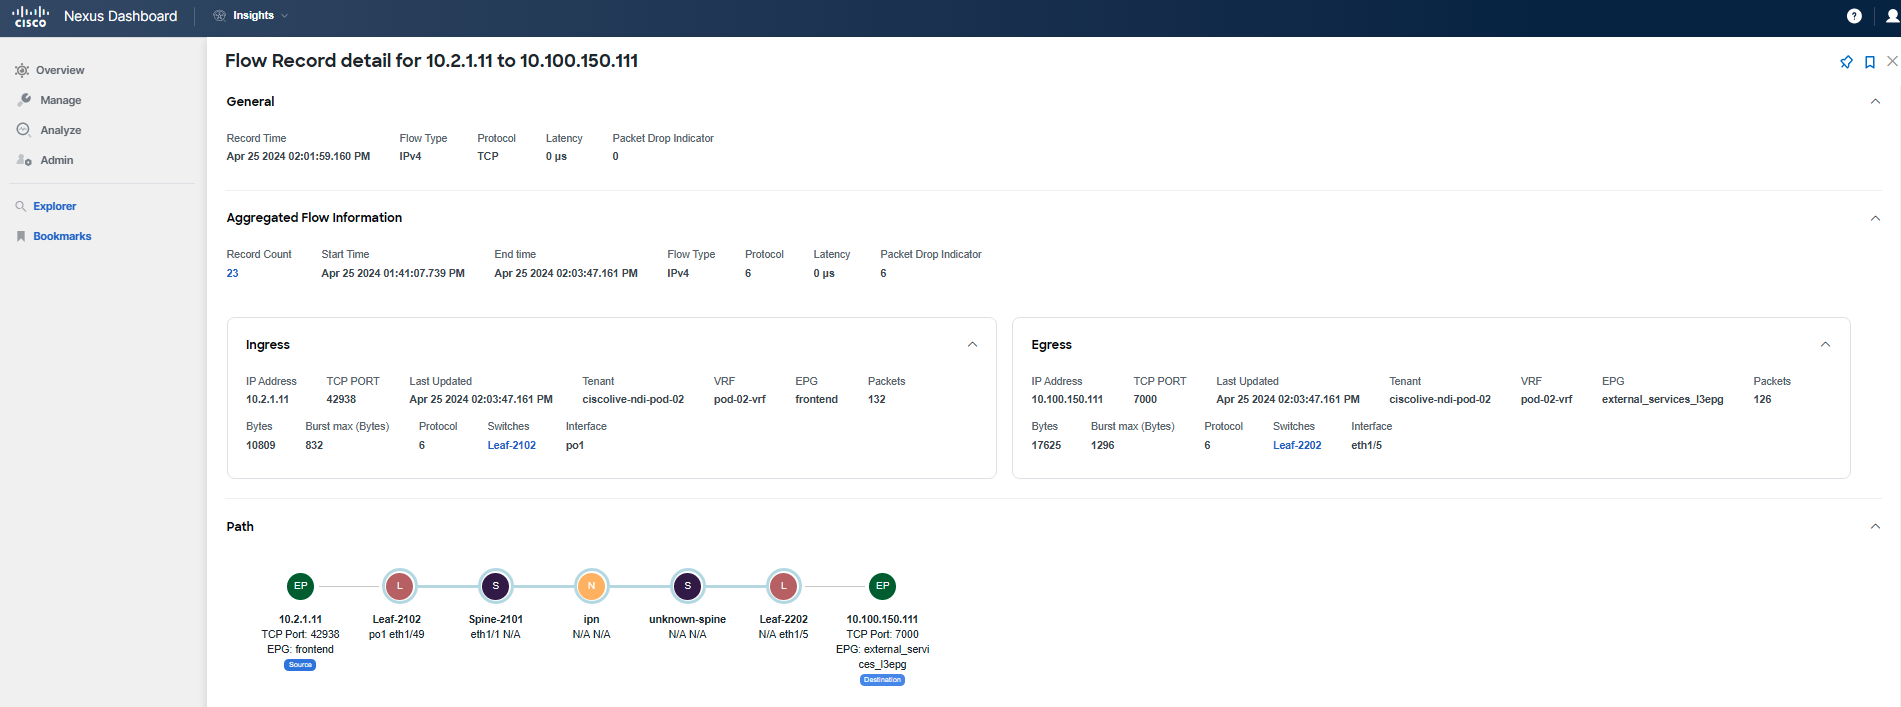
Next, navigate to Connectivity > Flows within the site. You may check the graph to understand the trend, and actually change the view to see, for example, the Anomaly Score or Packet Drop Indicator trending over time for flows. Either select the source/destination IP addresses on the right side next to the graph, or if you don't see your Pod IPs there, scroll down to filter out the communication between the impacted app tiers and pinpoint the forwarding drops in your network. Then review the displayed records by clicking on any of them, or the top one in the table. The flows shown in the table should be marked with a Major anomaly severity.
Note
Use the addressing assigned to your Pod - the "frontend" VM with IP address 10.x.1.11 and the "checkout" VM with IP address 10.x.4.51, where x represents your PodID. You might need to adjust the table settings to get similar table information by pressing the gear icon in the top right corner of the table.
Info
Now is a good opportunity to create a pin to your dashboard, so you can easily return to it and check the status later. Pin it to your Custom Dashboard named according to your POD ID by clicking on the pin icon in the top right corner.
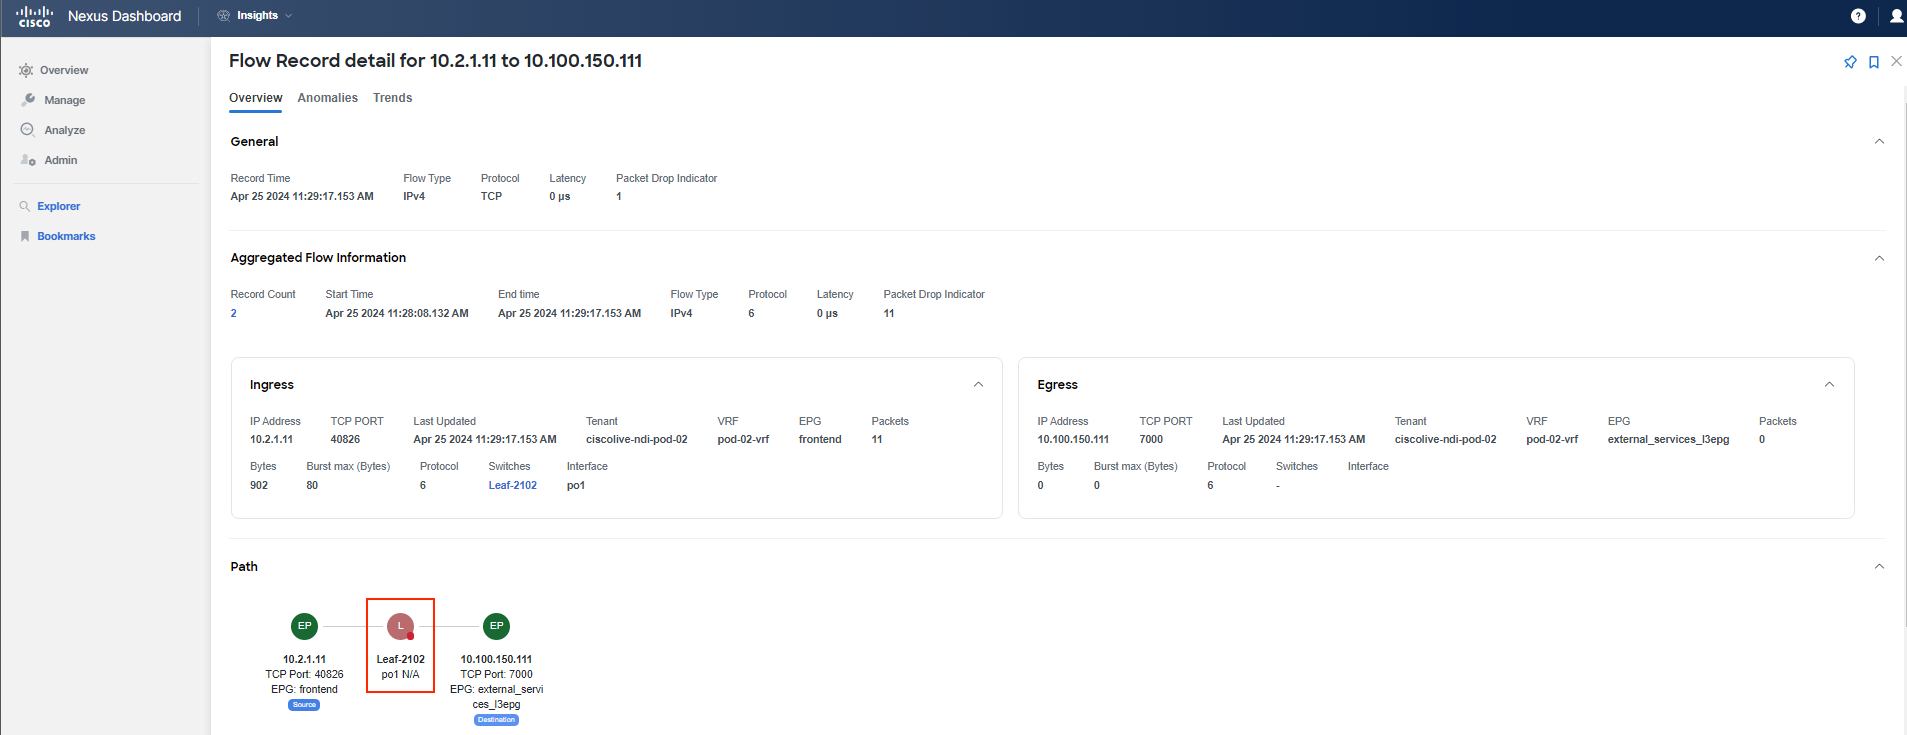
You have confirmed that there is a problem with the communication between the specified application tiers due to forwarding drops. Forwarding drops suggest that there is no available route or path for the packet, resulting in the packet being dropped. The reason and location of the drop can be discerned by hovering over the red dot while reviewing the path of the flow record.
Step 6
To continue your investigation, utilize the feature called Explore to drill down further into the issue.
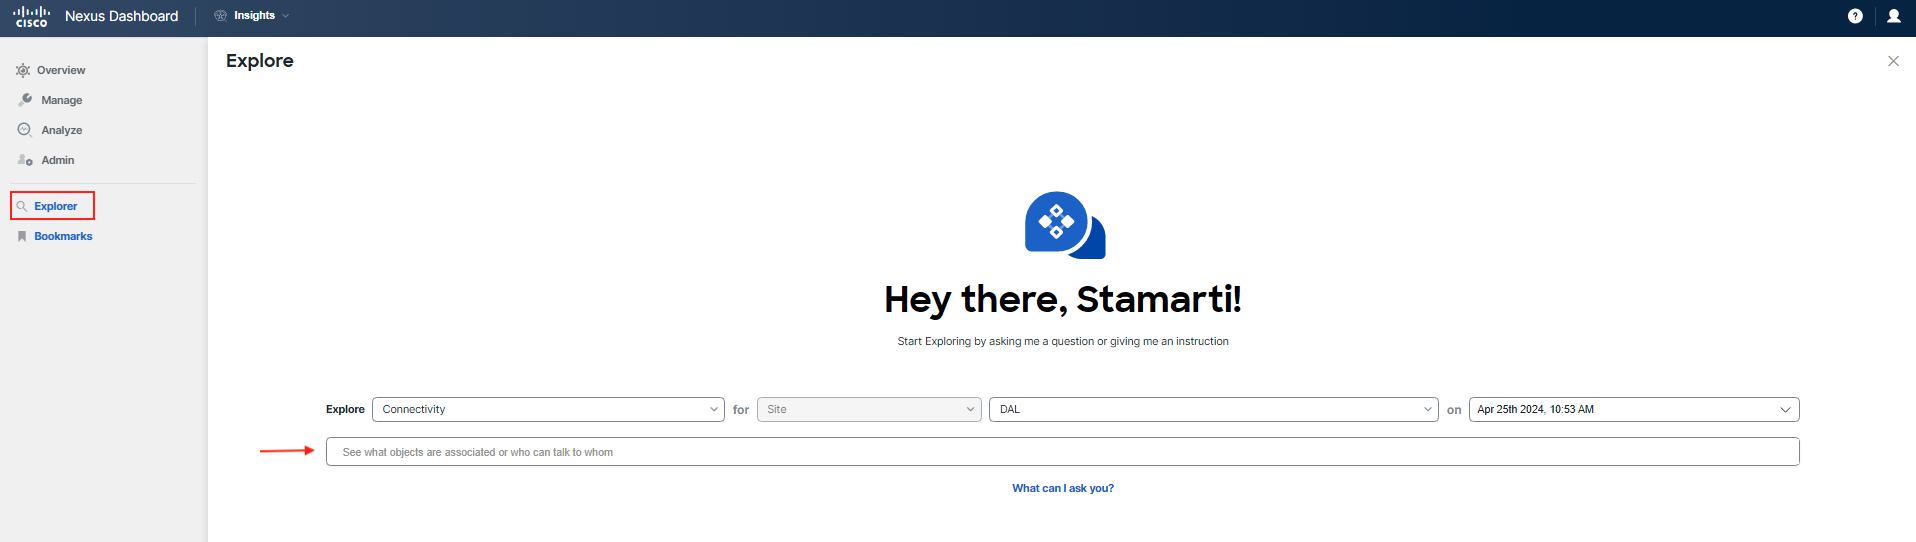
Explore allows network operators to discover assets and their object associations through an intuitive natural language query format. It enables operators to quickly gain visibility into their infrastructure, connectivity, or segmentation between assets, including other related hardware states.
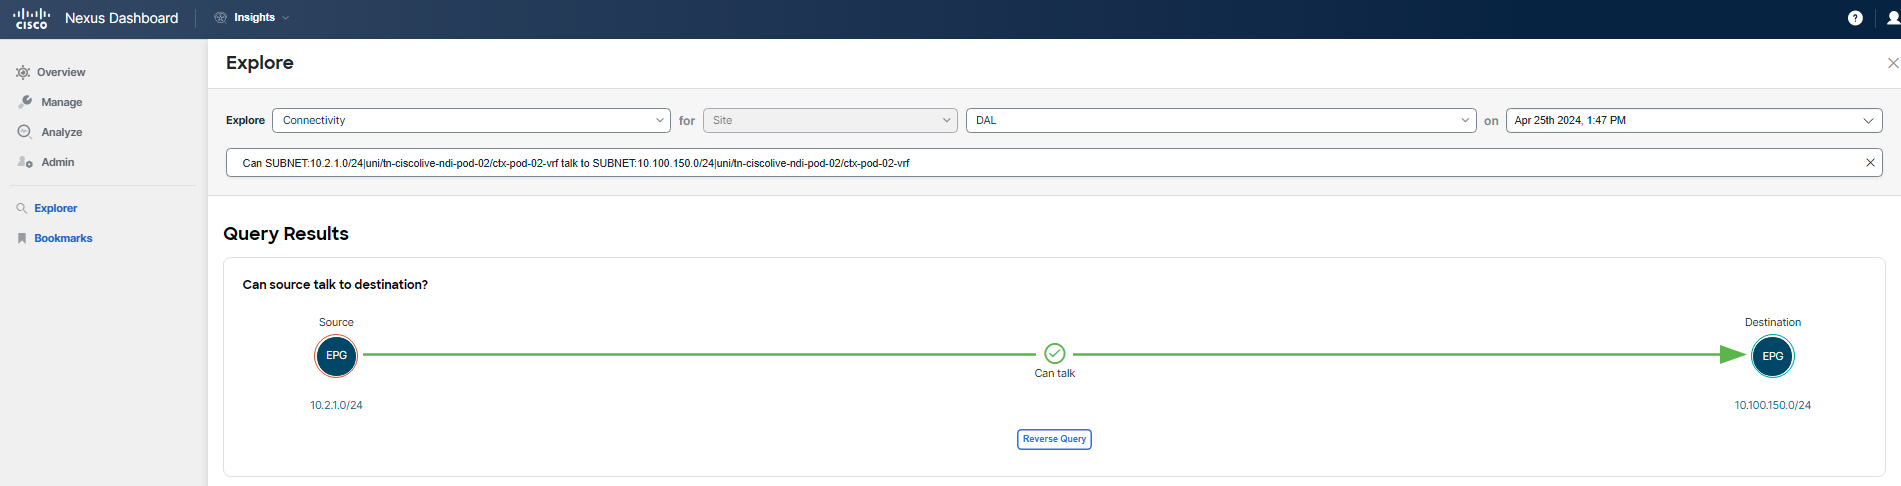
To verify connectivity at the DAL site for the current time/date for the "frontend" tier, use Explore. Since the "currency" tier is hosted outside of ACI, it is accessible via an L3out object in the Tenant.
Run the following query. Be sure to adjust the search parameters to match your POD.
Hint
There's no need to type out the entire query. Use the automated text auto-filling feature. You can filter based on subnets for the app tiers or use the EPG names, like epg-frontend to the External EPG instP-external_services_l3epg. Begin by typing in your tenant's name or subnet.
For example (using pod-02 as reference): Can SUBNET:10.2.1.0/24|uni/tn-ciscolive-ndi-pod-02/ctx-pod-02-vrf talk to SUBNET:10.100.150.0/24|uni/tn-ciscolive-ndi-pod-02/ctx-pod-02-vrf
Please use only the pod numbering you are assigned to for your query, pod-02 is just used as an example.
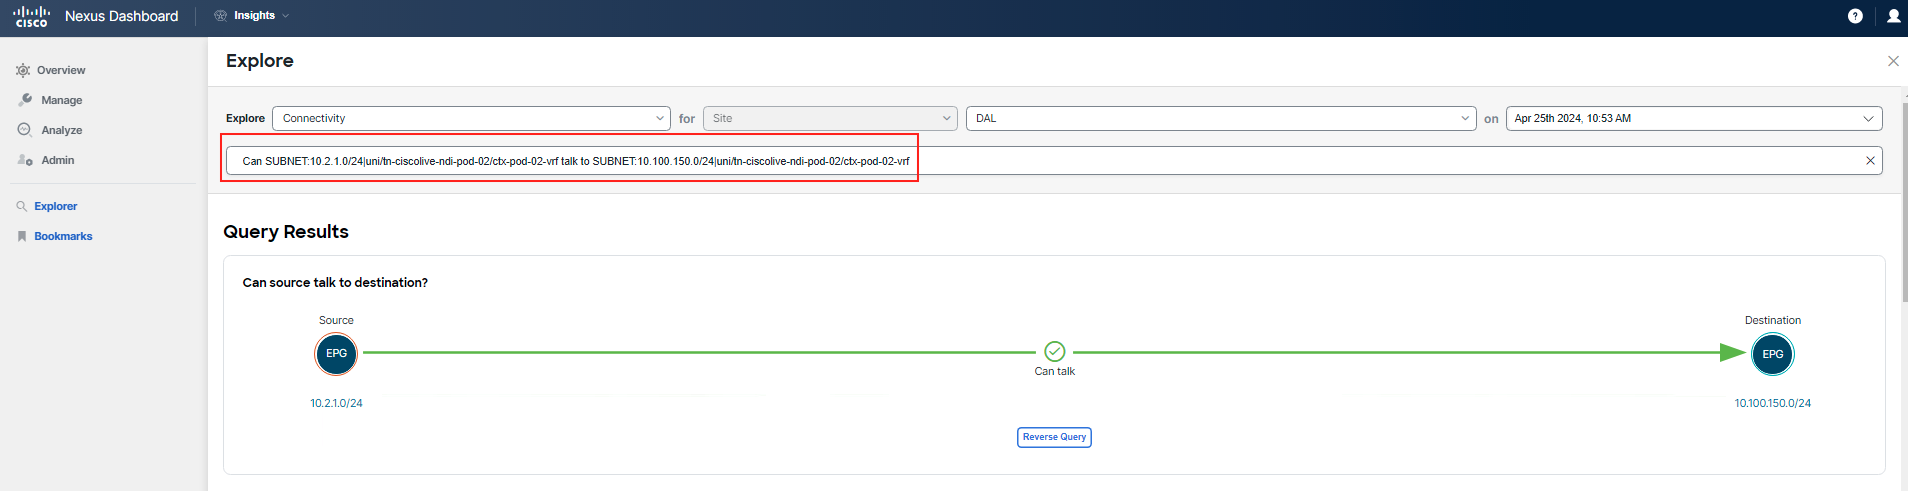
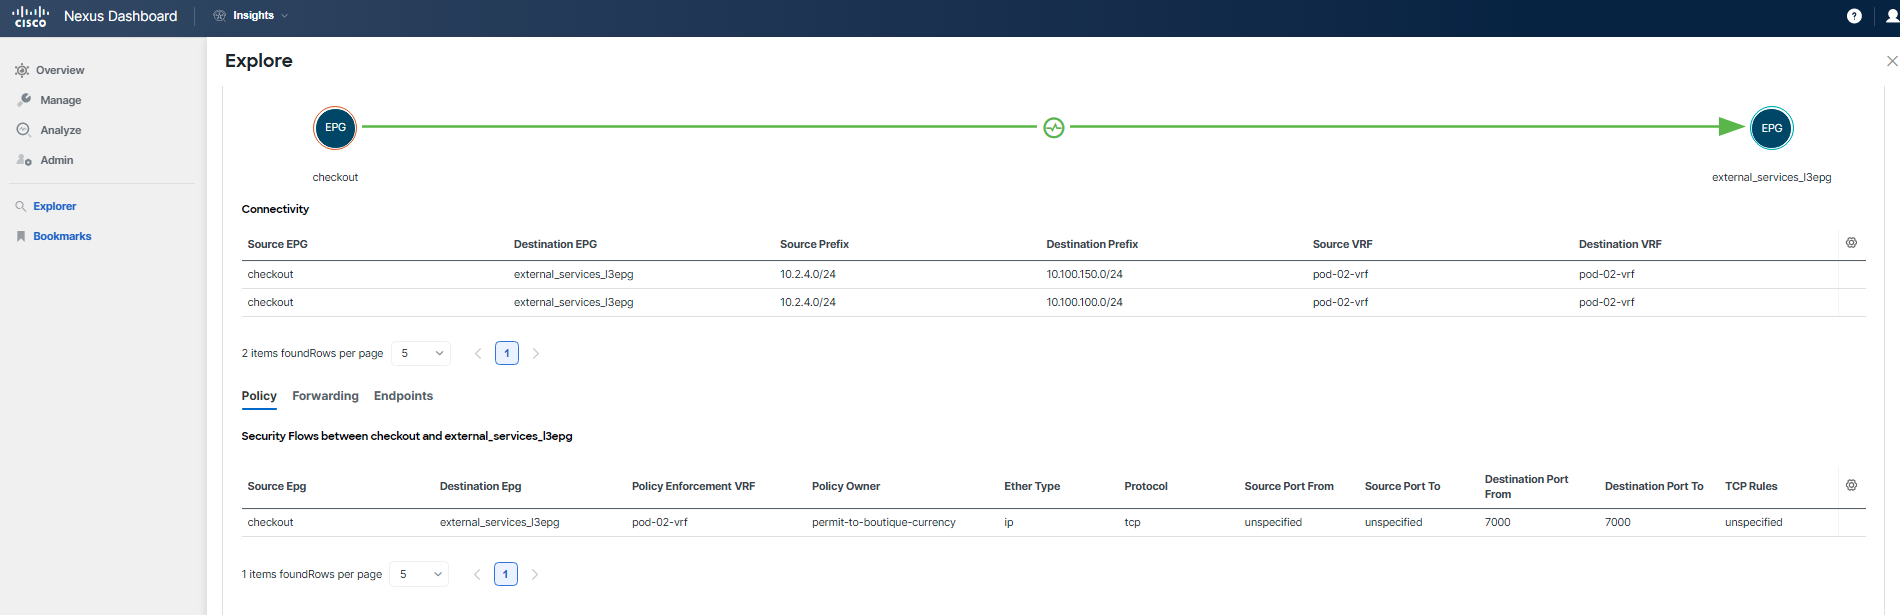
You can see that "frontend" EPG/tier and it's subnet can talk to L3out. You already know, this is not a policy issue.
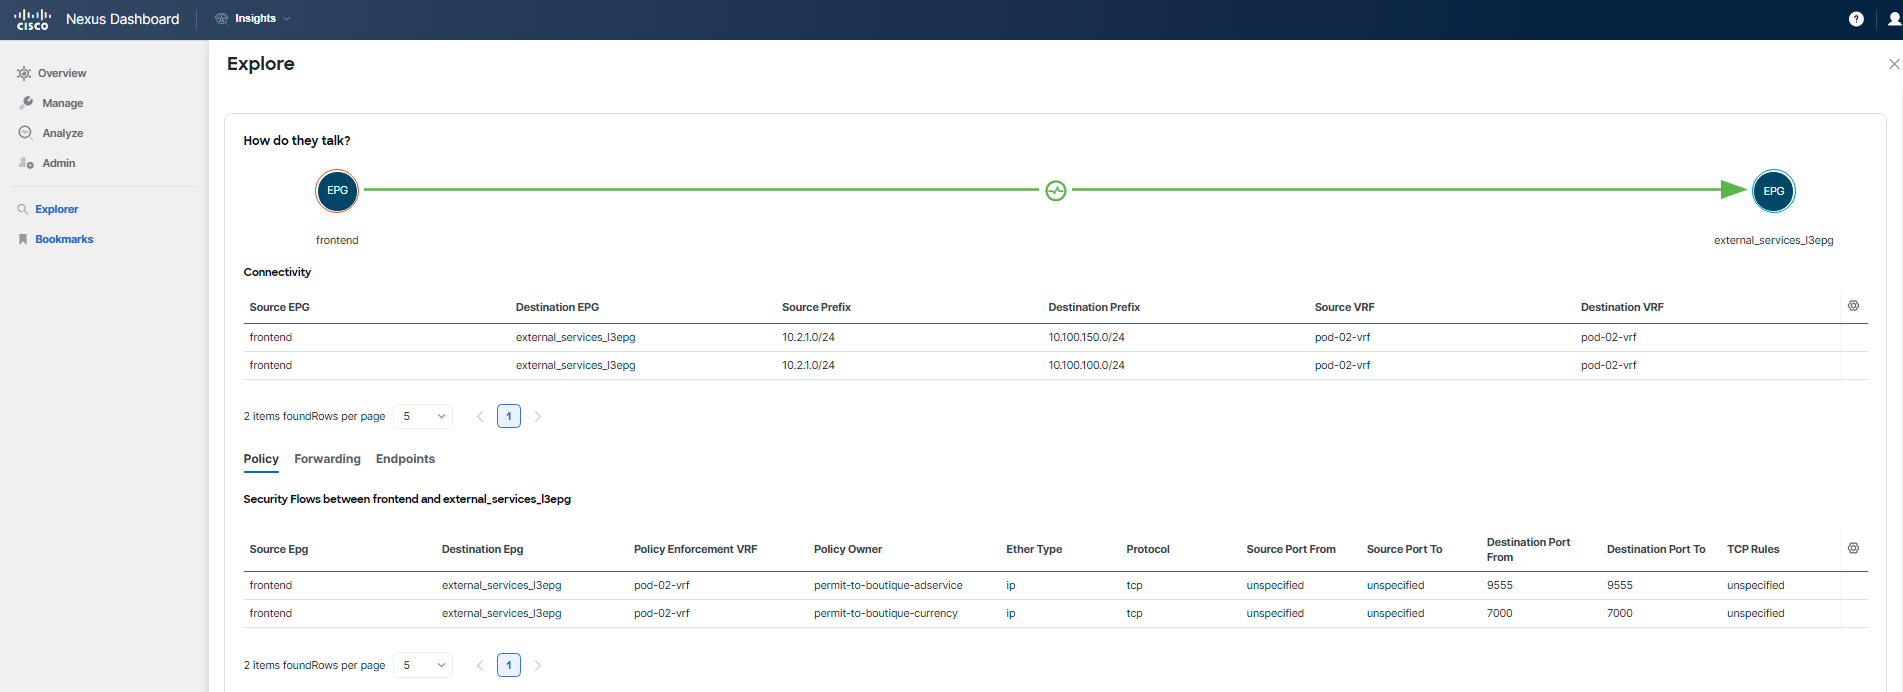
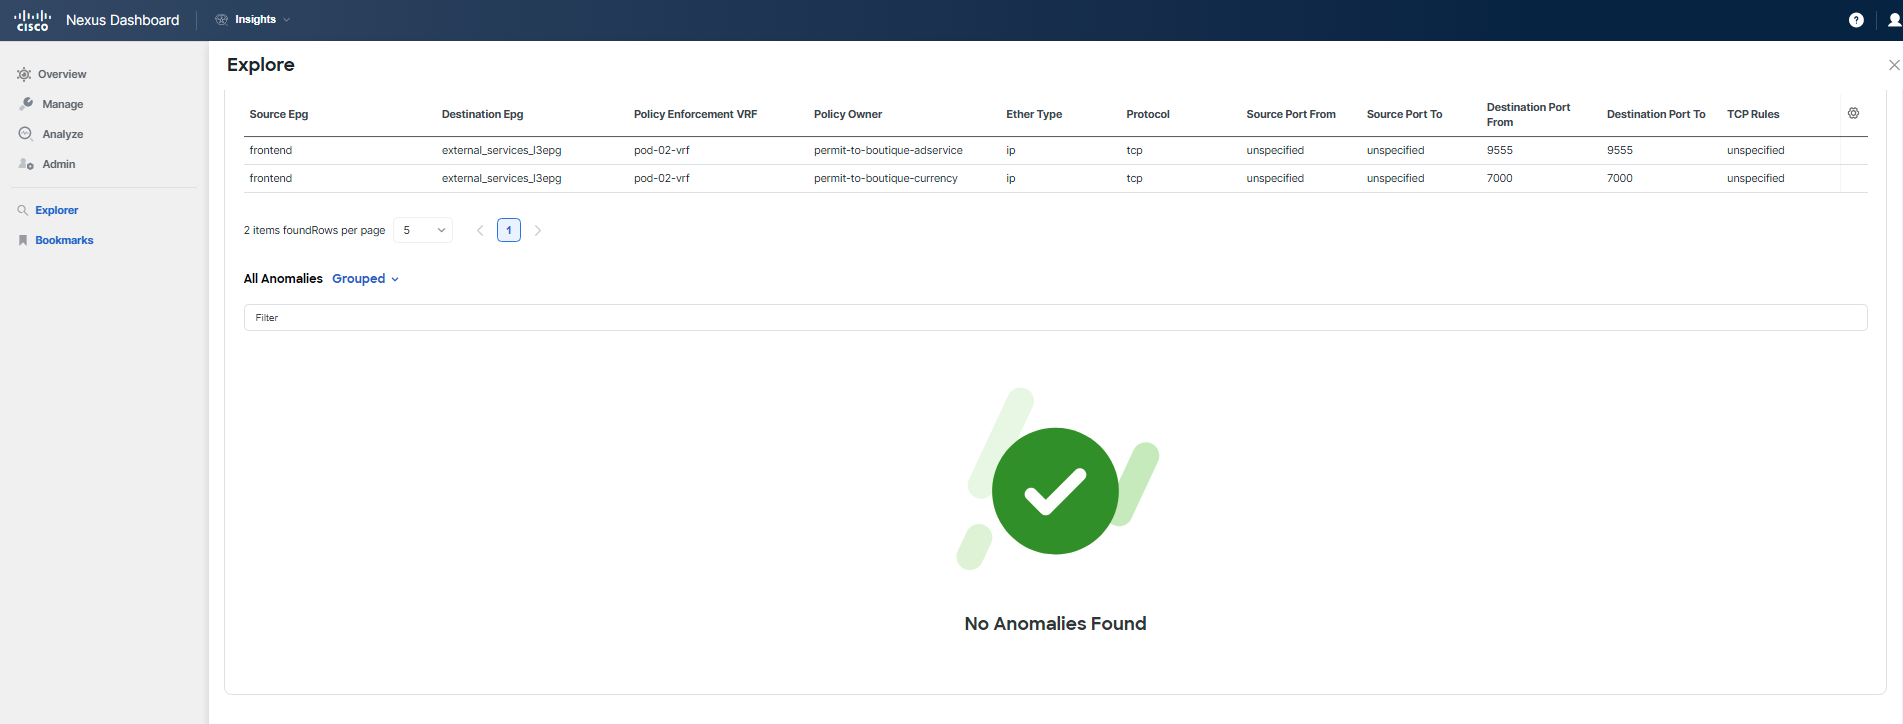
After inputting your query into Explore, scroll down to the section that answers the question, How do they talk. Here, you will see confirmation that the necessary communication is allowed. To verify this information, cross-check with the application topology and ports table available in the Application Topology section. Additionally, note that there are no anomalies related to the policy for this communication.
Step 7
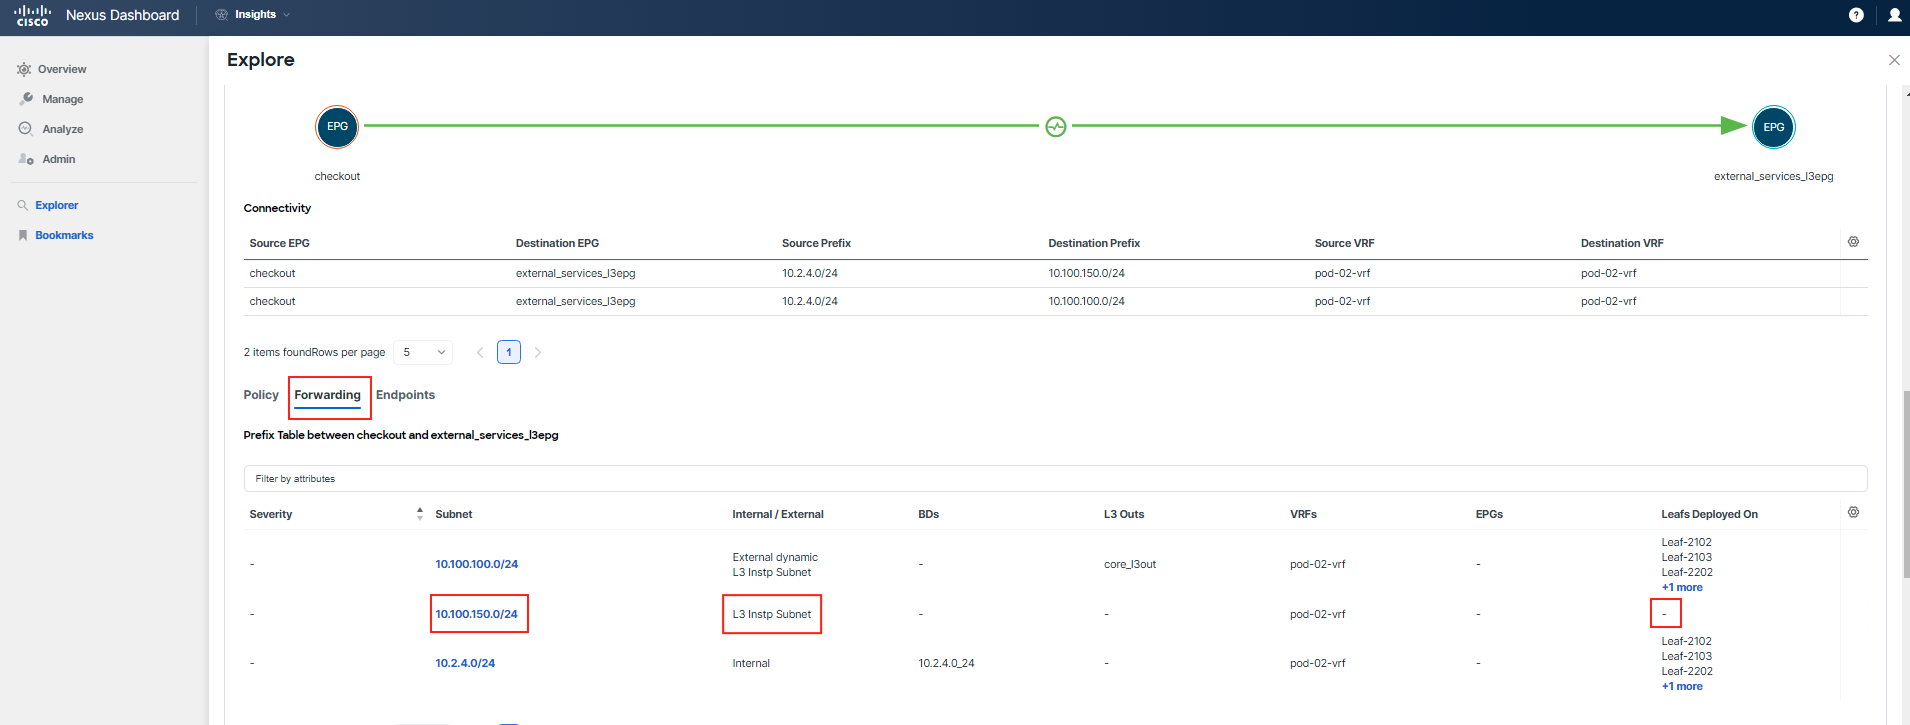
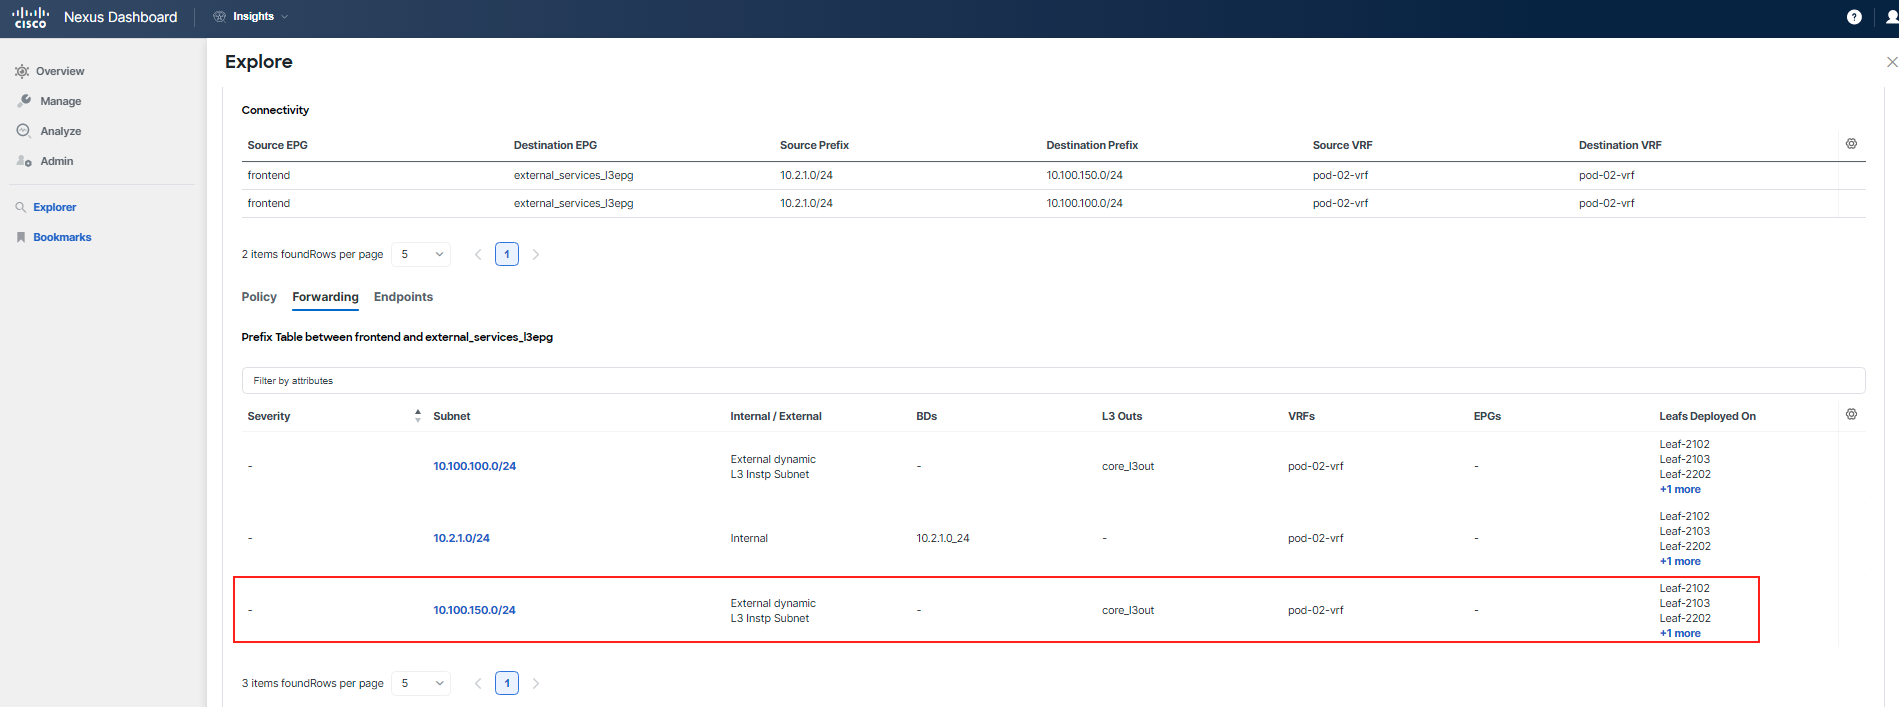
Proceed to examine the Forwarding tab for this communication. Pay particular attention to the entries for 10.100.100.0/24, which is the subnet used by the "adservice", and 10.100.150.0/24, the subnet used by "currency". Compare these entries to see if you can spot any differences.
Note
The "adservice" and "currency" are shared services deployed behind an l3out, meaning all participants can reference these subnets. They are not unique to each POD, so the information you find here applies across the board.
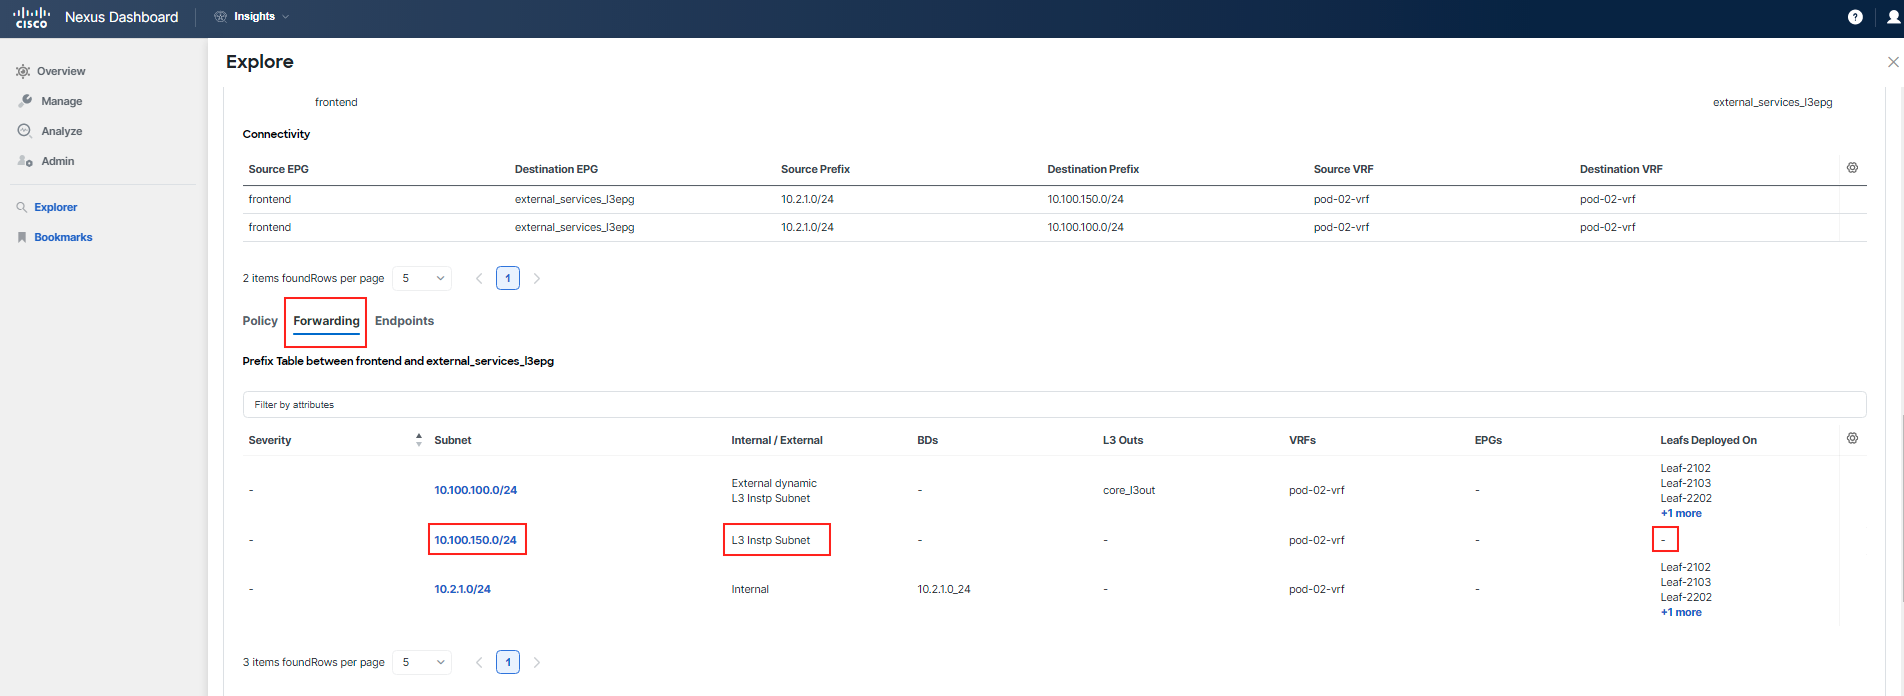
You've identified that there is a problem with forwarding for the subnet 10.100.150.0/24, which is used by the "currency" tier. This subnet is not known by any switch and has not been learned. Additionally, the absence of the External dynamic flag indicates that the subnet is indeed not being learned.
Step 8
Now, run a similar query for the "checkout" tier and use Explore to provide you with answers regarding its connectivity and forwarding status.

Step 9
You're now looking to compare policies between the current state and the period before the maintenance window when some ACI configuration changes were made, as mentioned at the start of this use-case. To accomplish this, you will utilize the Delta Analysis feature.
Note
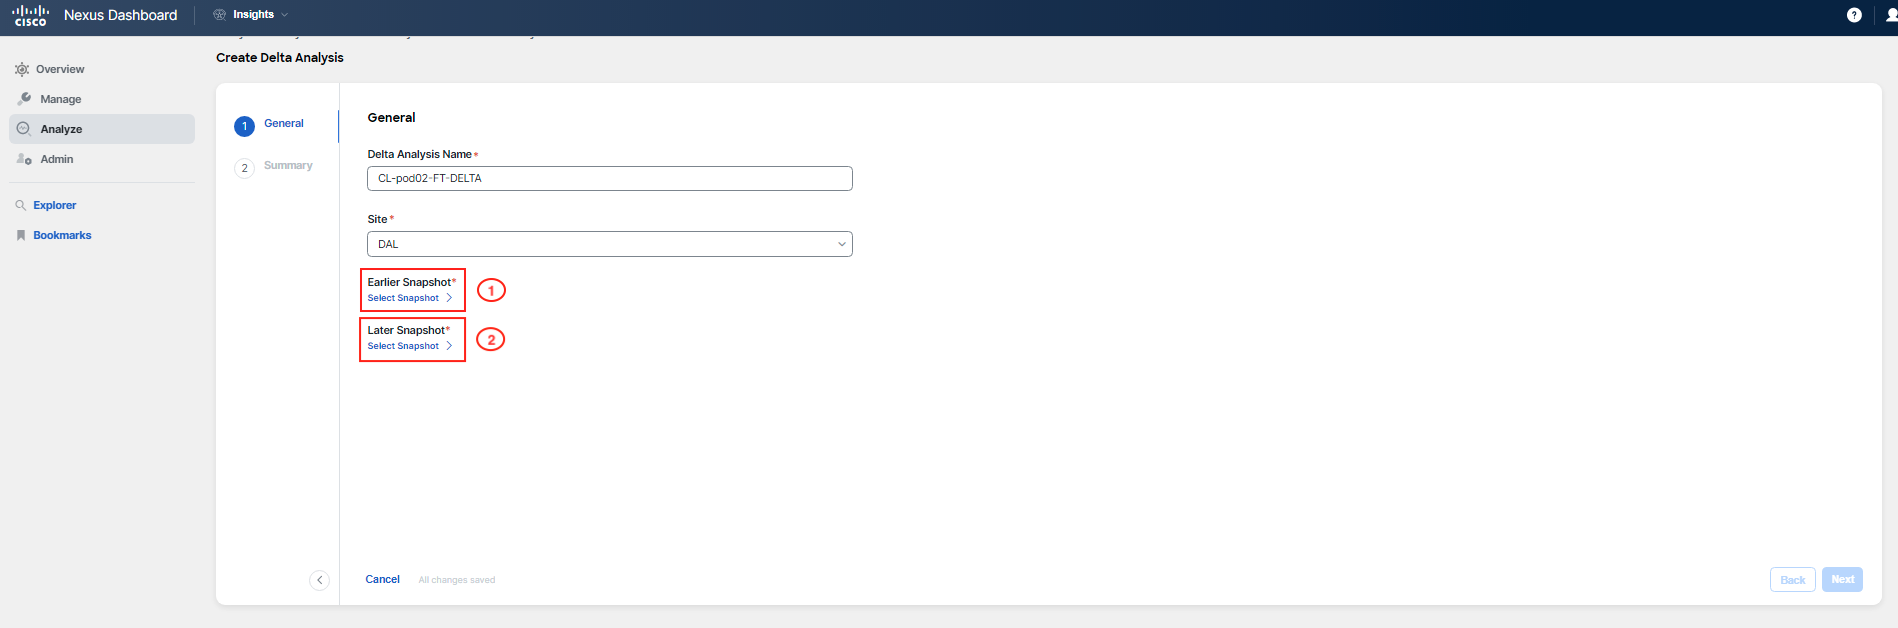
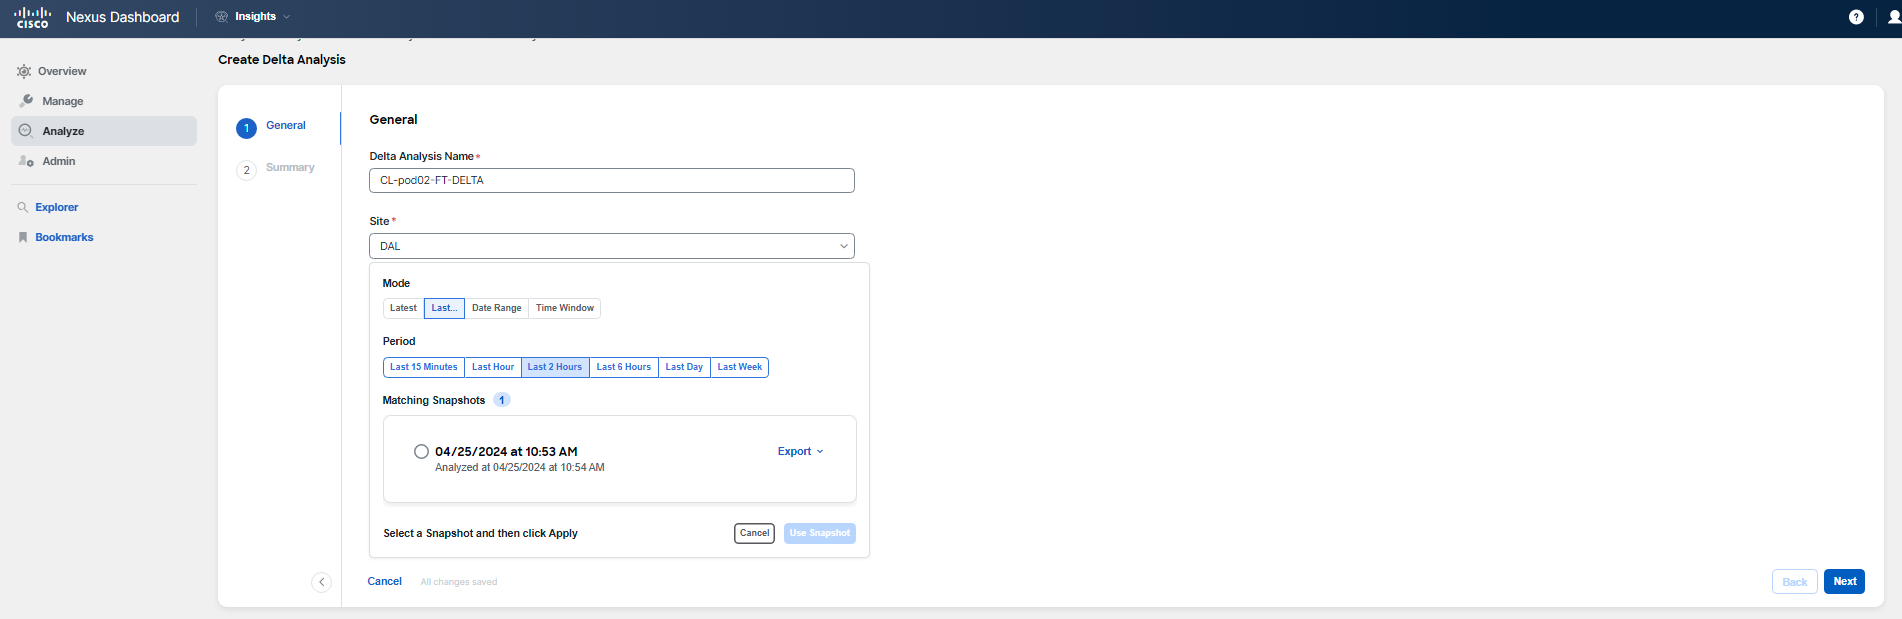
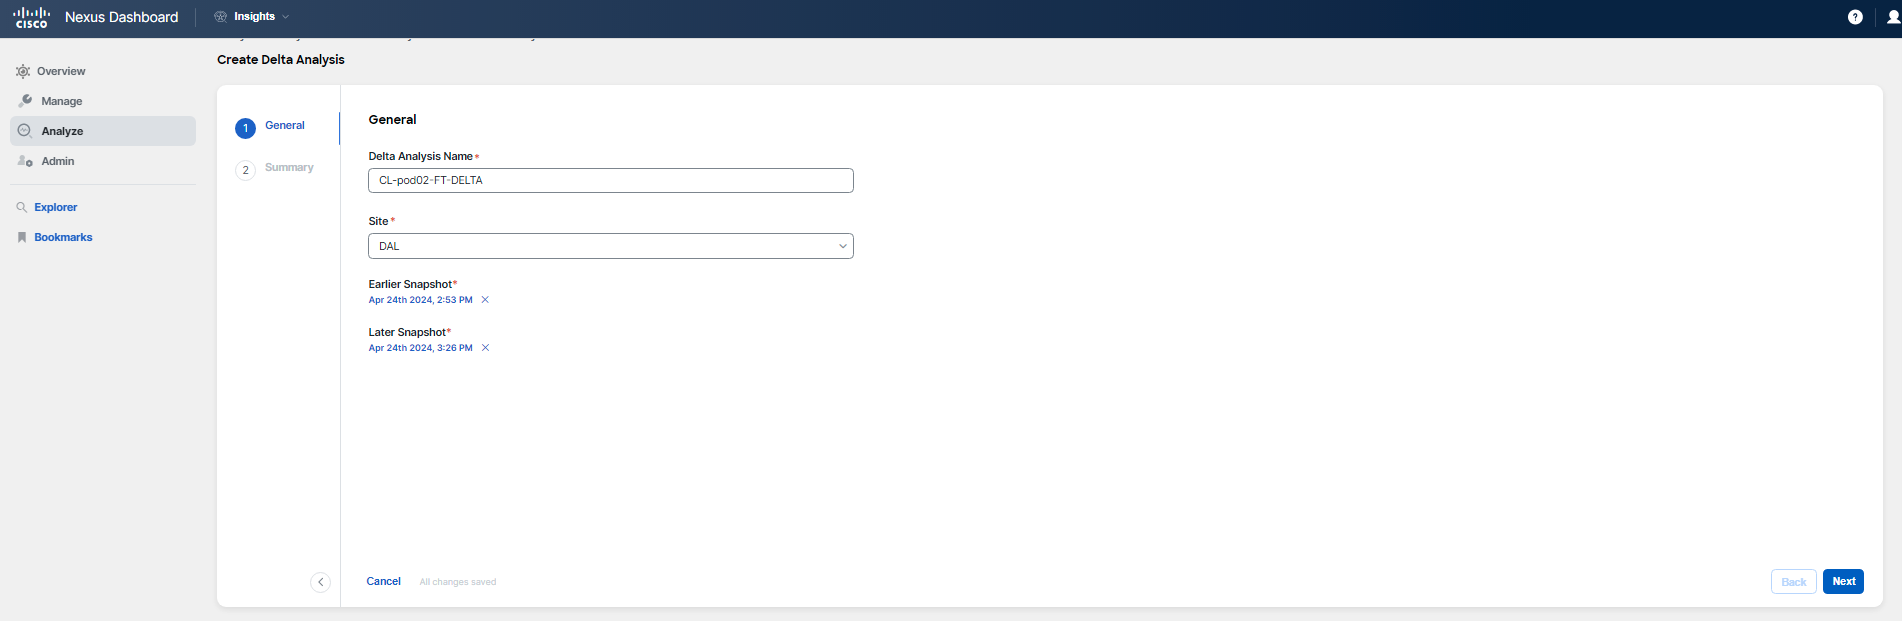
Recall the maintenance window details provided in the scenario description. Use the screenshots provided as a guide for creating a Delta Analysis, but do not use the dates and times shown as they are only for illustration. The maintenance window started on June 4th at 10:00 PM PT (June 5th 5:00 AM UTC) and lasting approximately 3 hours. To create your delta comparison, select a snapshot with timestamp June 4 10:03 pm PT (June 5, 5:03am UTC) to capture the state of the fabric prior to the maintenance activities. For the post-maintenance comparison, choose either a snapshot from the morning hours following the maintenance or the latest one available.
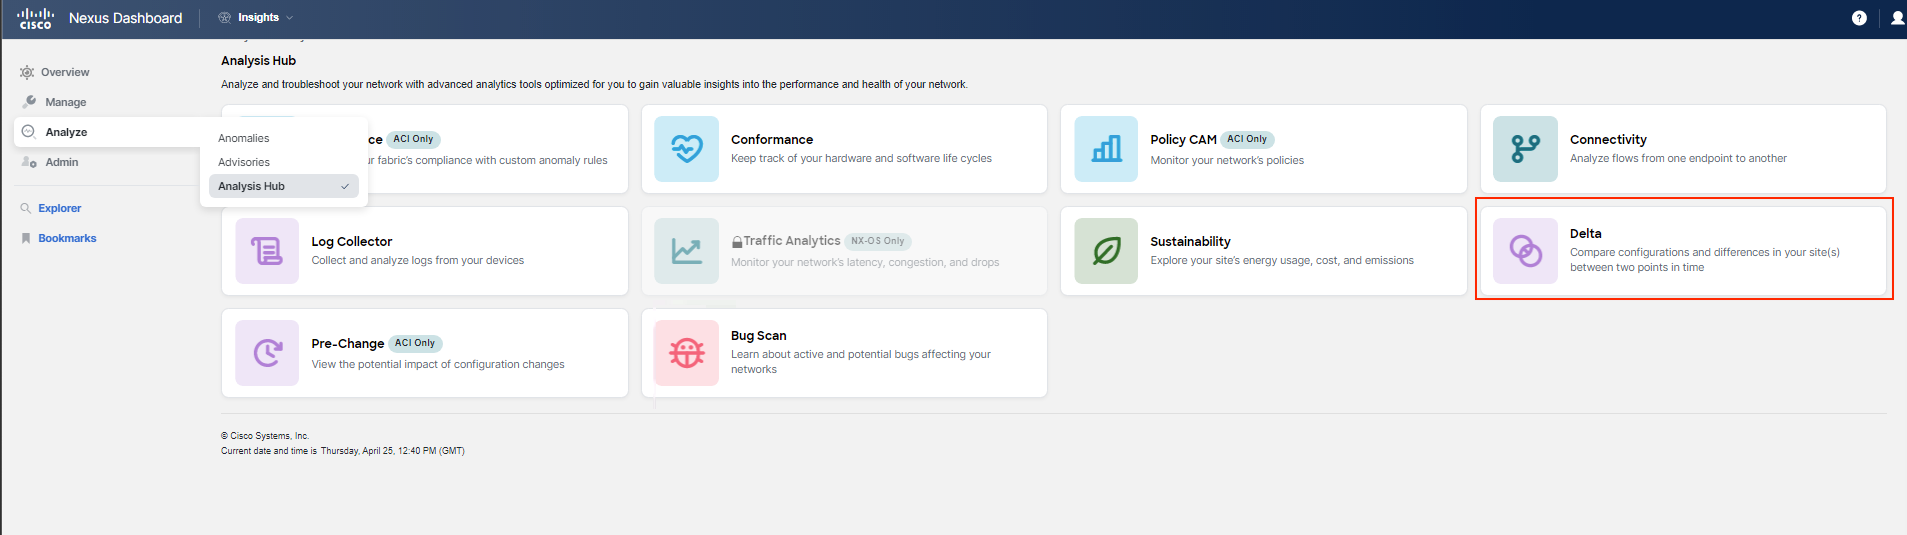
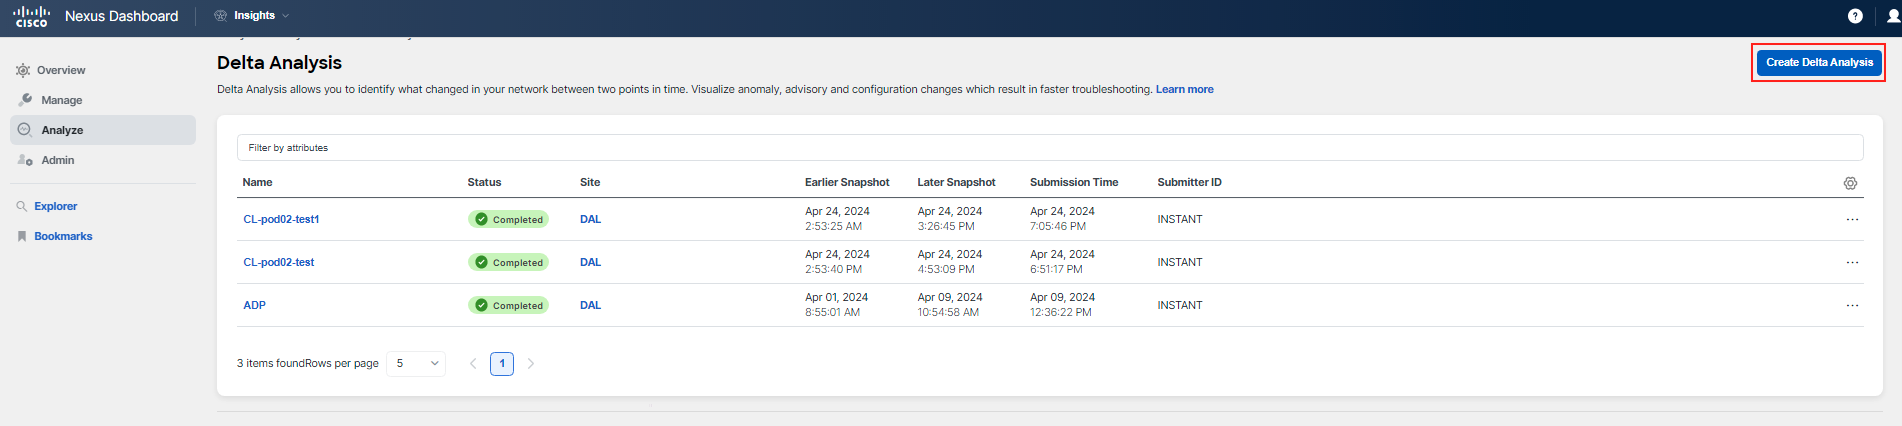
Begin by navigating to Analysis Hub > Delta Analysis, and proceed to create the analysis.
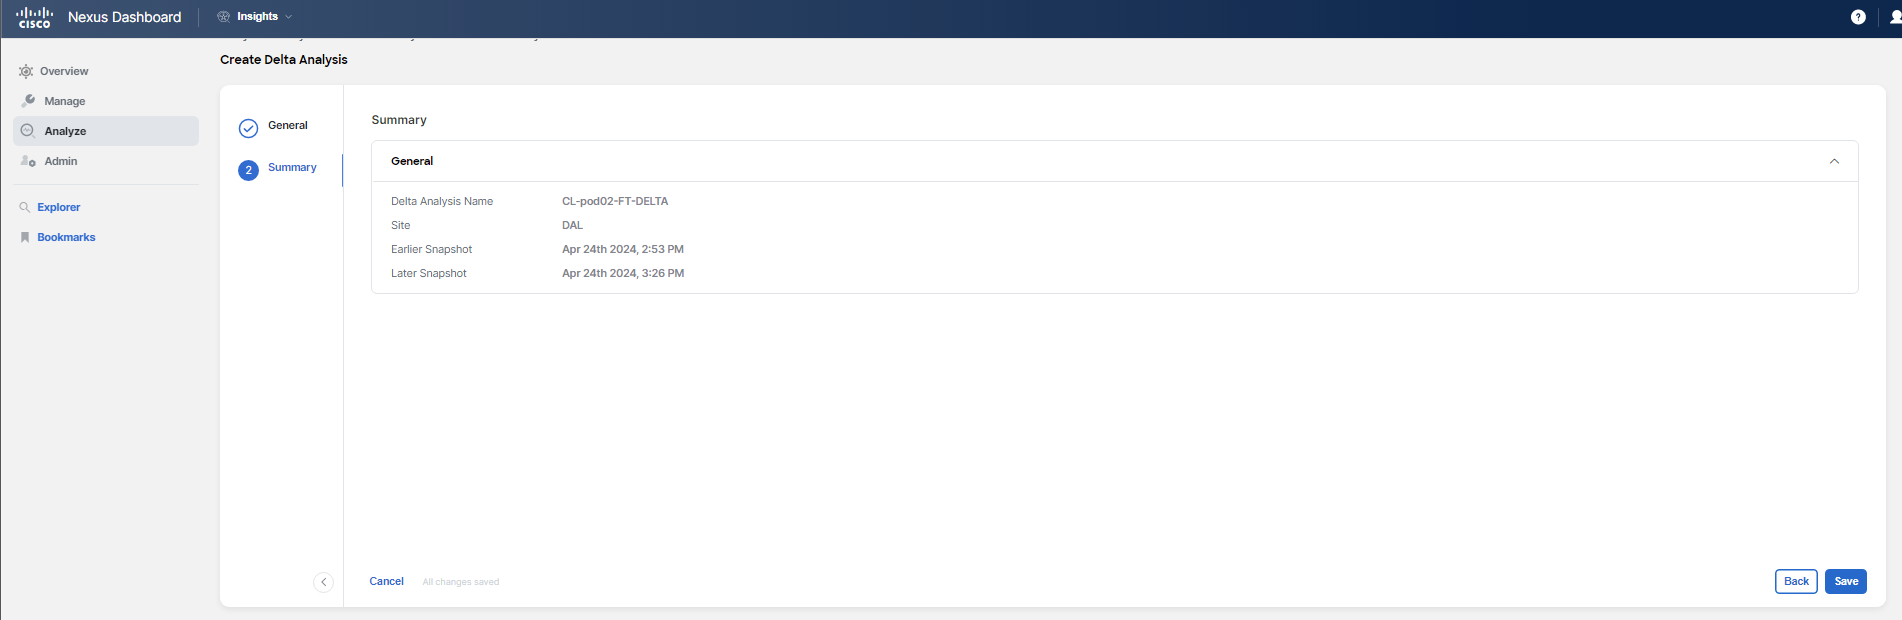
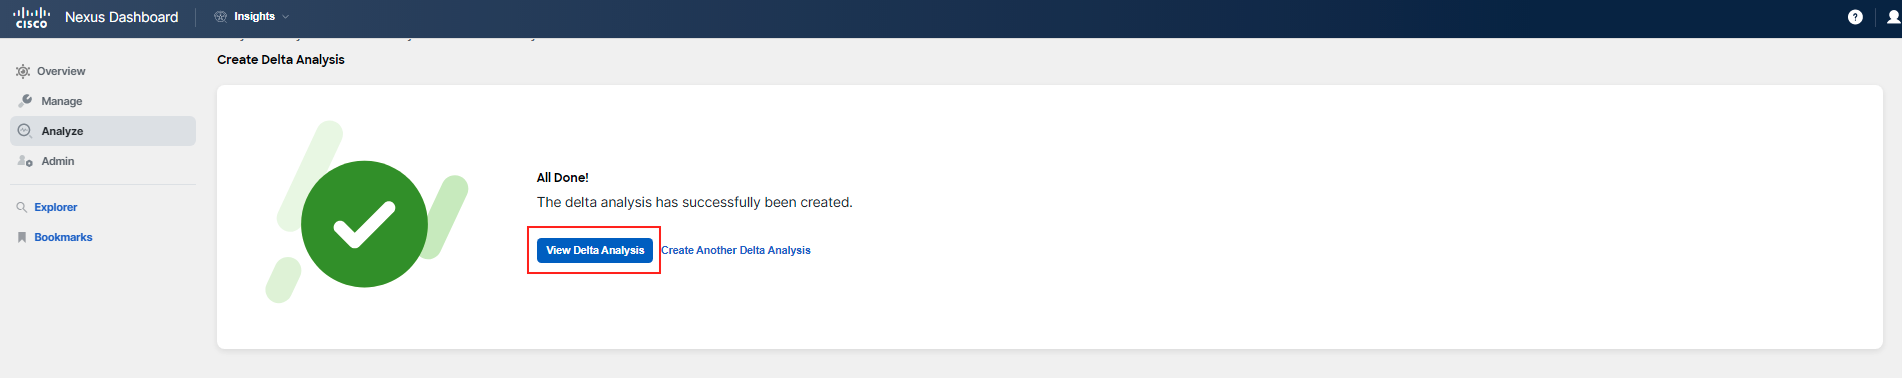

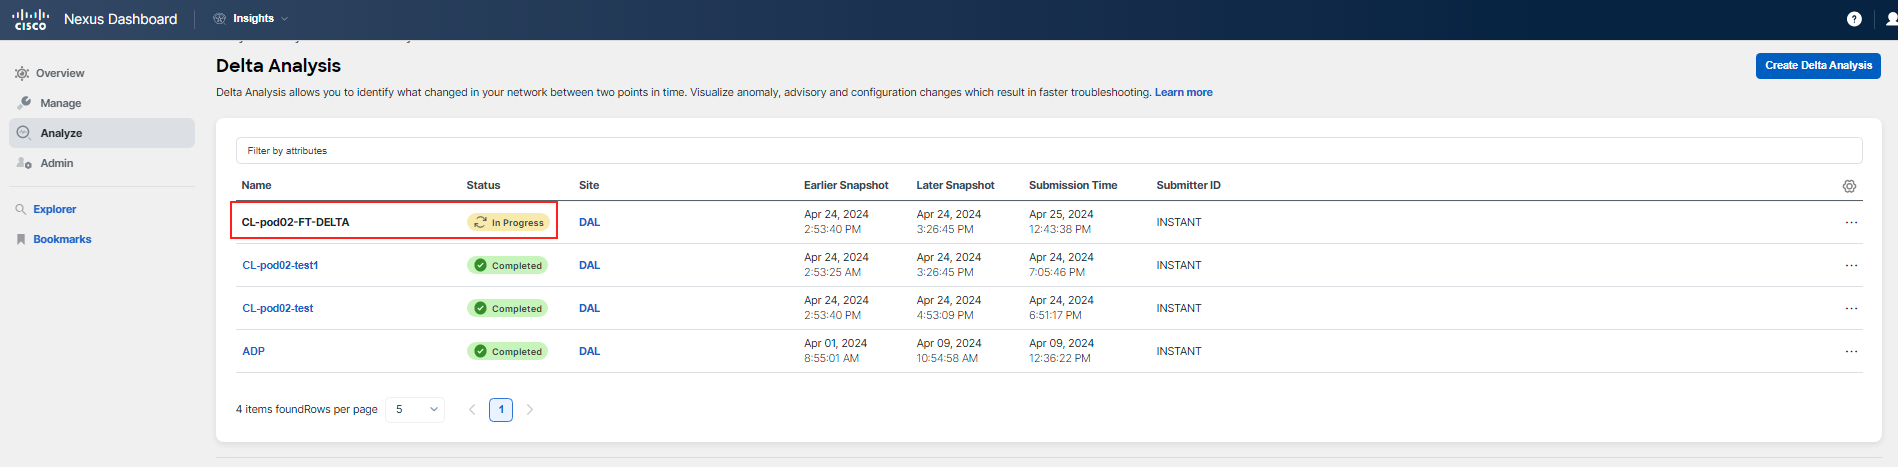
Step 10
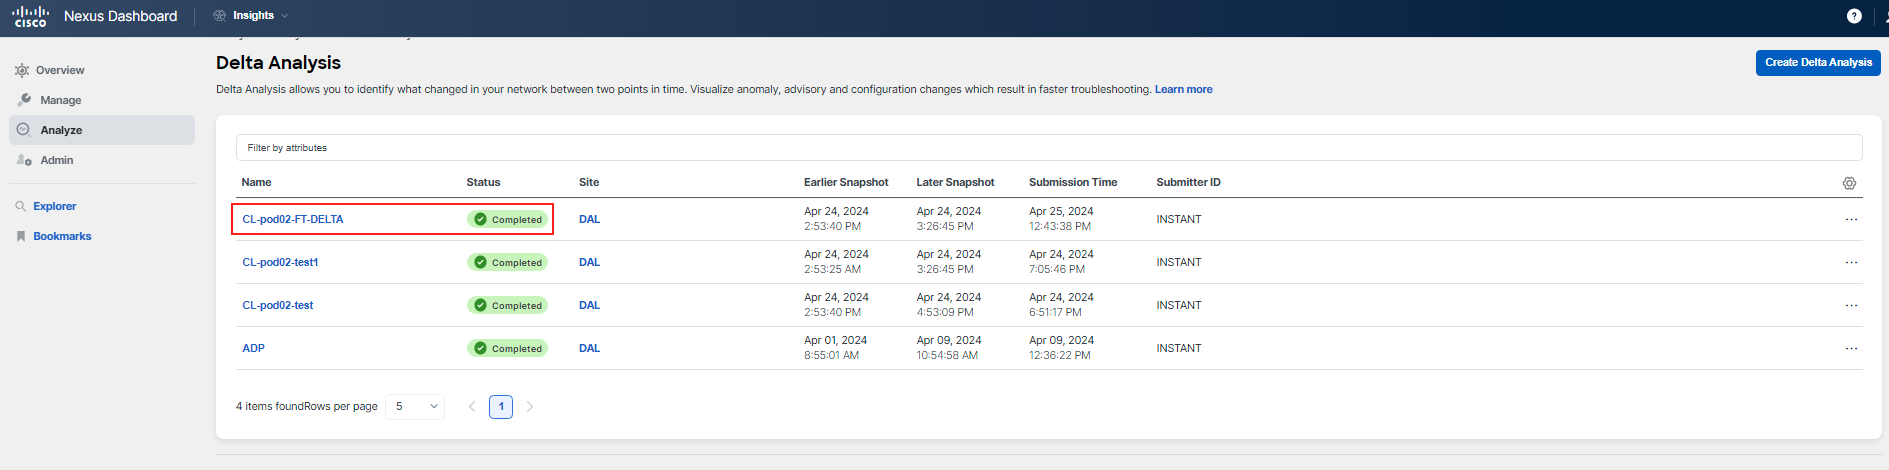
It should take a few minutes to have the analysis ready (this could also depend on system load). Click on the name when the status is Completed to analyze the comparison.
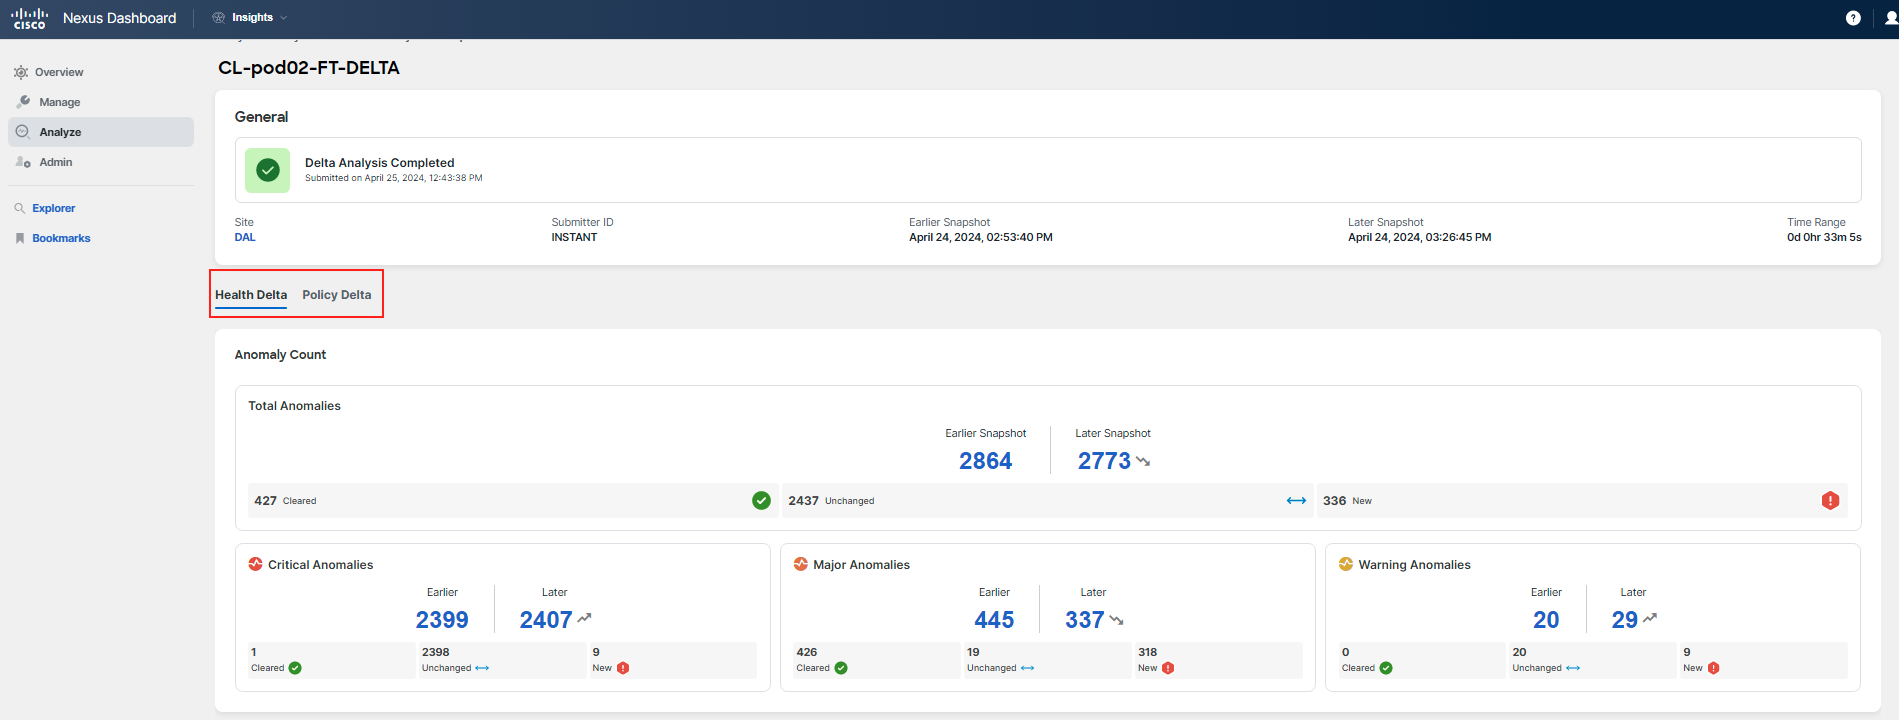
There are two tabs: Health Delta and Policy Delta. You should not see any relevant health delta information for this use case, because the change does not trigger an anomaly. Feel free to review the health delta if you wish.
Note
You could use Compliance to define rules for this case. You will not do so as part of this use case, but you will learn more about Compliance in a dedicated use case. In your environment, you could define a Compliance rule to monitor the root cause of this problem.
Click on the Policy Delta tab to understand the configuration differences. Review the changes for your particular tenant. There are three color codings: red indicates that the highlighted text was deleted, orange indicates that the highlighted text was changed, and green indicates that the highlighted text was added.
Hint
In the policy viewer filter, you can start typing "10.100.100" and then "10.100.150 subnet" to identify the issue faster.
It might be a bit difficult to precisely identify which configuration is related to your PodID as this is replicated across all of them. Therefore, refer to the following screenshots to understand the changes made yesterday.
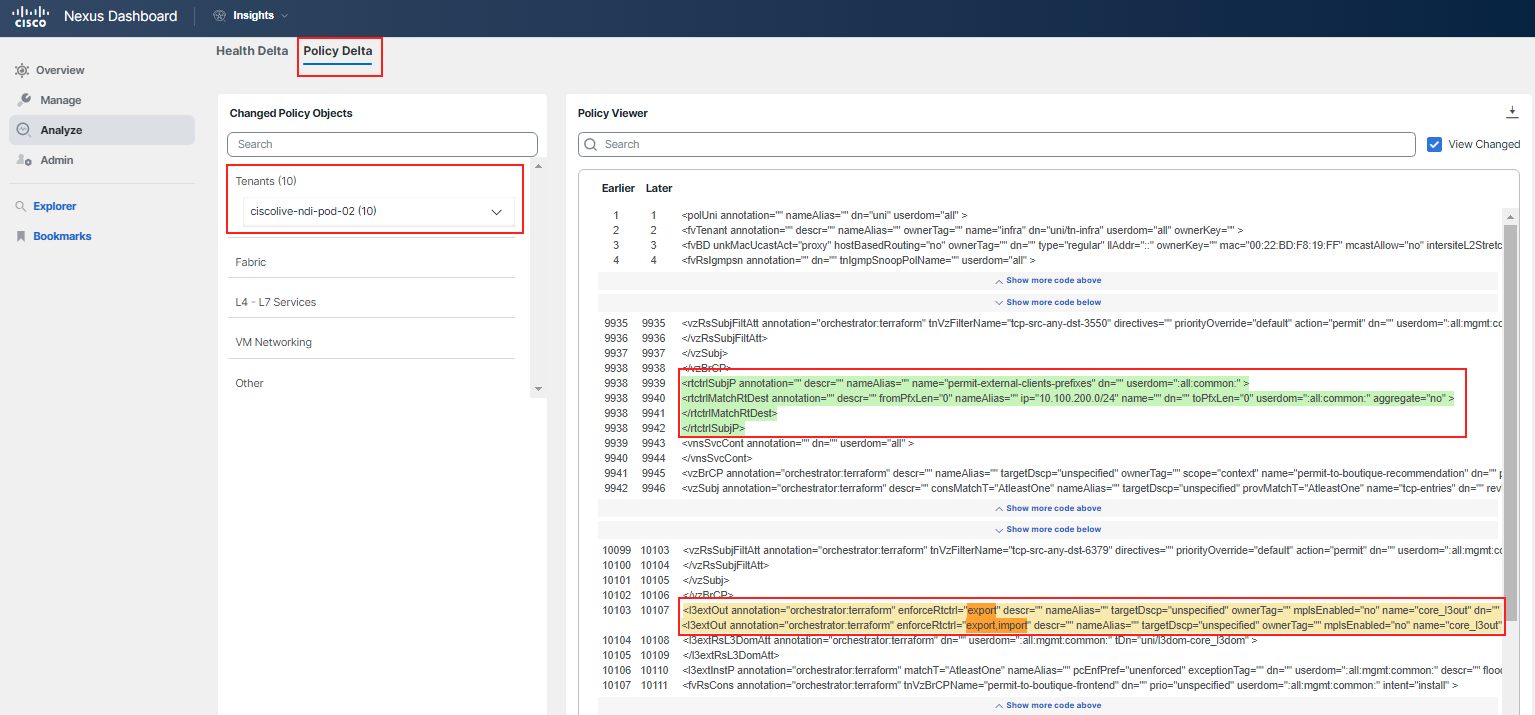
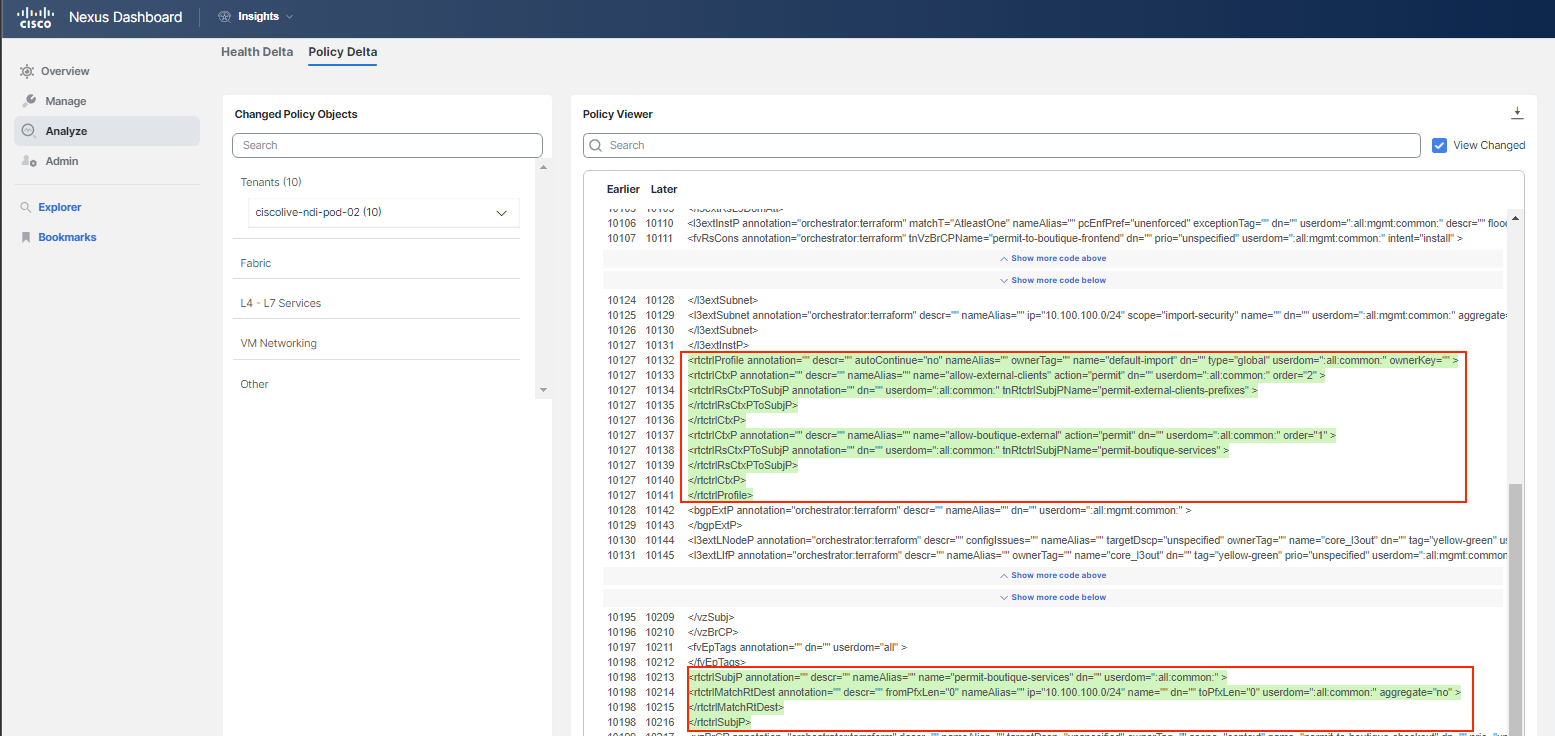
Thanks to Delta Analysis, you discovered that the route control enforcement for L3out was changed and an import route map was configured with subnets, while the subnet 10.100.150.0/24 belonging to the "currency" tier was omitted, causing the communication to fail.
Step 11
You have verified what's going on and which objects or application tiers are impacted. To reiterate:
- The contract is in place and is allowing communication - verified by Explore.
- This is a forwarding problem; there are forwarding drops - verified by Explore and Flow drops / Flow event drops.
- What exactly caused the communication to stop working - verified by Delta Analysis.
Therefore, you navigate to the APIC, to your tenant, and check the particular L3out. This is the logical place to check thanks to the troubleshooting done in Nexus Dashboard Insights.
Fixing the Issue
Step 12
Open the DAL APIC and check the L3out configuration of your tenant. Before you continue looking at the screenshots, try to review all parts under the L3out parent object to find the problem yourself, and think about how long it would take you to discover the missing subnet without Delta Analysis or Explore.
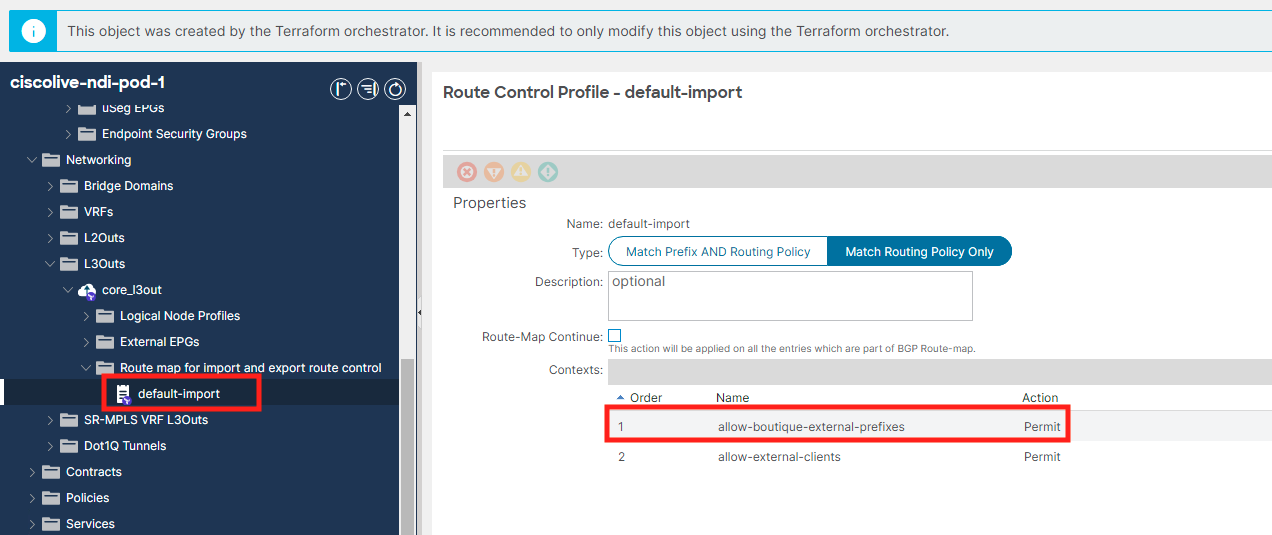
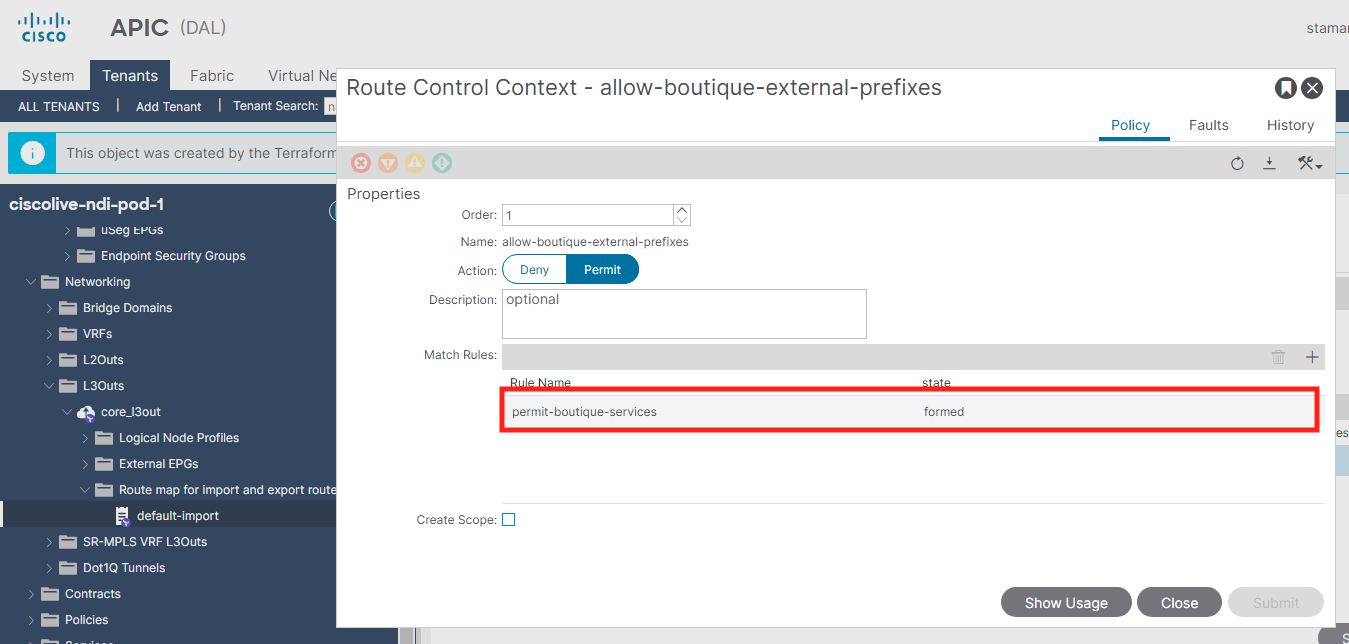
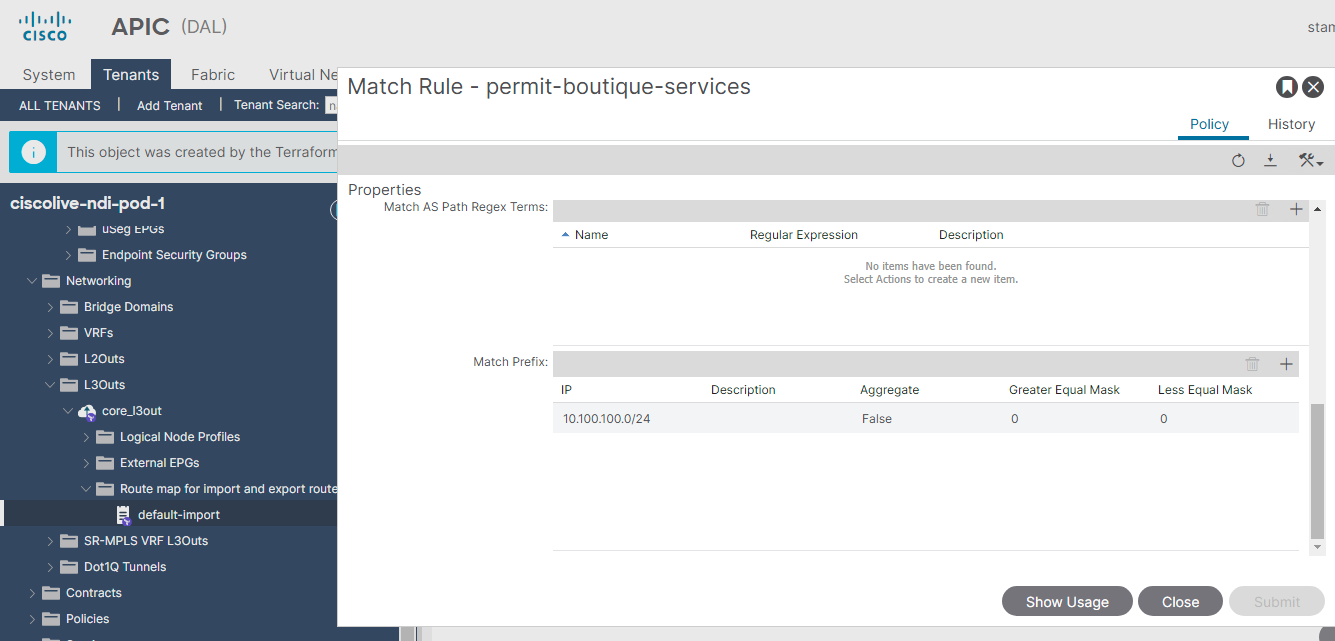
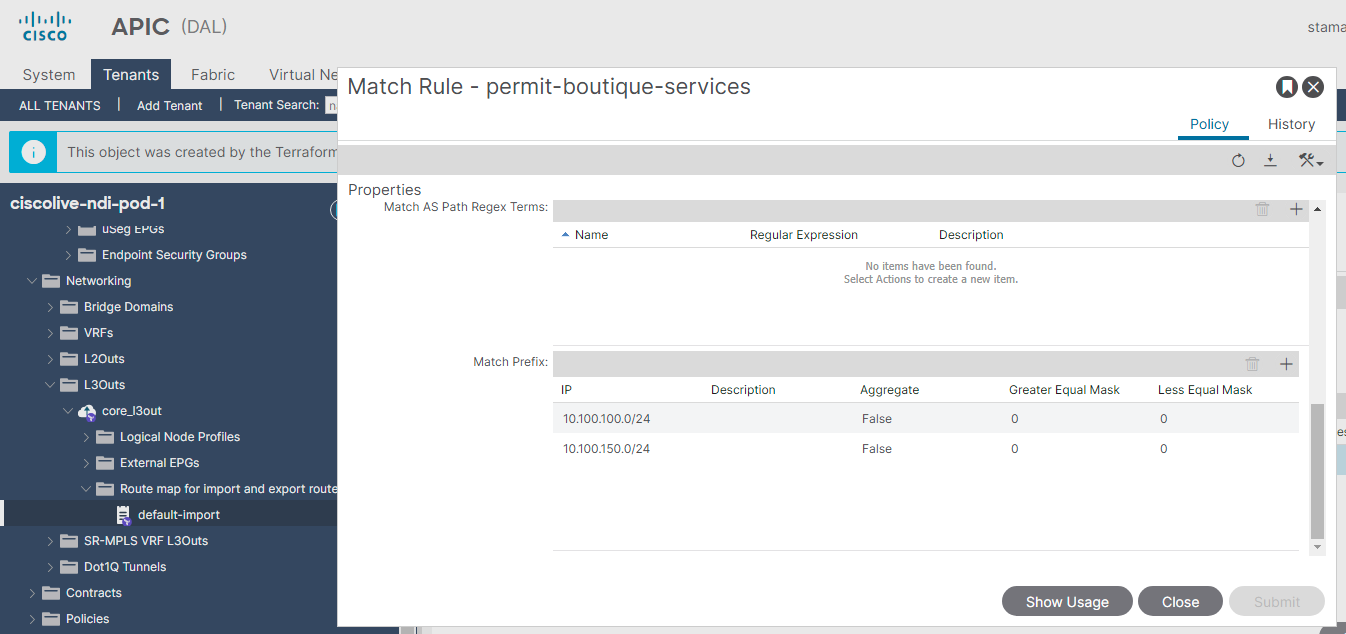
As you discovered one of the subnets is missing on the import route-map. You should add the subnet to the route-map to remediate the problem - add subnet 10.100.150.0/24 used by "currency" tier. Please note the time of this action. You will need it later.
Step 13
You go back to Nexus Dashboard Insights. Allow approximately 5 minutes for new flows to start reflecting the remediation in APIC. Navigate to Manage > Sites > DAL > Connectivity > Flows. You will confirm that the issue was remediated by checking the Anomaly Score or Packet Drop Indicator graphs for flows, as they show a decreasing trend. Scroll down and review the flows as before to see how the traffic is flowing and confirm that there are no more drops.
Note
Filter for the "frontend" VM with the IP address 10.x.1.11 and the "checkout" VM with the IP address 10.x.4.51, where x represents your PodID. The destination in both cases is the "currency" server with the IP address 10.100.150.111.
Step 14
Warning
This step is for informational purposes only. We are running a background script to trigger an instant Assurance Analysis to create a snapshot of the ACI fabric. During this lab, it can take up to 20 minutes to have a new snapshot. This depends on at which stage of the snapshot creation you perform any configuration changes. This time might be a good opportunity for a break, to stretch your legs, or to get a coffee. In your production environment, you would trigger the assurance analysis for your site manually at this stage. At the end of this guide, there is a separate chapter describing how to do it. We recommend checking it out once you are done with this lab.
Step 15
As a final check, you could use Explore again. After the automated Assurance process has created the snapshot, go to Explore and ask it a similar question to verify the communication between the application EPG and L3out or between subnets.
Warning
Be sure to choose the correct snapshot based on the time/date stamp of the snapshot, so it already reflects the remediation done in APIC. This is why you noted the time of the change when you added the subnet to the route map. The timestamp of the snapshot chosen for the query needs to be later than the time of the remediation in APIC. In the worst-case scenario, you might have to wait for another snapshot. It depends on at which stage of the snapshot creation you perform any configuration changes. Therefore, it might be up to 30-40 minutes. Please consult with your proctor if you do not see the relevant snapshot or results as shown in this step. This time might also be a good opportunity for a break, to stretch your legs, or to get a coffee.
Check the entire query outcome - both policy and forwarding.
Note
Query for objects related to your Pod. The screenshots are showing examples only.
As you just saw, the subnet belonging to the "currency" tier is being learned by the switches as it should. Therefore, they know where to forward the incoming flows.
Step 16
You have remediated the problem. The communication towards the "currency" application tier has been restored. You may reply to the application team with "All good now."
A little bit of closing theory
In this use case, we wanted to show you all the possibilities of how to find relevant information to remediate connectivity issues using the powers of Flow Telemetry. You could see how to employ the Delta Analysis feature, which gives you a comparison between two snapshots of your ACI fabric and helps you triangulate what, who, and when caused the configuration changes, perhaps by mistake or a typo. Finally, by defining Compliance rules for critical configurations, you could audit any changes or even get alerted proactively while performing Pre-change Analysis before your maintenance window. Breaking a compliance rule would trigger a critical anomaly either while performing Pre-change Analysis, allowing you to correct your mistake before applying the final configuration, or after the change was made, with either proactive monitoring reviewing the Compliance state or with Delta Analysis. This could help you uncover such a mistake you troubleshooted in this scenario. You will learn all about these other mentioned features in later use cases.
You have finished this use case, you may move on to the next one.