Use-Case 1 - PSIRT/Advisories
Proactive Maintenance with Advisories and Bug Scan
Nexus Dashboard Insights has a mechanism to keep metadata on certain bugs, PSIRTs, and software advisories published by Cisco up to date. Nexus Dashboard Insights collects technical support information from all the devices and runs them against a known set of signatures (metadata), flagging the corresponding defects and PSIRTs. Nexus Dashboard Insights also generates advisories for PSIRTs and anomalies for defects.
Scenario
You arrive at work in the morning and start your daily routine of checks to ensure everything is working as expected, or to review if there are any issues or potential problems. This scenario walks you through where to find advisories, PSIRTs, and bugs. You will also discover how to interact with the related findings and what to do next if you find any. You will learn how Nexus Dashboard Insights can help you perform an analysis of potential bugs and PSIRTs, keeping your environment safer and more stable. Let's get into it.
Note
What you see in the lab may differ slightly from the screenshots in this use case. It's possible that some numbers or the list of advisories is different. The screenshots are valid as of the creation of this use case. However, this does not affect the successful completion of the scenario.
Solution
Step 1
Navigate to Global View, the first screen of Nexus Dashboard Insights.
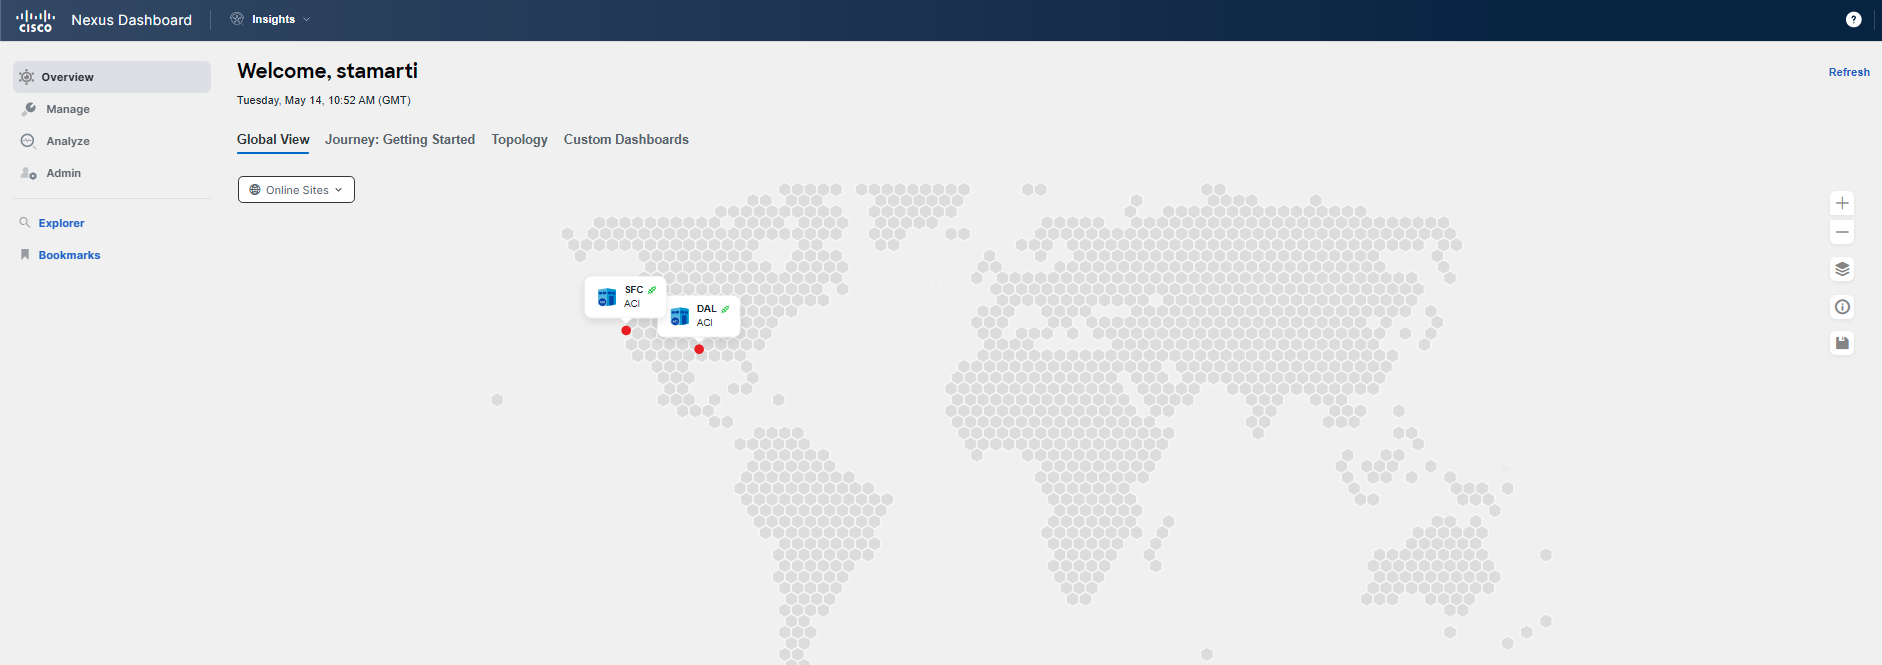
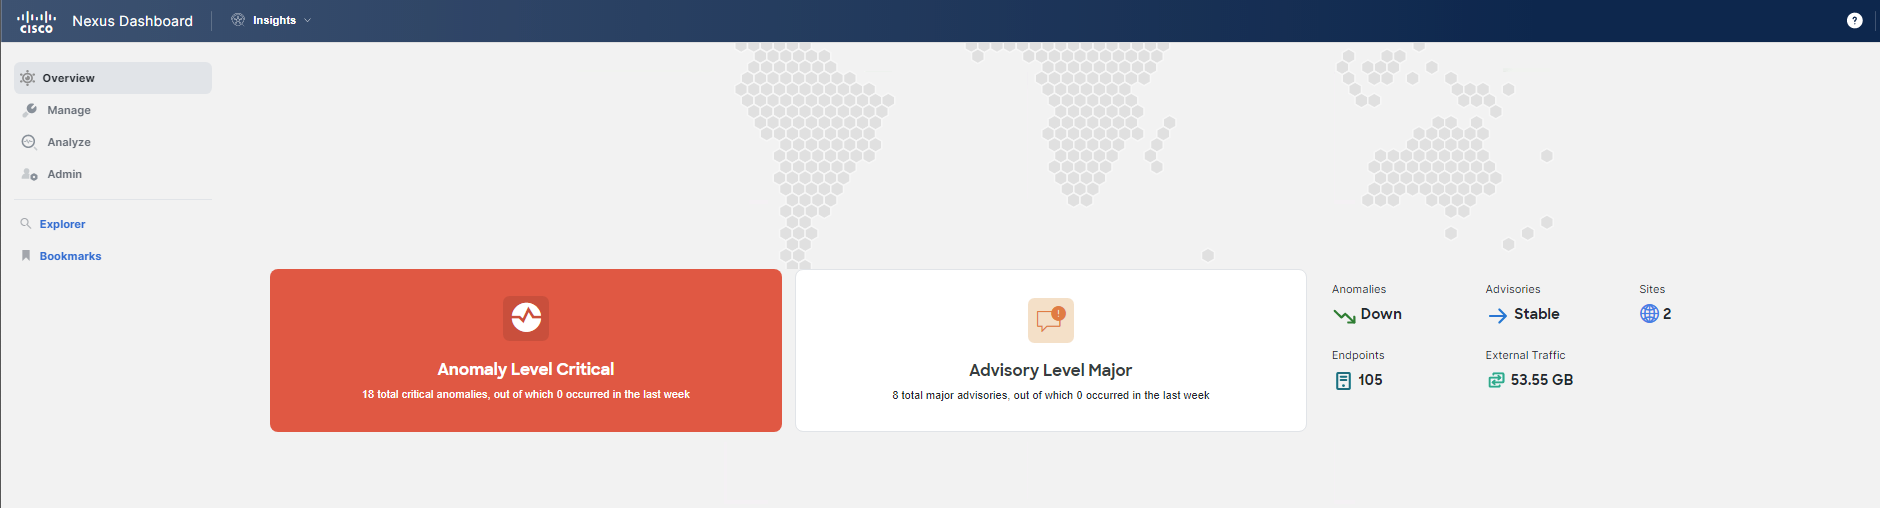
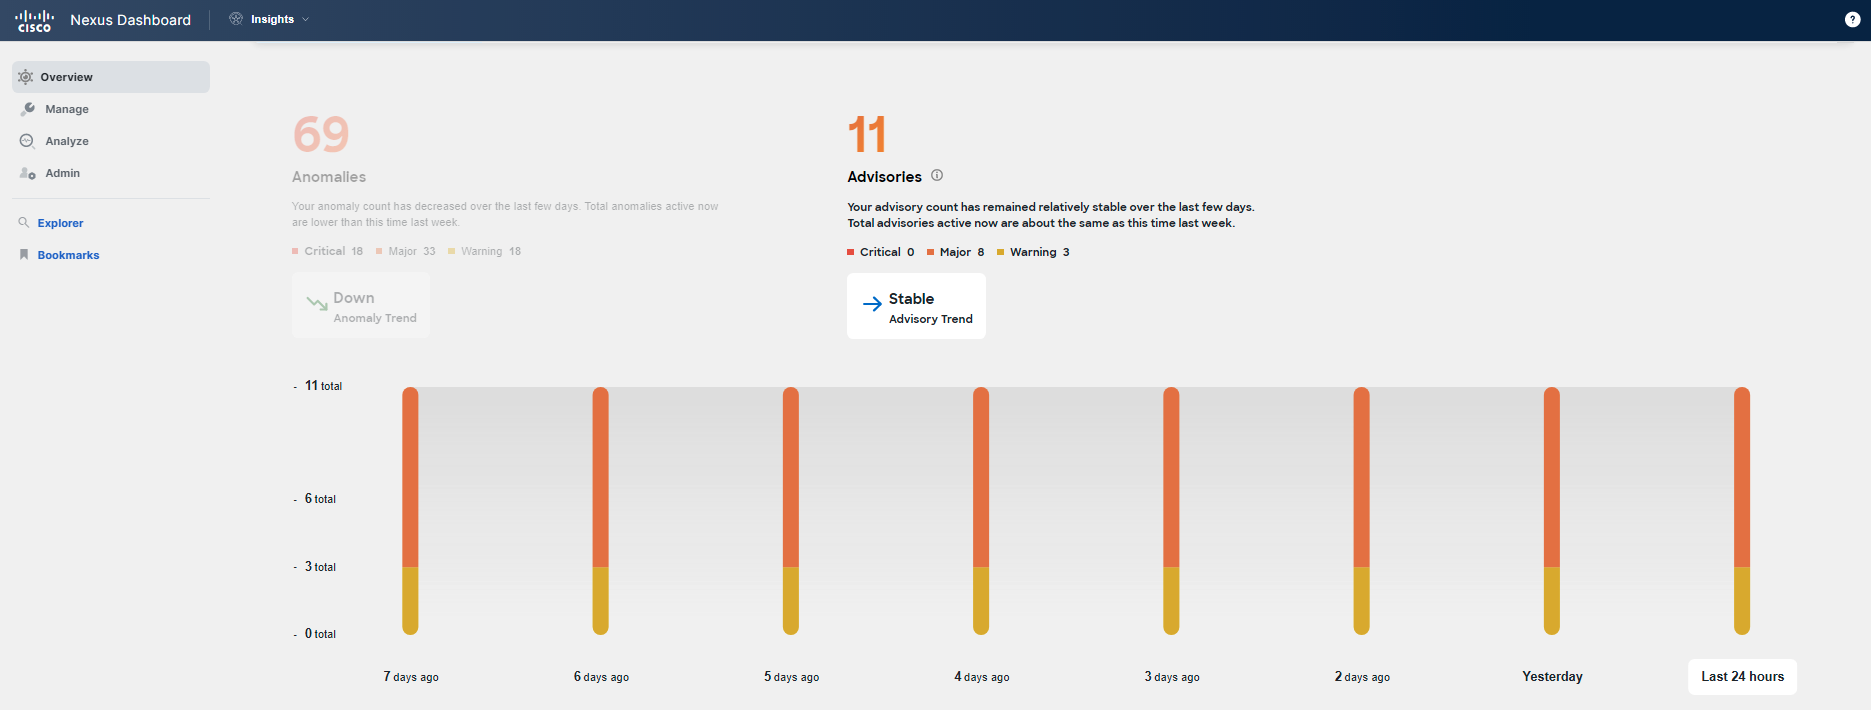
You start by scrolling down to explore the state, changes, and trends of your ACI fabrics. During this check, you notice a Major Advisory Level for your sites and discover that this trend has been present for several days.
Step 2
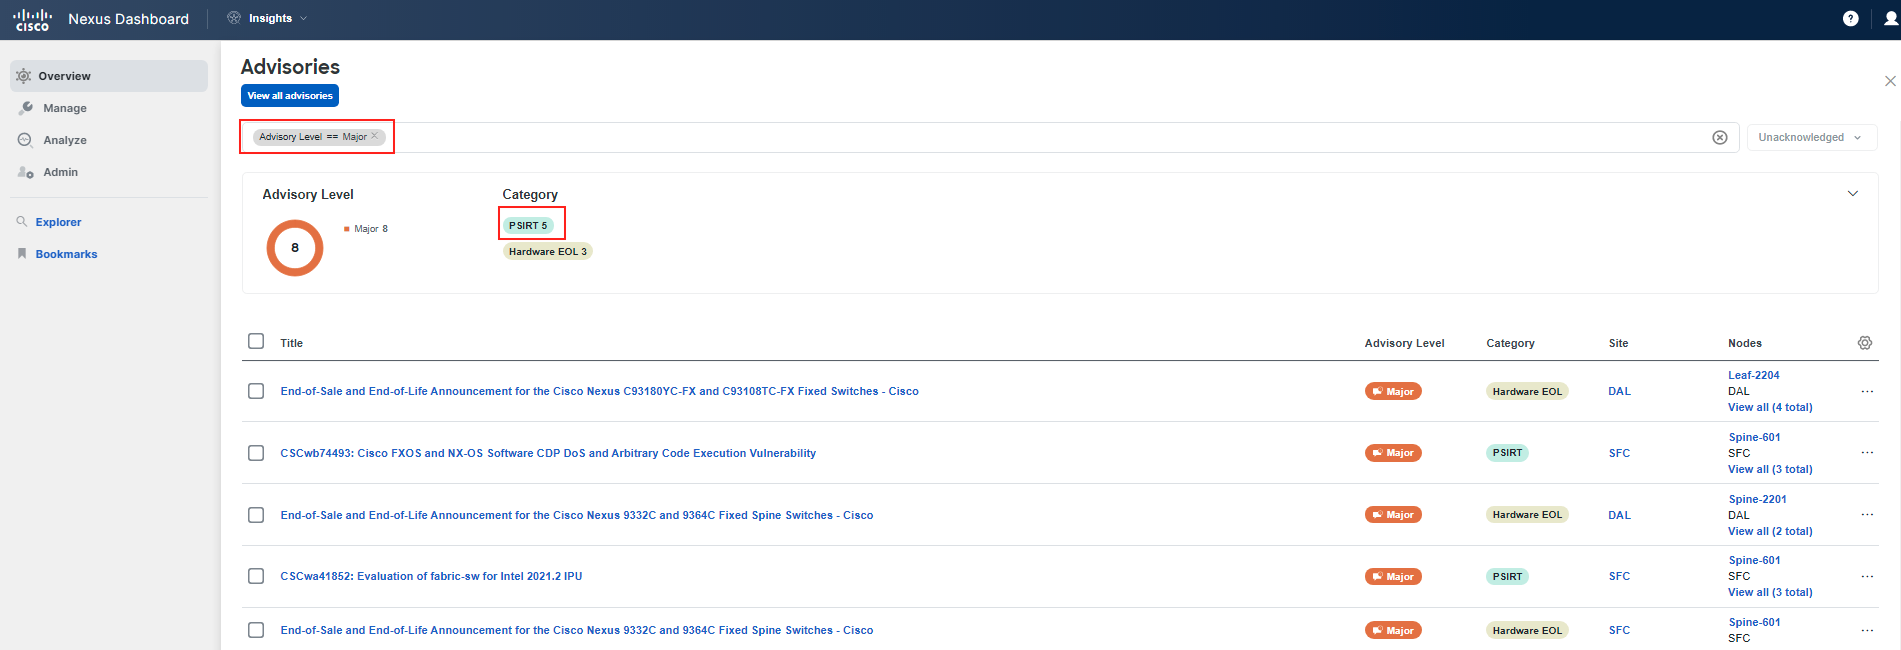
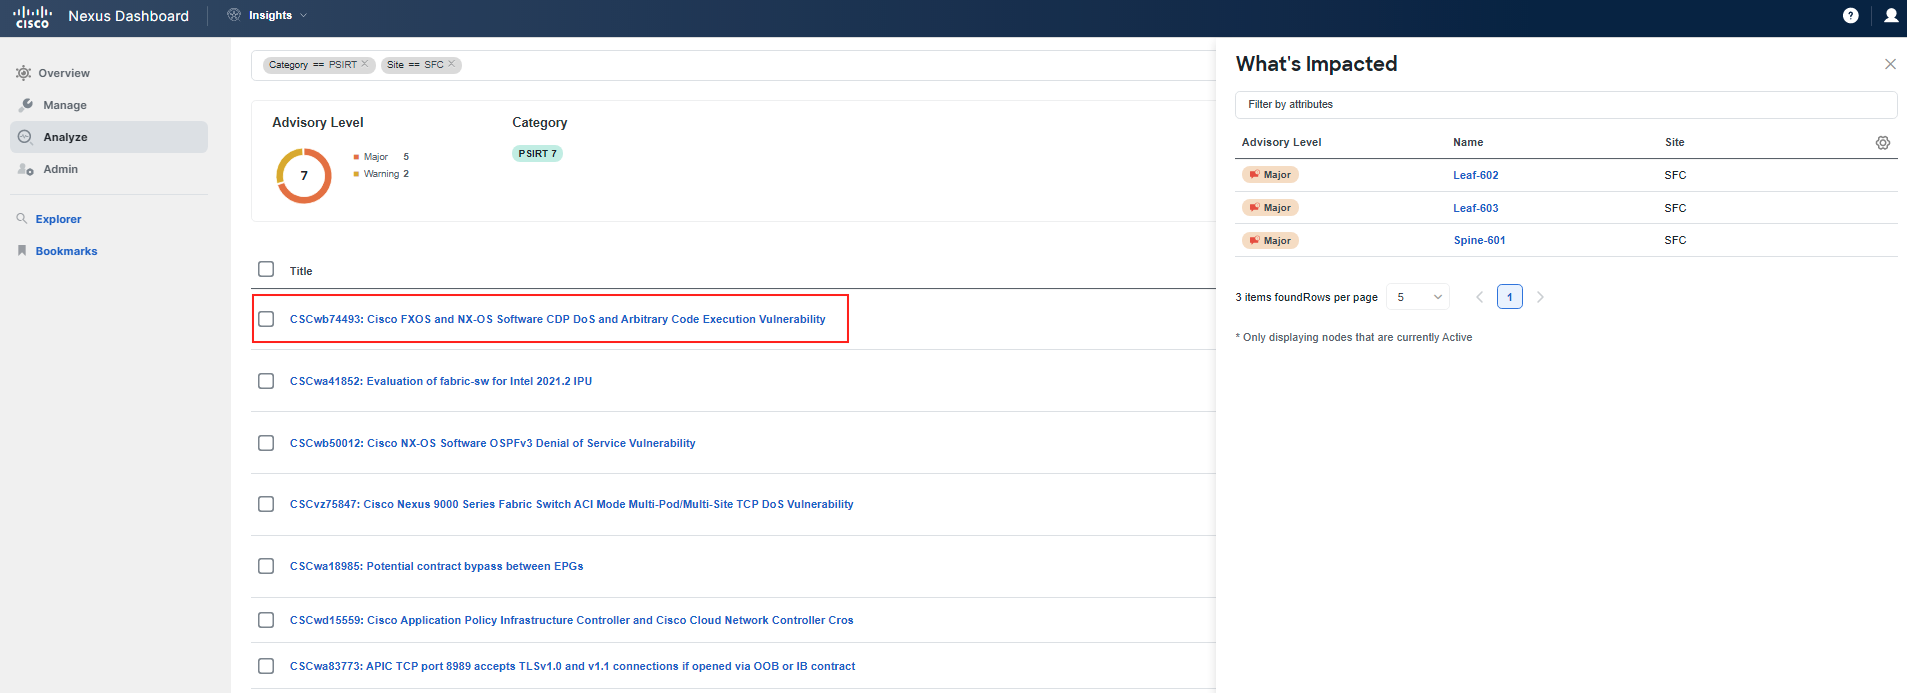
Scroll up slightly and begin investigating to get more details by clicking on Advisory Level Major for the sites.
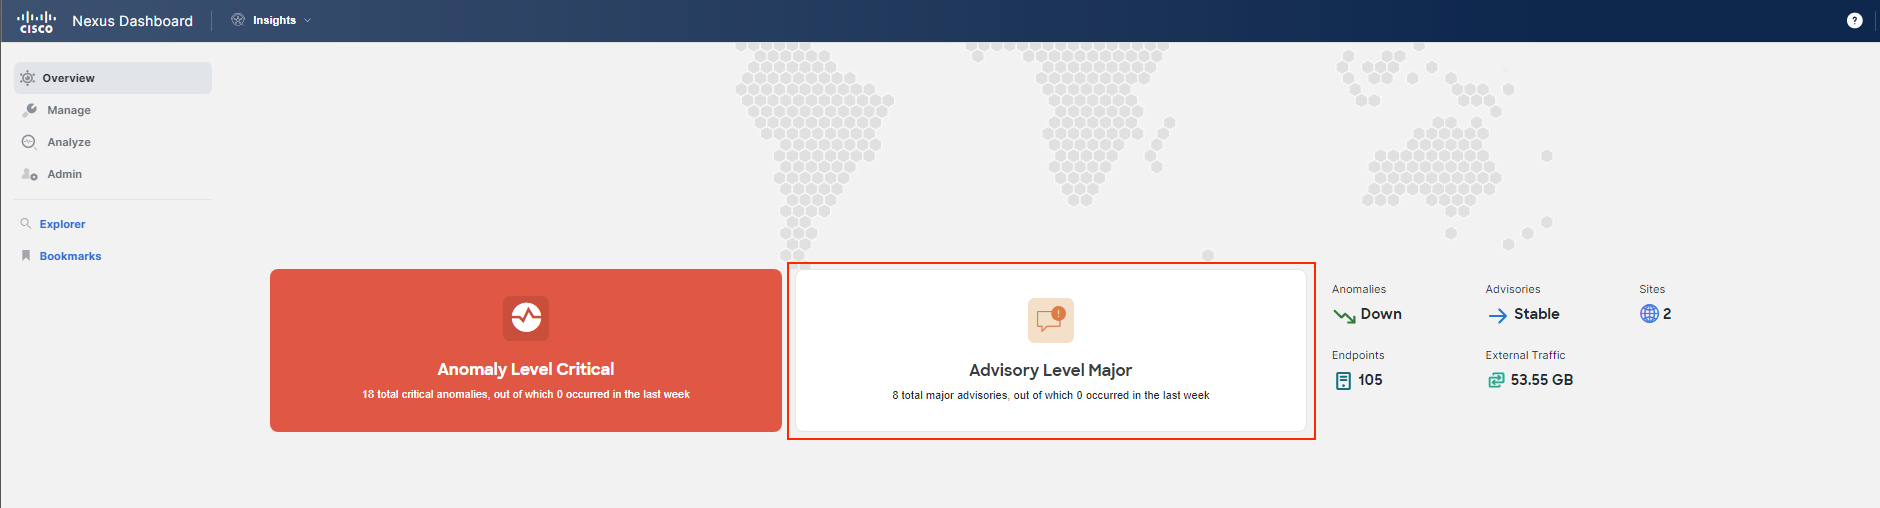
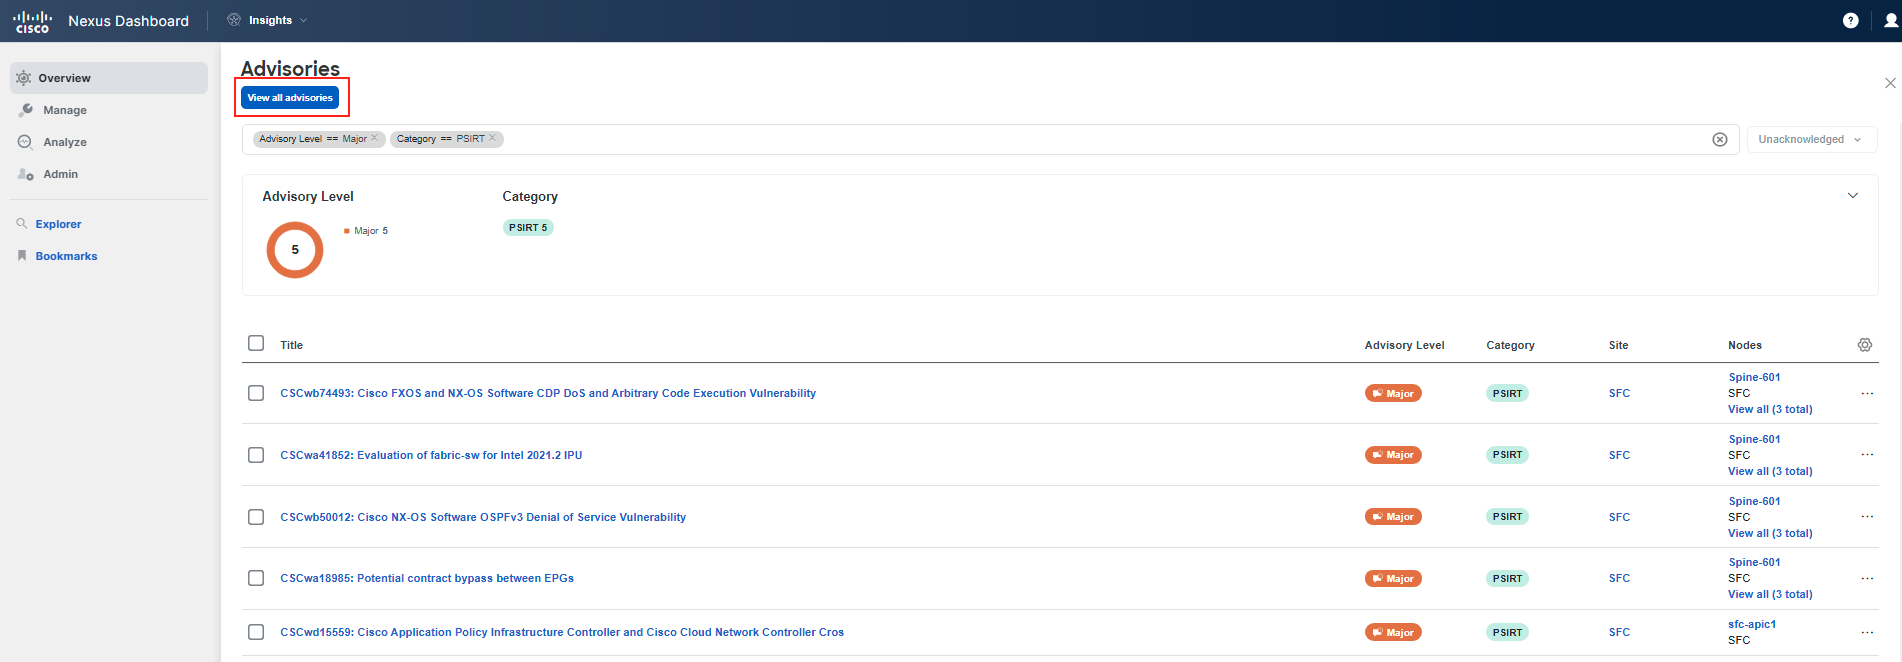
As soon as the window opens, you will see several major PSIRT notifications. Focus on your SFC ACI site. You may review the advisories from this view or navigate further. To get a comprehensive view of Advisories, click on the View all advisories button. Now, you can see all severity level categories, not just the major ones.
Note
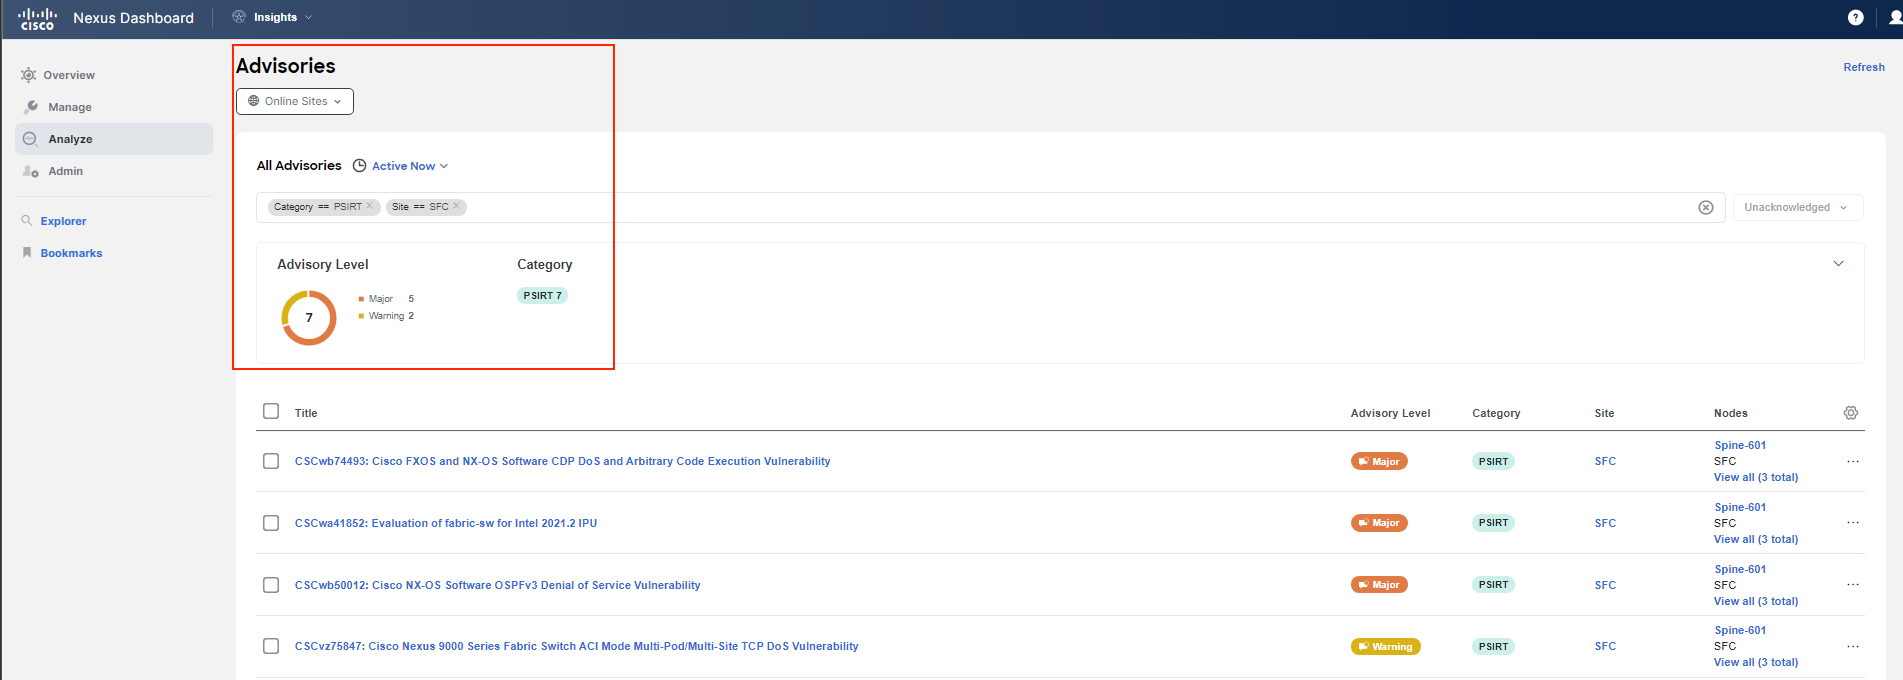
The default view here focuses on the severity level Major. You can also remove the filter. The goal is to navigate to Analyze > Advisories from the Global View to explore how things are connected. The PSIRT category is the focus of this use case. You might have noticed that there are also EoL (End of Life) advisories, which are the focus of another use case, so disregard them for now. Edit the filter to match the view you see in the upcoming screenshots.
Step 3
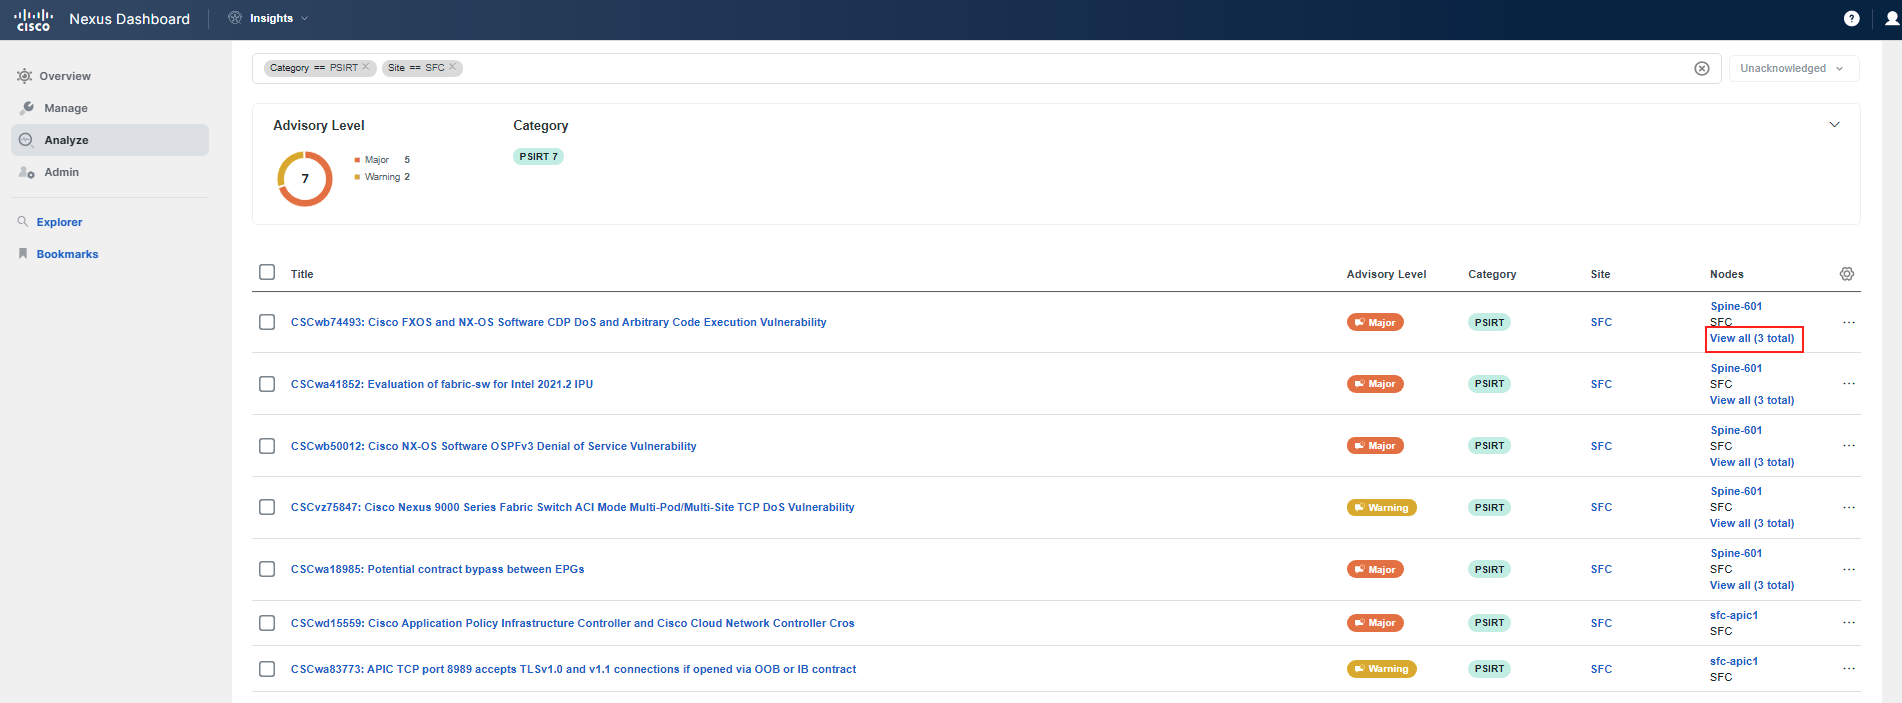
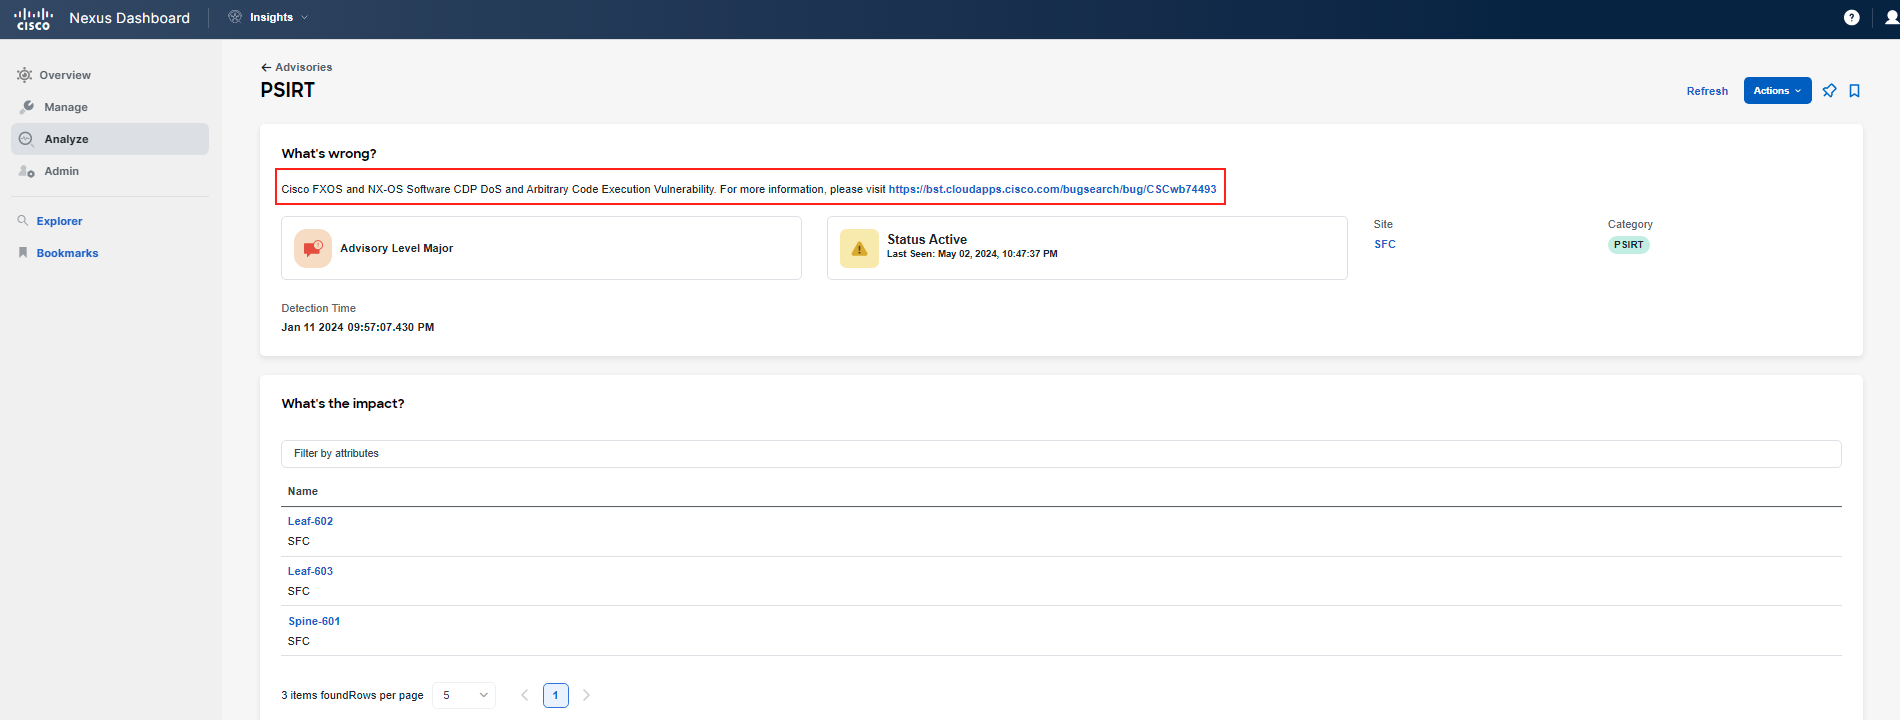
Investigate the PSIRT advisories presented in Nexus Dashboard Insights by reviewing the Advisory level view and by clicking on the PSIRT notifications. As previously mentioned, you will focus on the SFC site during this use case. Nexus Dashboard Insights also provides the ability to navigate directly to Cisco's Bug Search tool for each specific advisory.
Note
This is one of two use cases where you will interact with the SFC ACI fabric. Consider it as a small regional data center (DC) that has not received much attention for some time since all projects were performed at the main DC, the DAL ACI fabric.
Warning
You must log in with your CCO ID to Cisco's Bug Search tool if you wish to compare what Nexus Dashboard Insights shows and what is published in the Bug Search tool.
Info
This is a good place to create a pin to your dashboard, so you can return to it and check the status later. Pin it to your Custom Dashboard named according to your POD ID by clicking on the pin icon in the top right corner.
You may perform the same investigation for other advisories indicated by Nexus Dashboard Insights.
Step 4
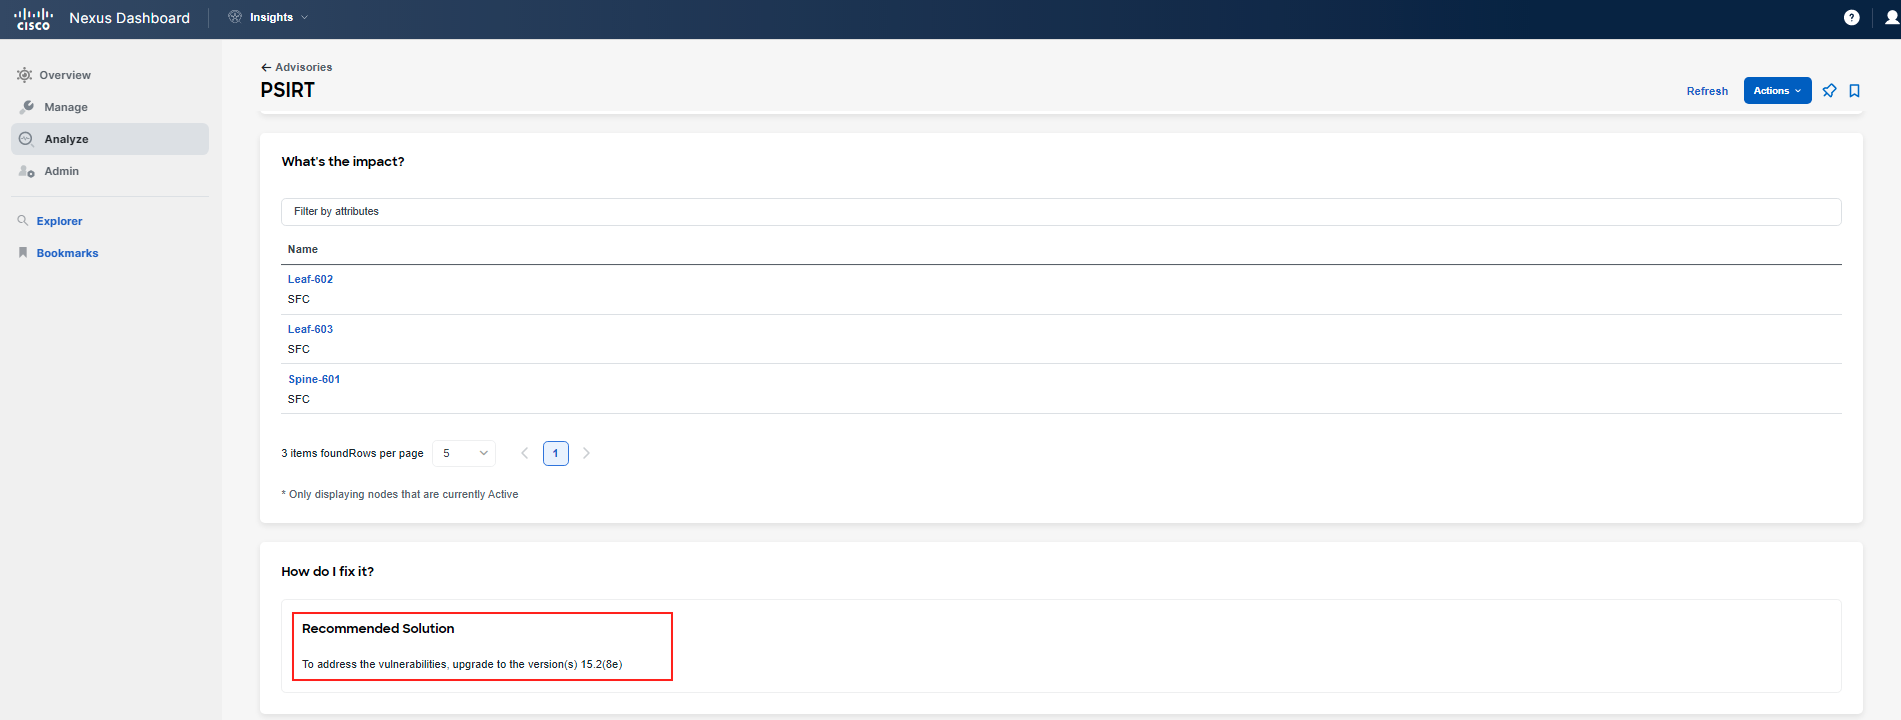
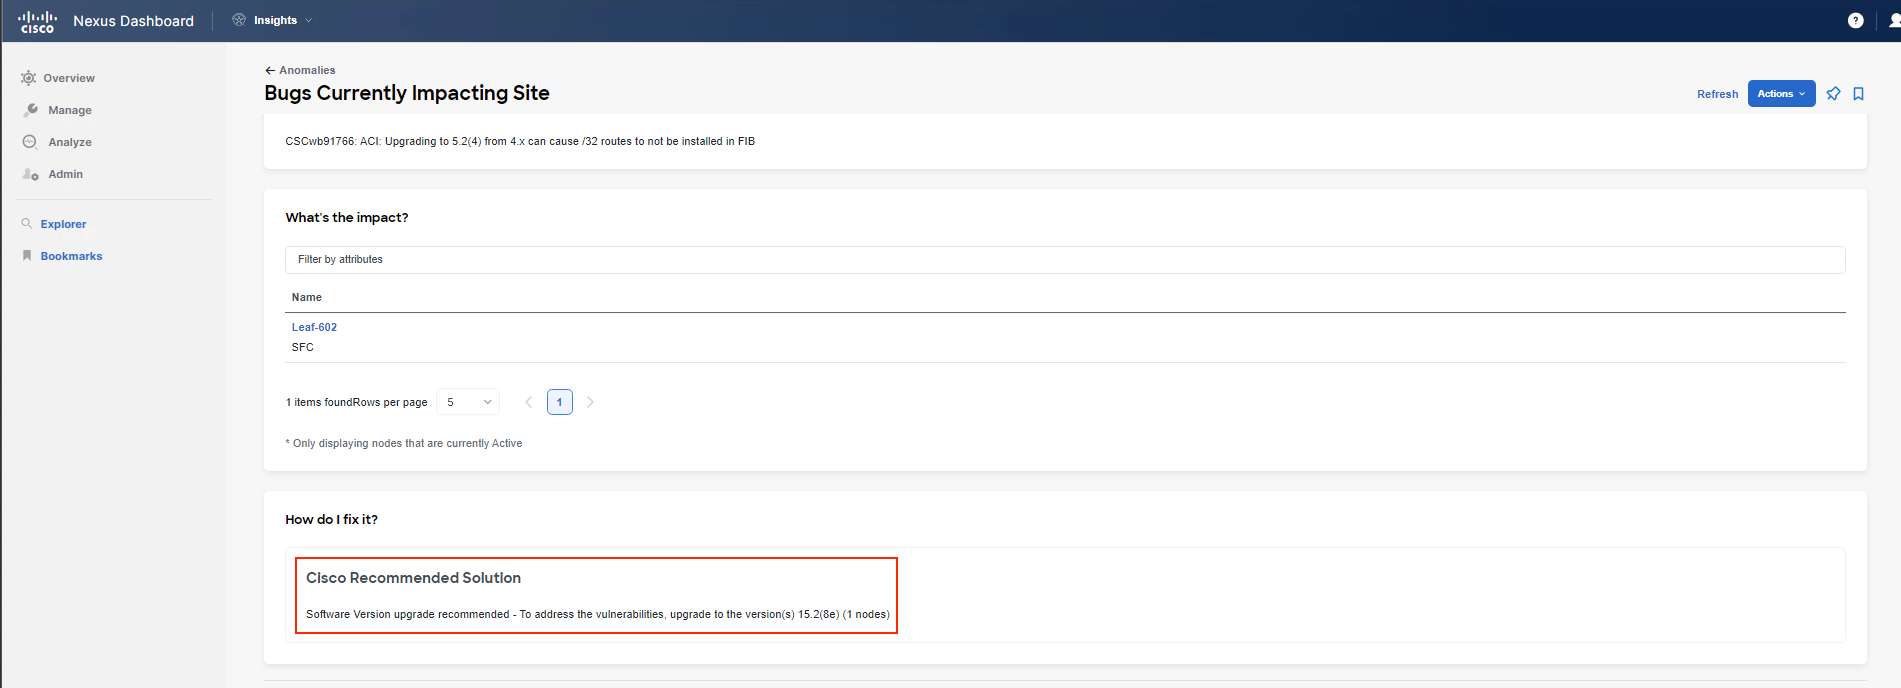
After performing an analysis of these advisories, you conclude that there are two recommendations:
- Upgrade.
- Contact Cisco TAC.
Step 5
Since one of the recommendations is an upgrade, you want to check the release of the fabric. Begin by navigating to Manage > Sites. There, you can see that the SFC site has an Advisory level Major and is running the 5.2(4d) release, while the DAL site is running a newer release. Click on the SFC site. Then, review tabs such as Overview, Inventory, and Advisories.
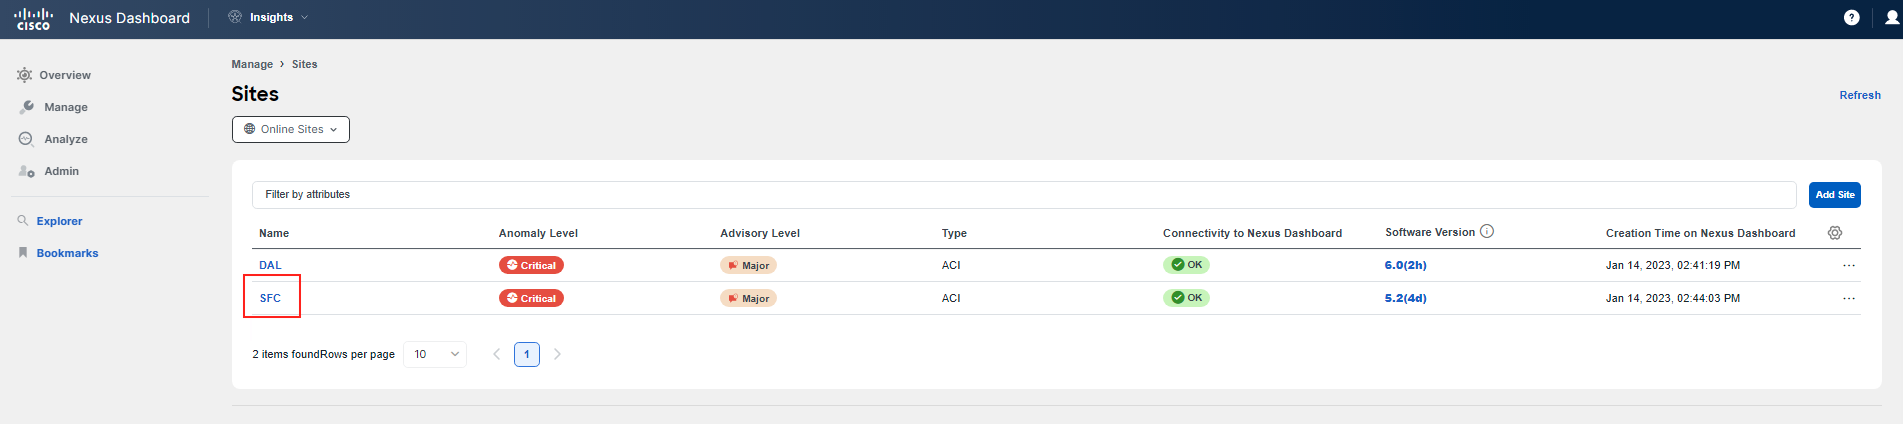
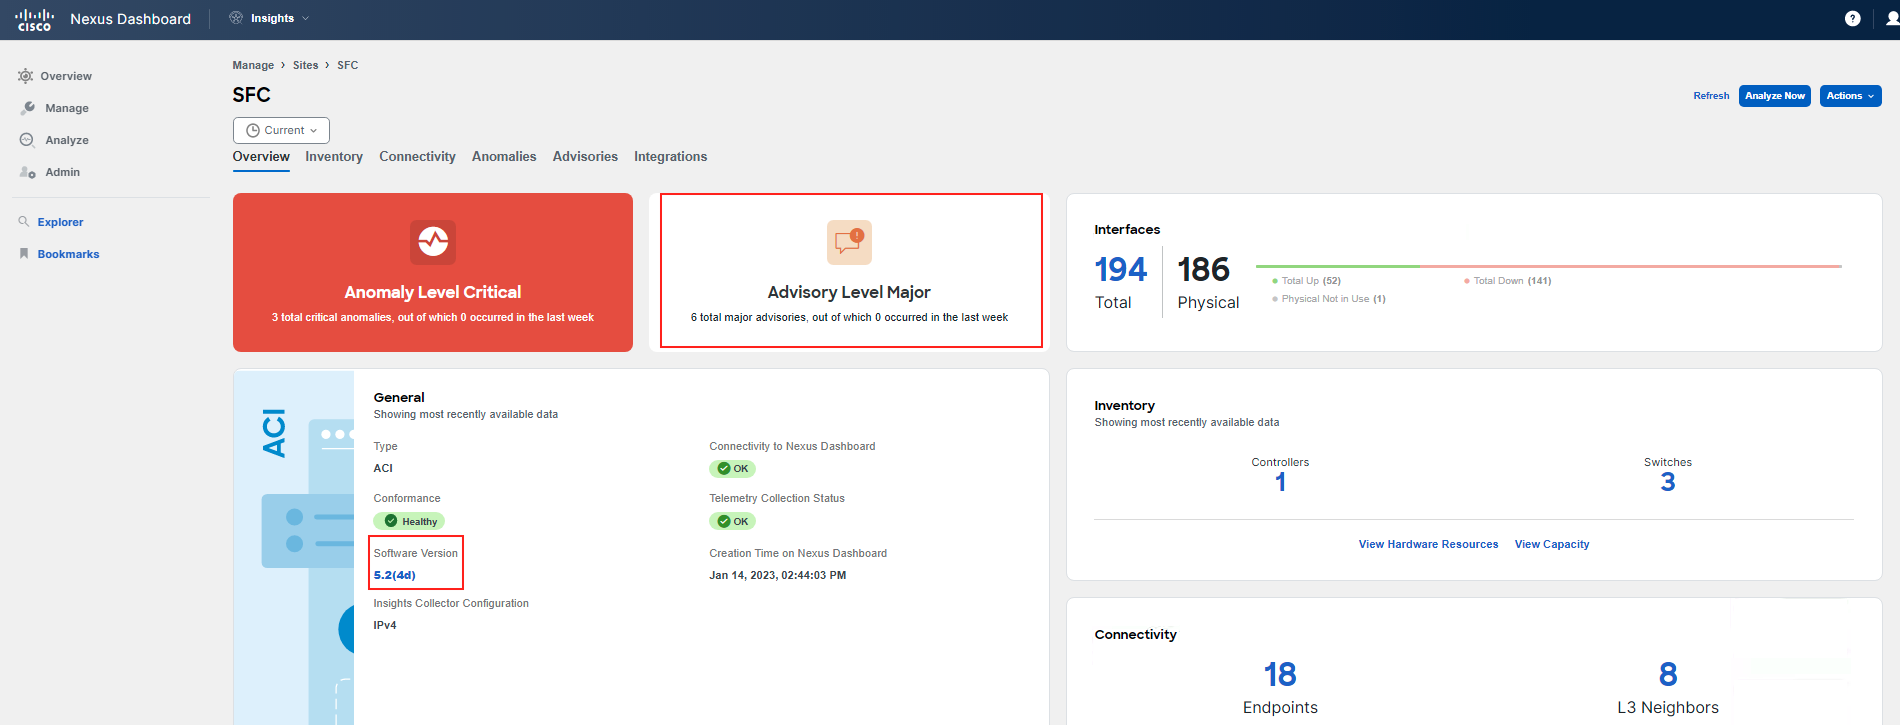
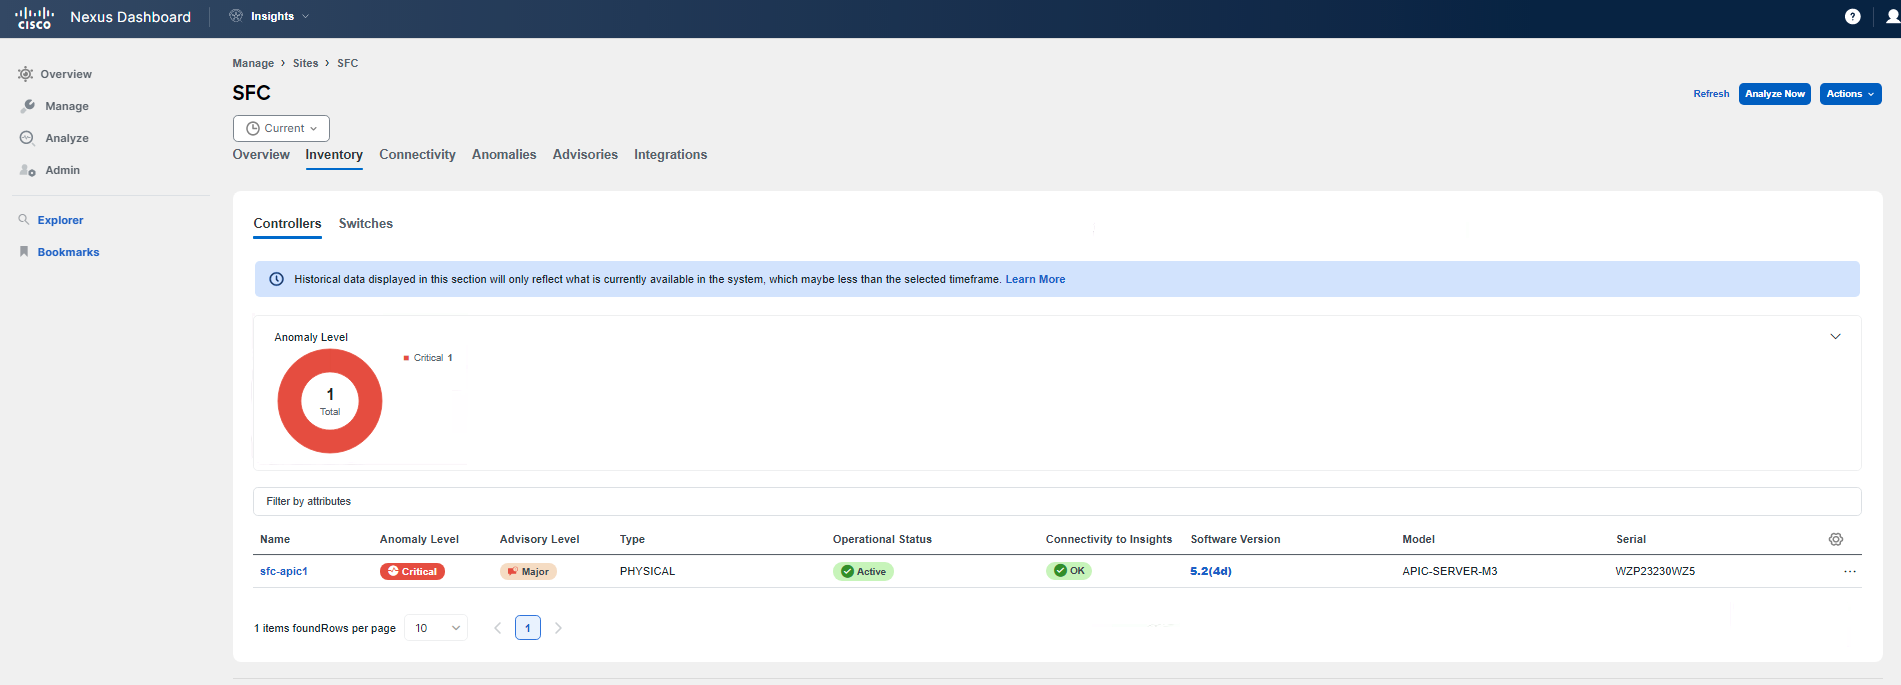
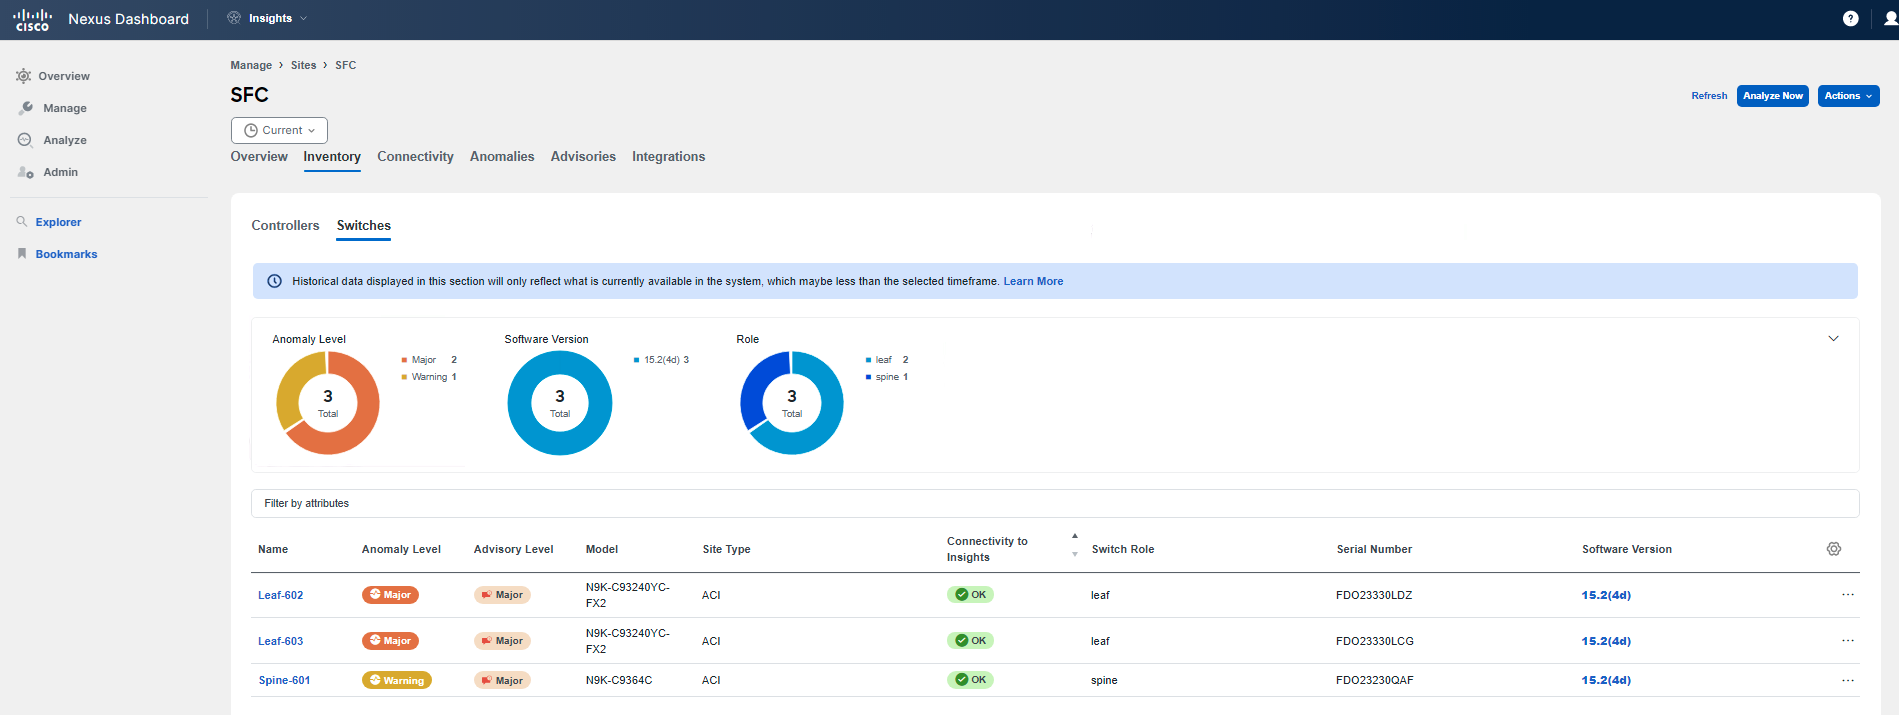
In the Inventory tab, you can see the advisory level as well, software version of the devices and much more.
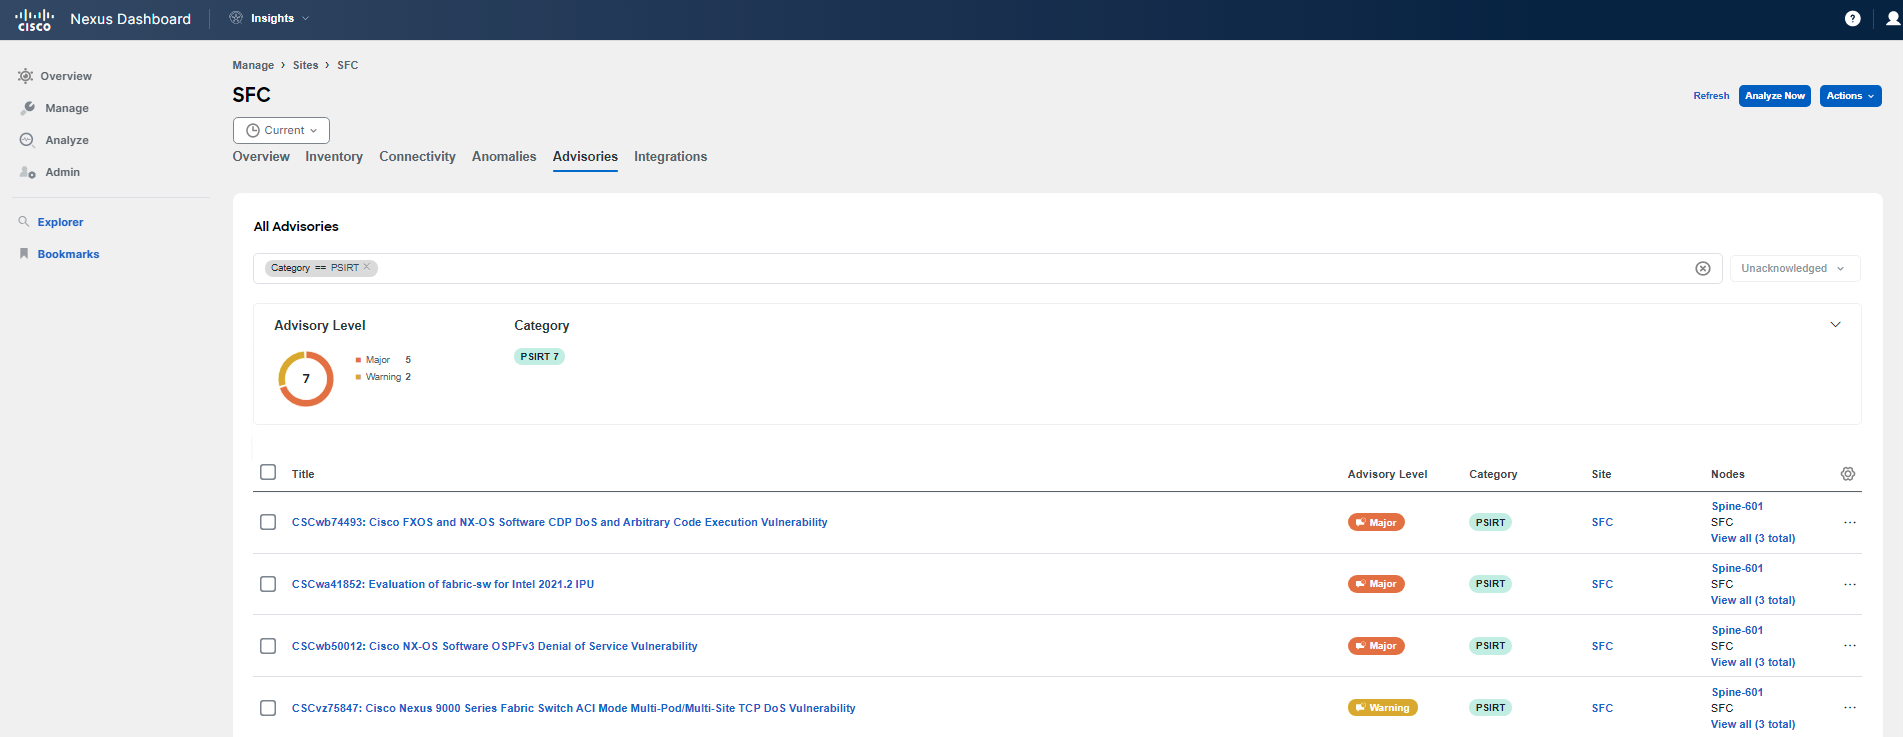
In the Advisories tab, you can see the same advisories as you already reviewed during earlier steps. This is just another way from which to view site related advisories.
Step 6
You have finished analysis of PSIRT notifications. Move to Anomalies tab for SFC site, and filter for the Category == Active bugs. You will notice there are active bugs which impact your fabric. Check them out.
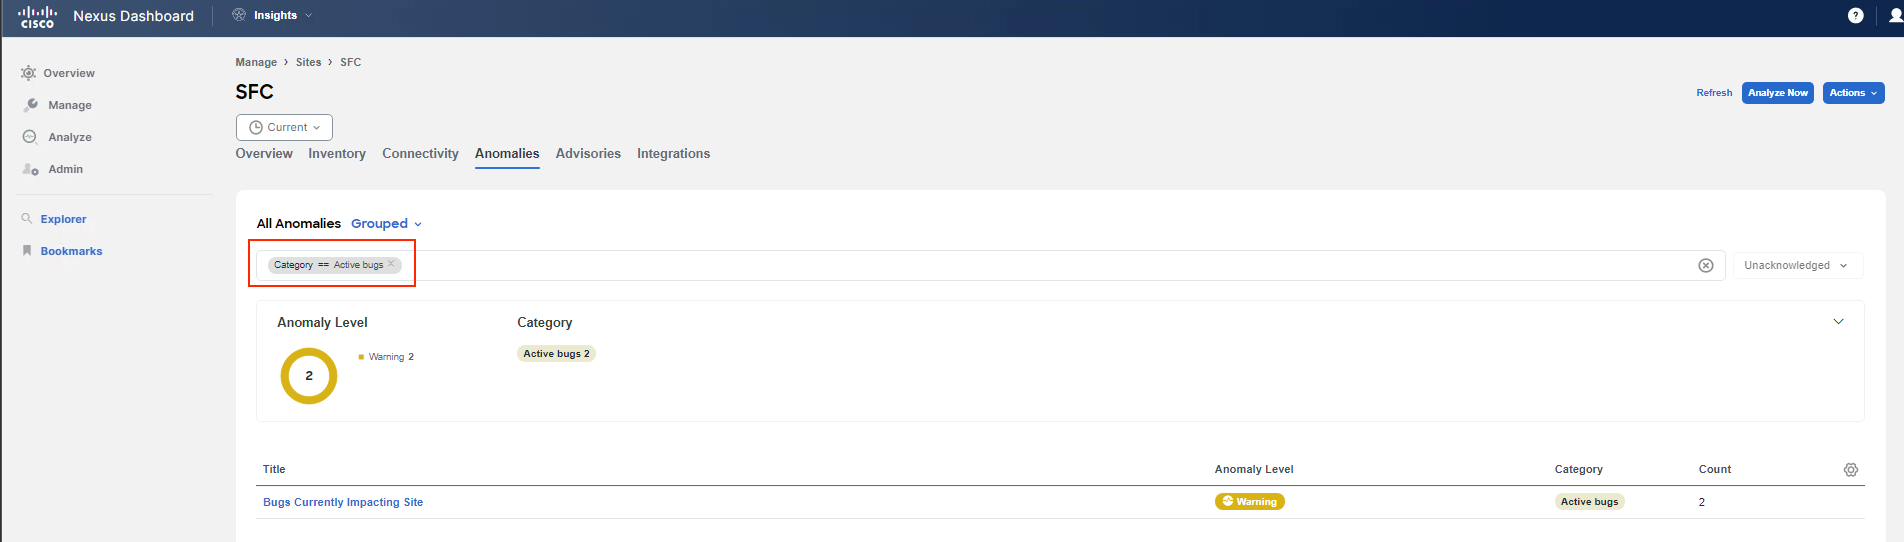
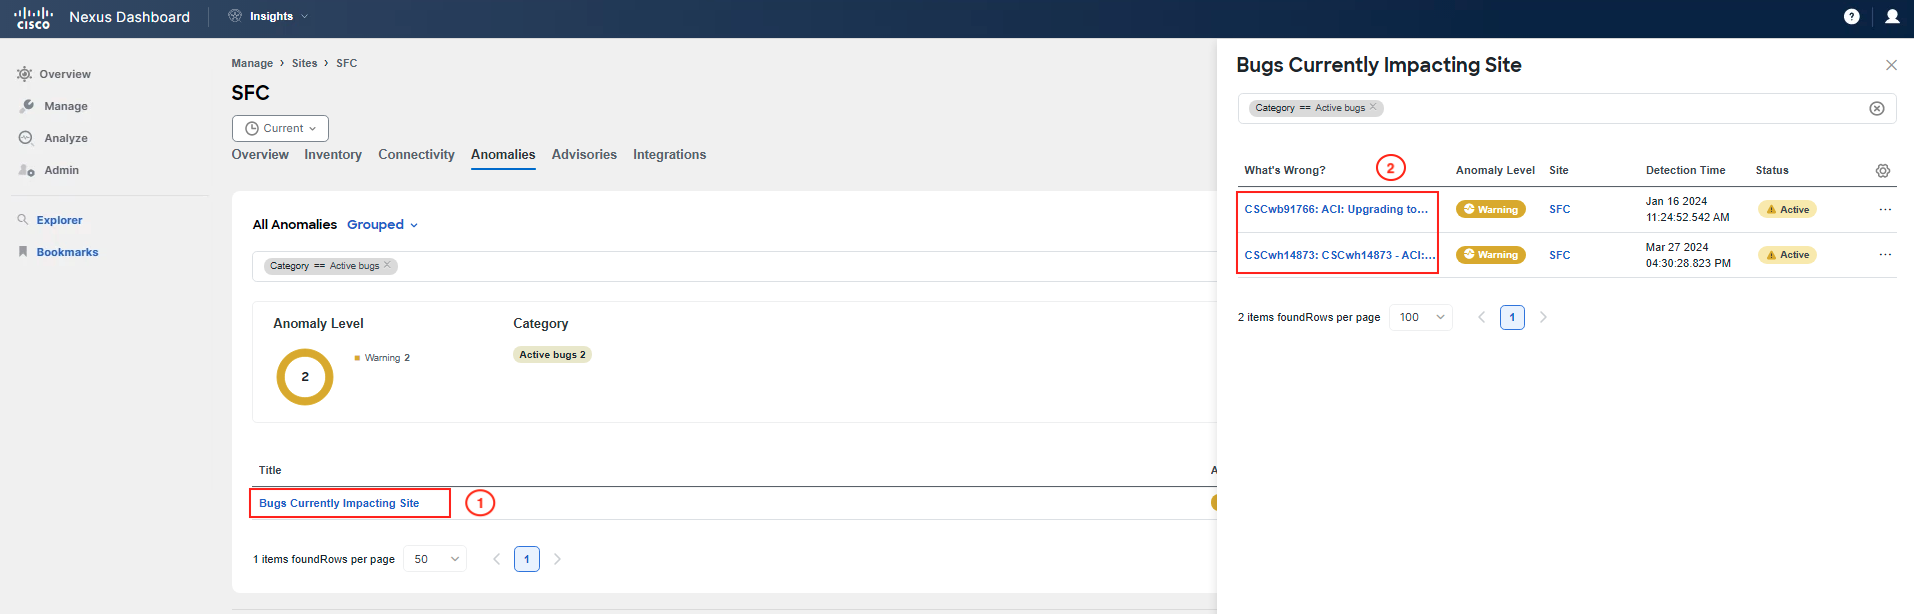
You found out that the bugs are related to the SFC site, its state/configuration, and because of the release that is currently running. You can also jump to Cisco's Bug Search Tool from here to double-check.
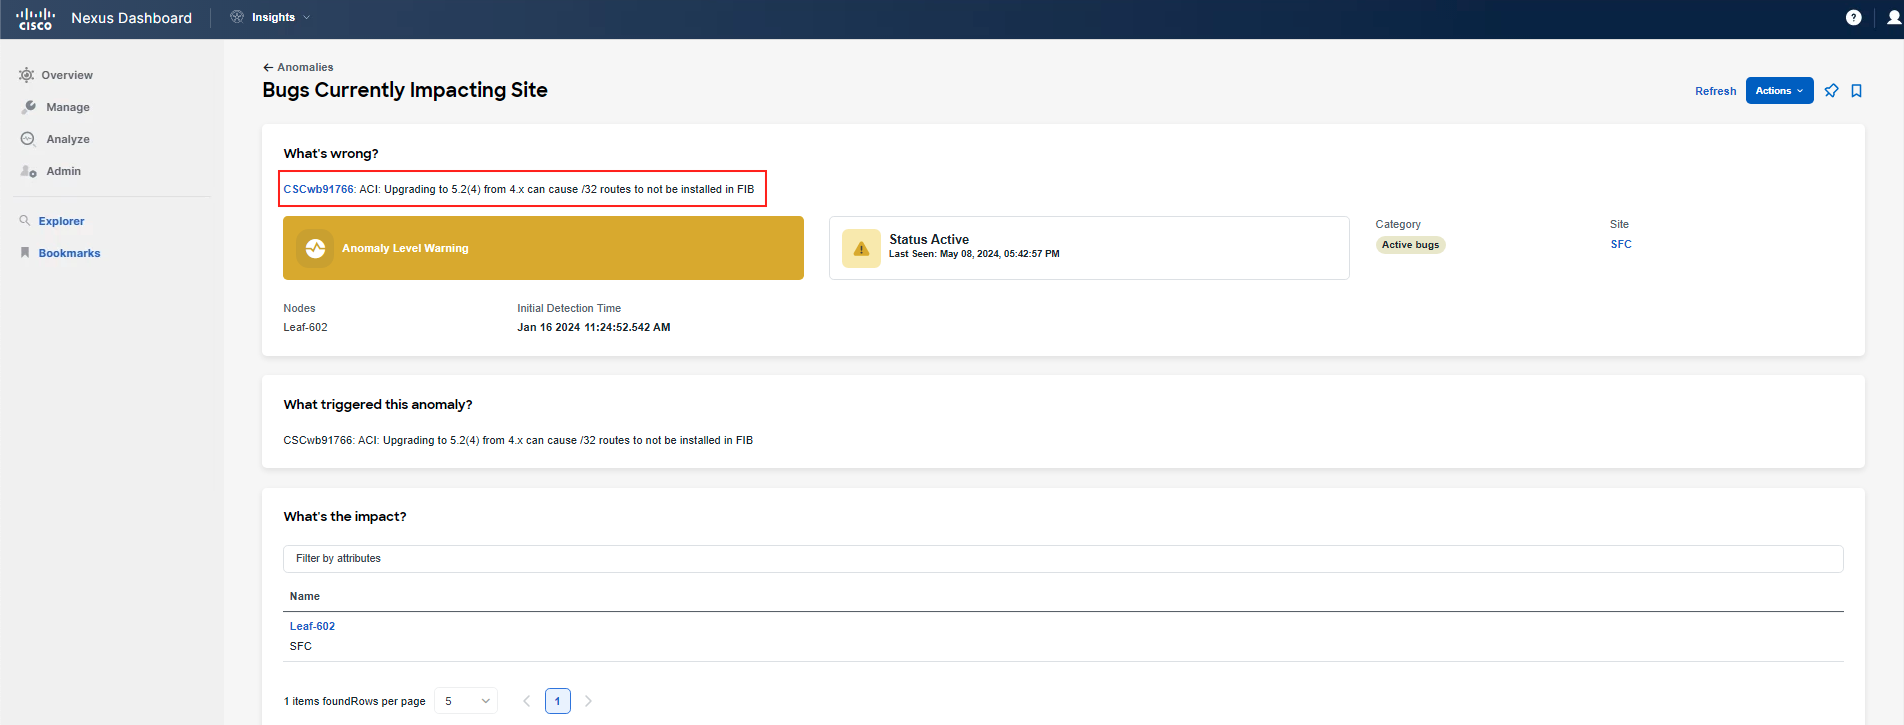
A bug is active when there is a signature match indicating that the bug is active/affecting the environment. This determination is based on comparing tech support logs created during the regular bug scan job performed by Nexus Dashboard Insights with the defined signature in the metadata file. The metadata file is part of the platform.
Info
This is a good place to create a pin to your dashboard so that you can return to it and check the status later. Pin it to your Custom Dashboard named according to your POD ID by clicking on the pin icon in the top right corner.
Step 7
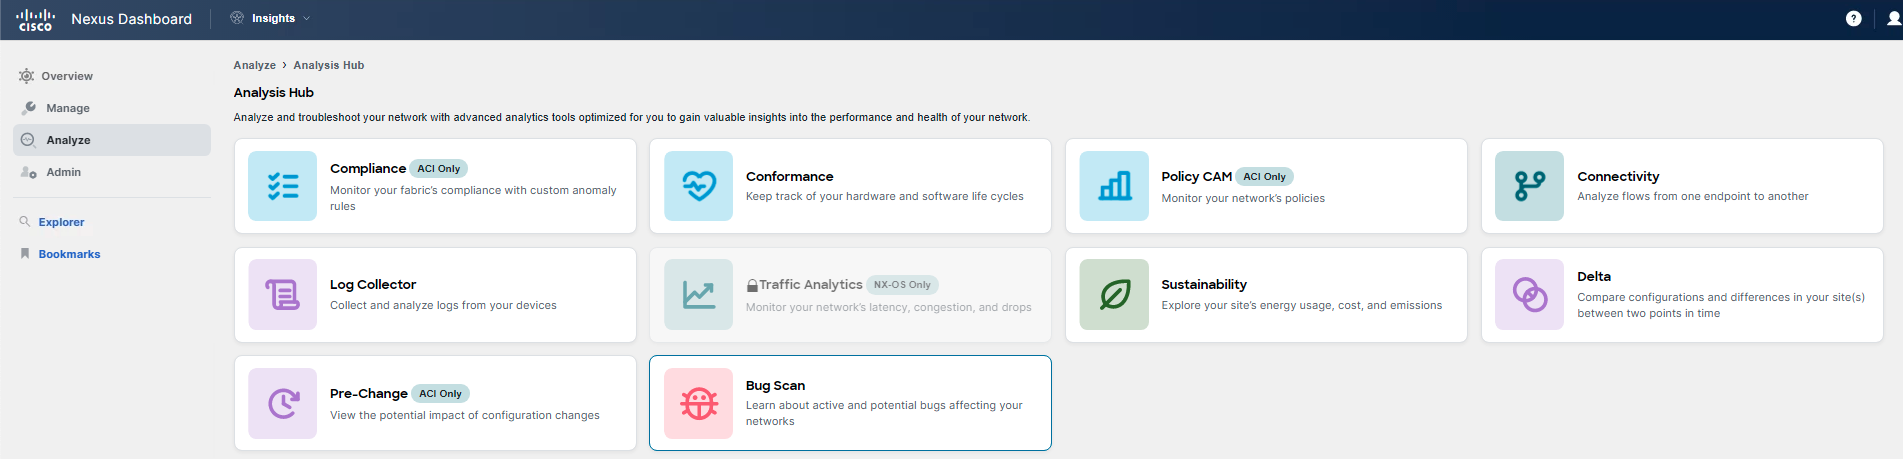
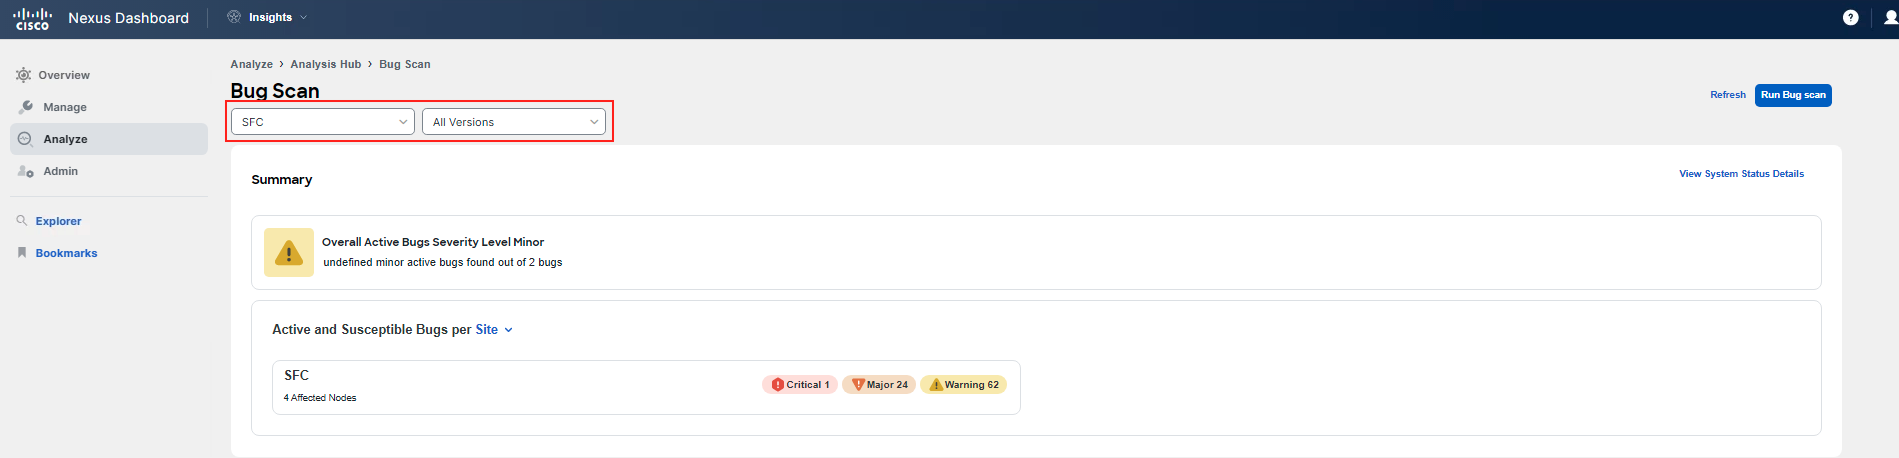
To conclude the analysis of bugs, navigate to Analyze > Analyze Hub > Bug Scan. You can search for active bugs here as well. The additional visibility here is that you may also analyze another type of bug known as susceptible bugs.
Warning
Please DO NOT perform a Bug Scan. This has already been done and is not necessary to be repeated by each participant.
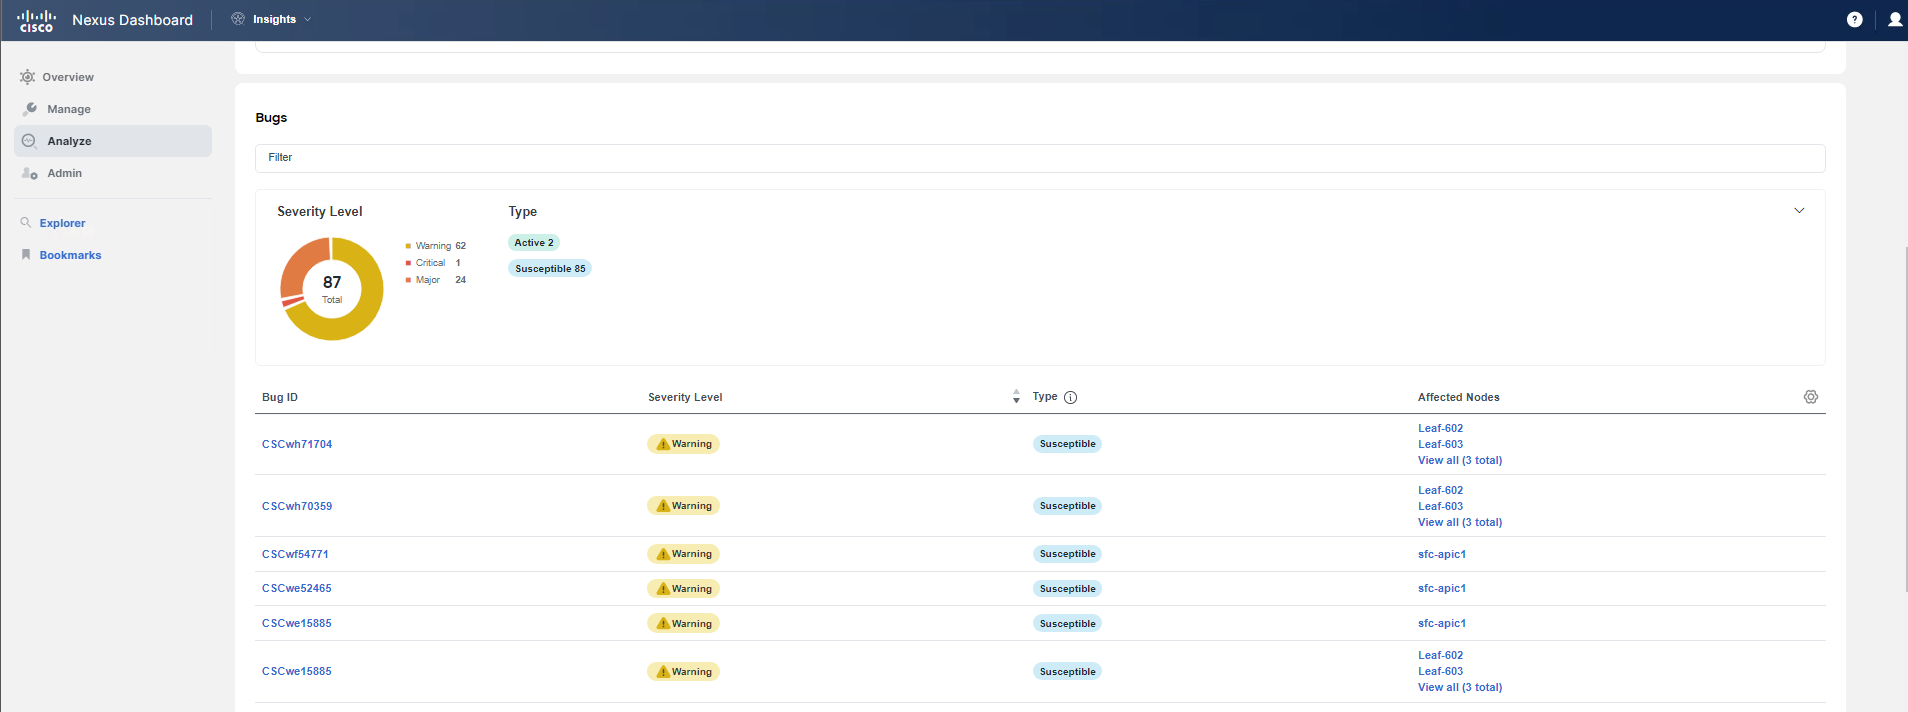
A susceptible bug is detected based solely on the version of the environment. Therefore, it means these are known bugs for a particular version, but they have not been matched based on any specific signatures for your environment. The environment is most likely not affected by a susceptible bug. This provides more visibility into a particular release and any defects associated with that release.
Warning
If you click on any of the bug IDs shown in the table, you must log in with your CCO ID to Cisco's Bug Search tool if you wish to analyze the details of the bug.
Note
The visibility of susceptible bugs is a new enhancement to the Bug Scan functionality in the latest Nexus Dashboard release, version 3.1.
Step 8
You have performed the proactive maintenance analysis of the SFC site and checked for PSIRTs and bugs. You have concluded that it is time to upgrade the regional data center as well before any issues impact your fabric.
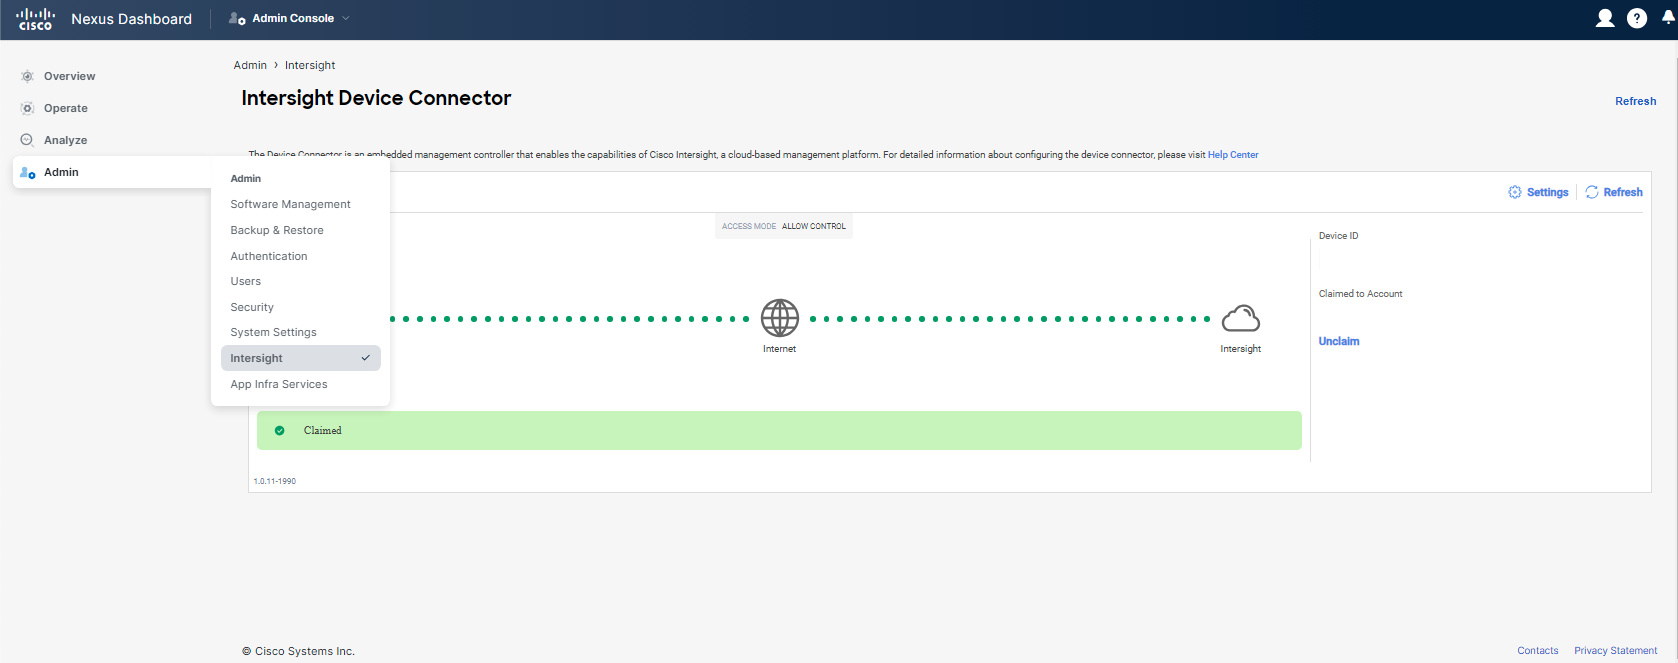
Note
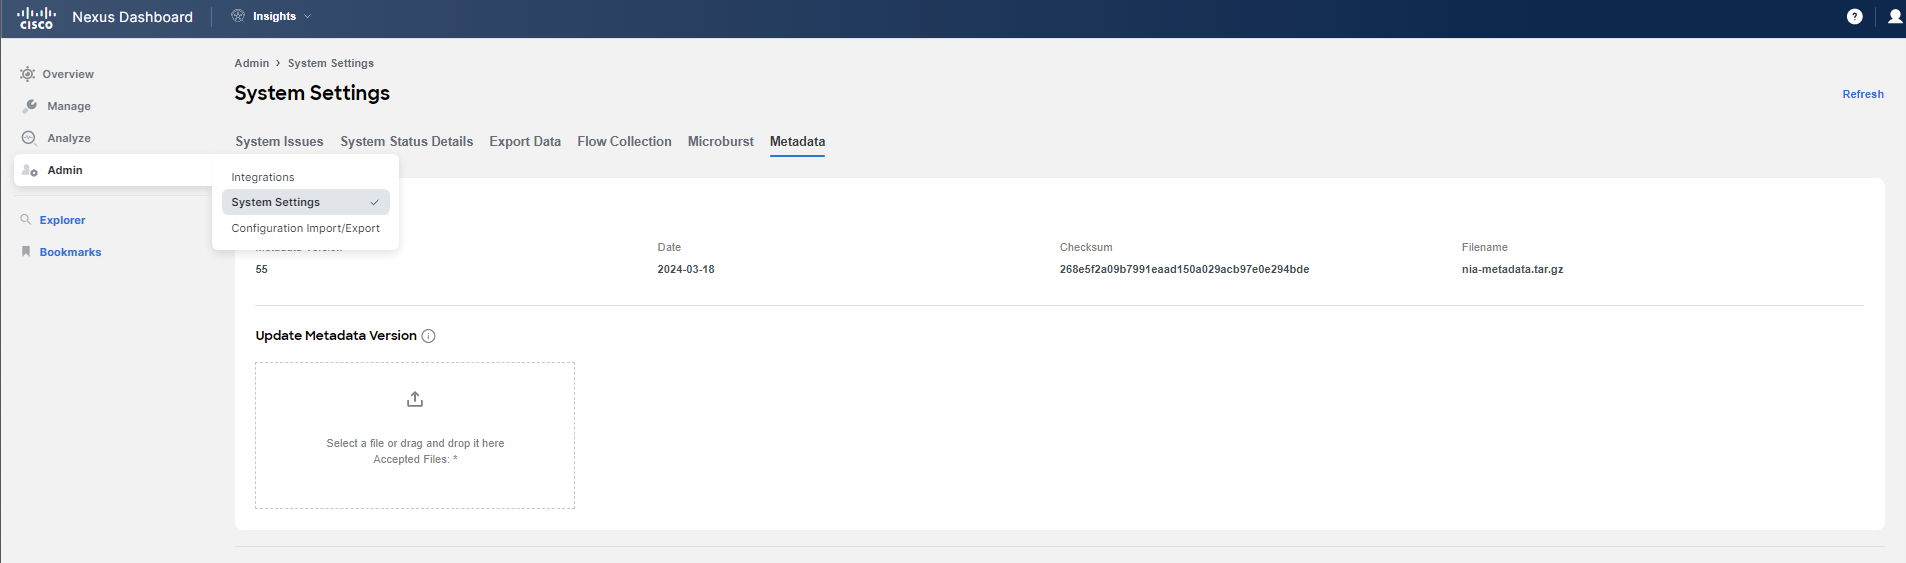
It is advised to keep the metadata of Nexus Dashboard Insights up to date by claiming the Nexus Dashboard cluster to Intersight. This allows Nexus Dashboard Insights to provide accurate details and information. We recommend doing this on your Nexus Dashboard. The screenshots below show how it should look.
You may head to the next use-case.