Use-Case 2 - Hardware/Software/Scale Conformance
Hardware/Software & Scale Conformance
Nexus Dashboard Insights offers the capability to run a Conformance Report for hardware, software, and scale metrics.
- HW/SW Conformance informs you whether your network is conformant from the perspective of physical boxes and the software itself. What does this mean? It provides answers to questions such as: Am I running the proper release? Are my switches up-to-date? When should I plan to lifecycle or replace my switches? When should I plan to upgrade my fabric?
- Scale Conformance indicates whether your policy and resource utilization in the fabric are within Cisco tested and suggested scale utilization. It allows you to run your fabric more efficiently in terms of resource usage.
Scenario
Now, let's imagine a scenario.
Your management needs to plan the budget/CAPEX for the next 2-3 years, so your boss gives you a task: Do we need to replace any hardware in our ACI fabric in the next 2 years? Provide me with an analysis of our network from a HW/SW perspective, so we can build the plan and ask for the appropriate budget. You take on the task and will utilize Nexus Dashboard Insights to provide you with answers.
Solution
Step 1
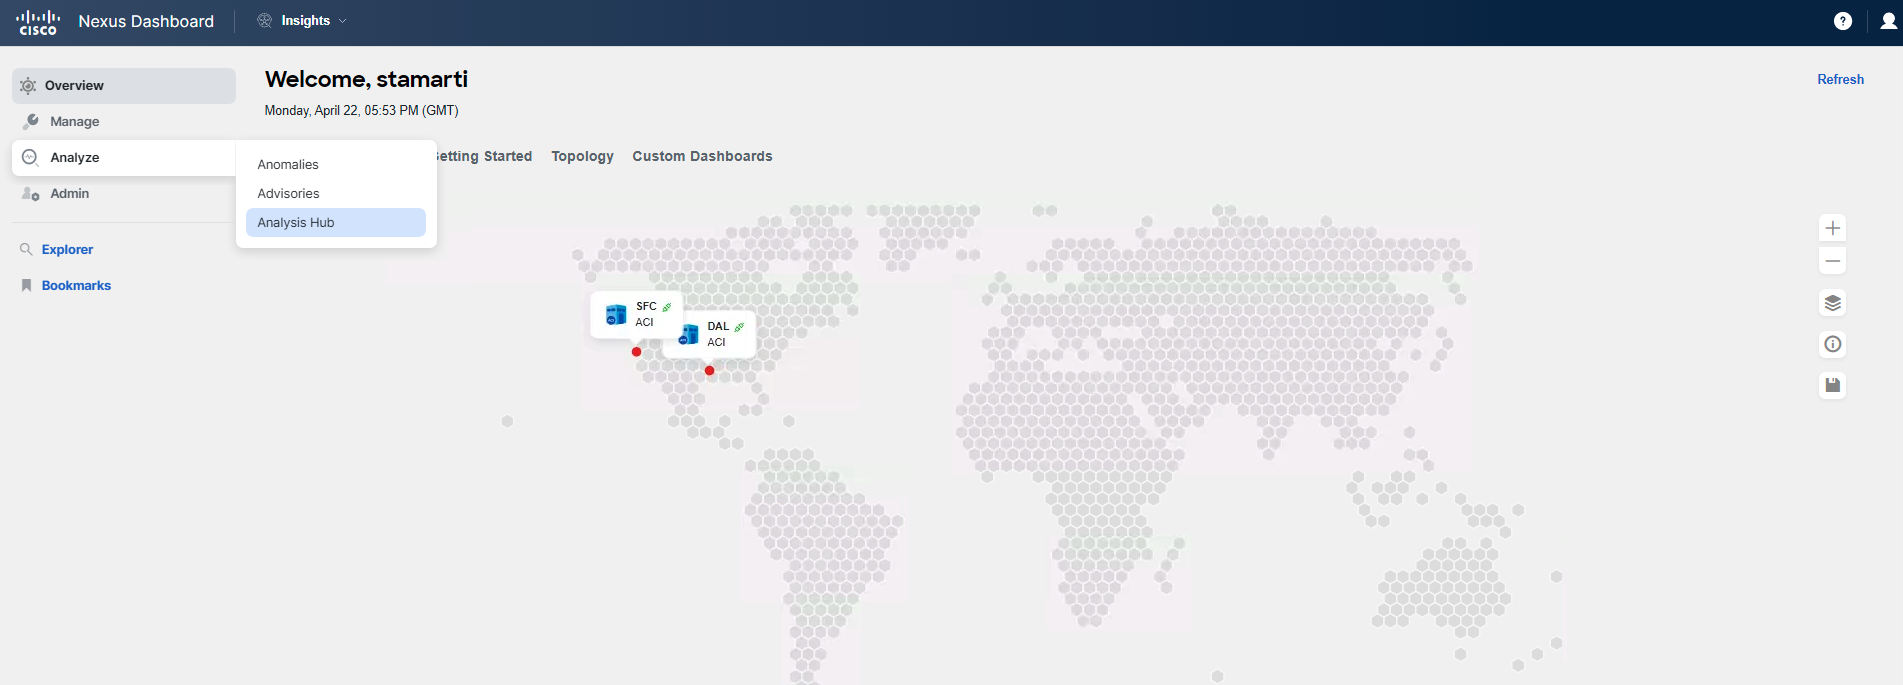
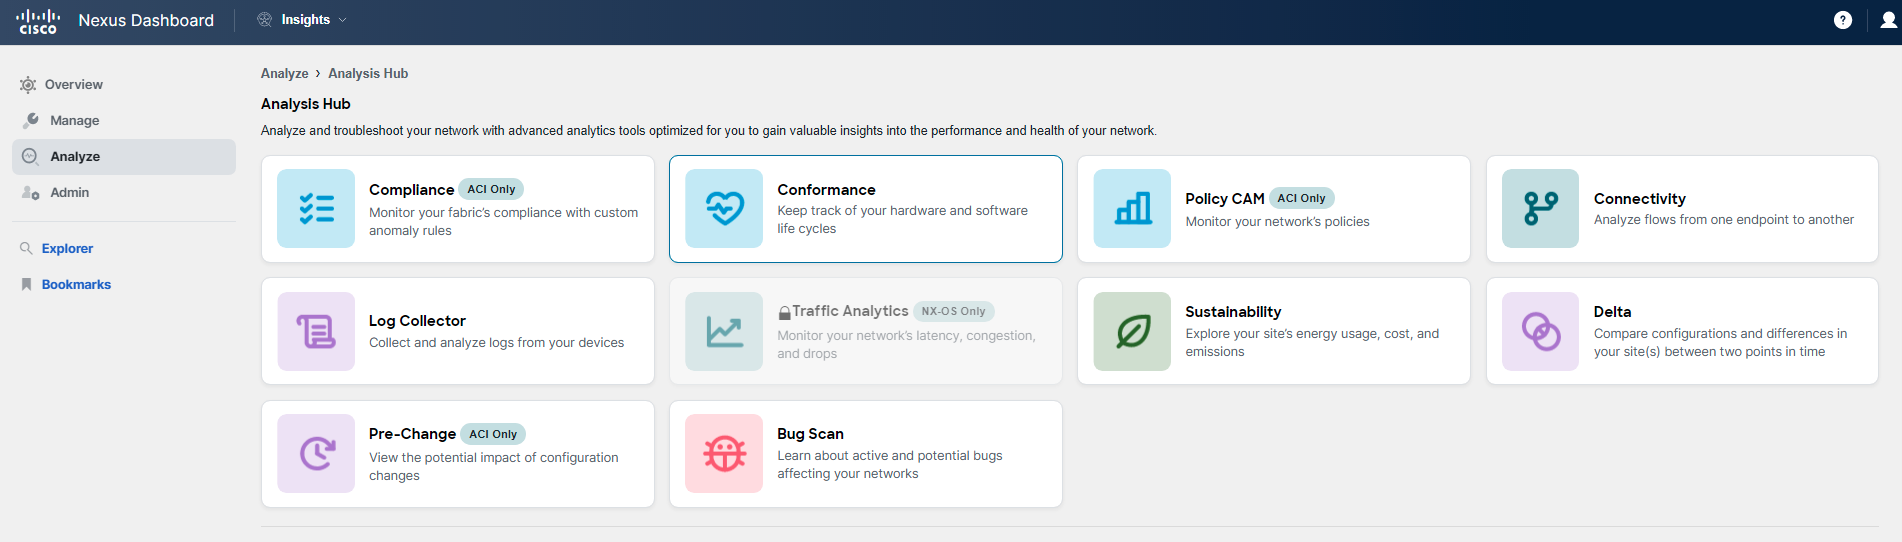
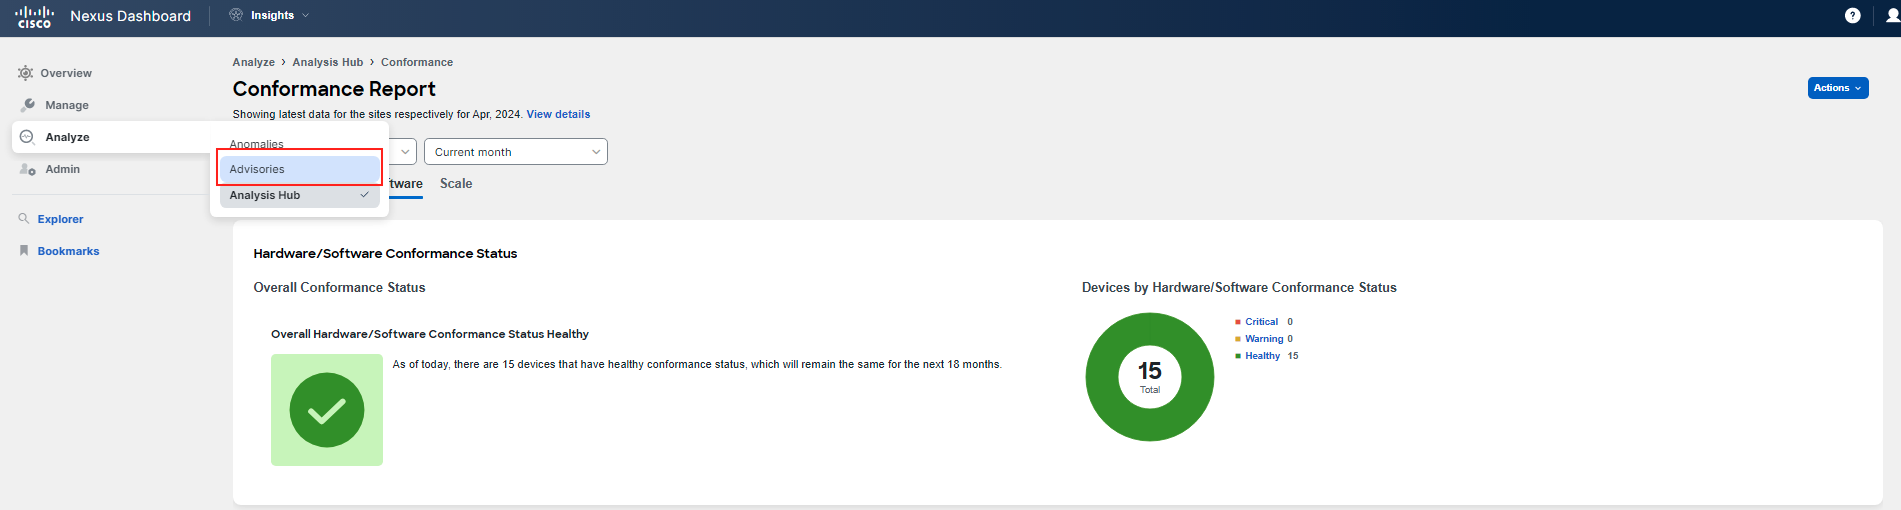
Start by navigating to Analyze Hub and then click on Conformance.
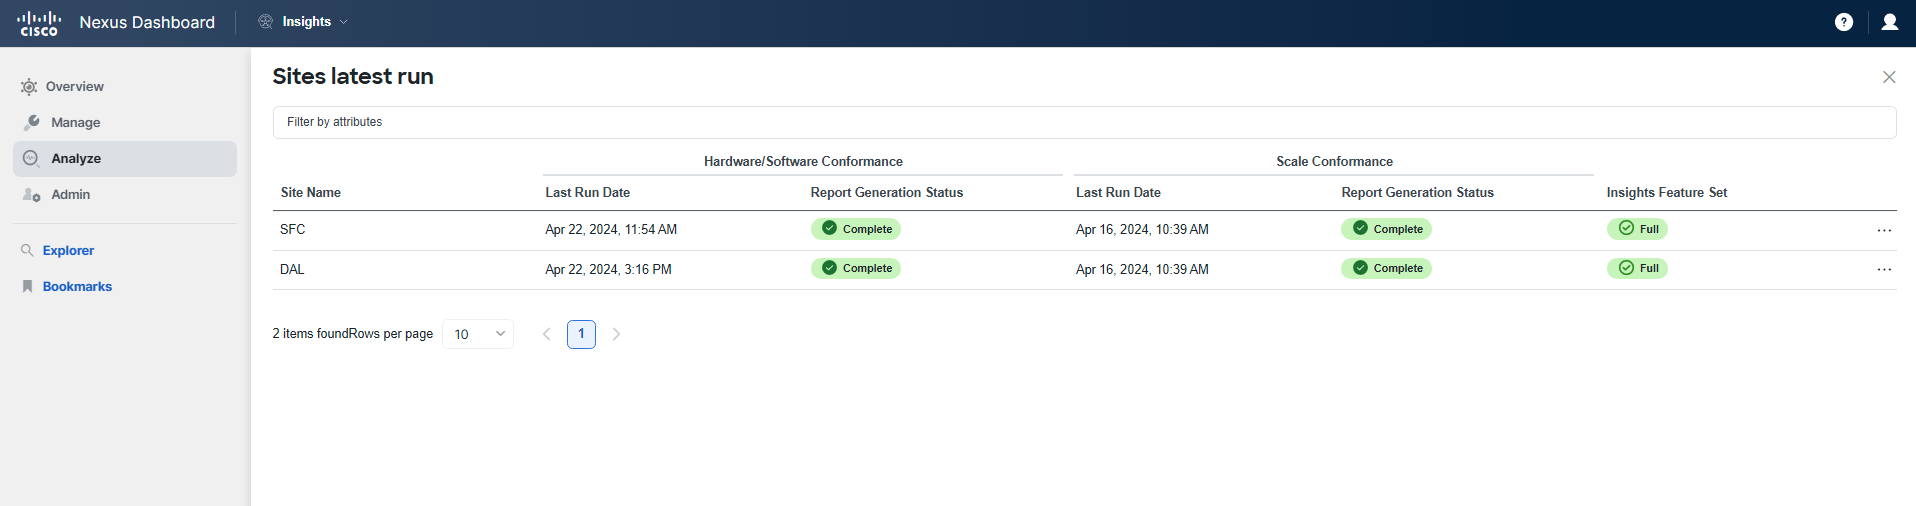
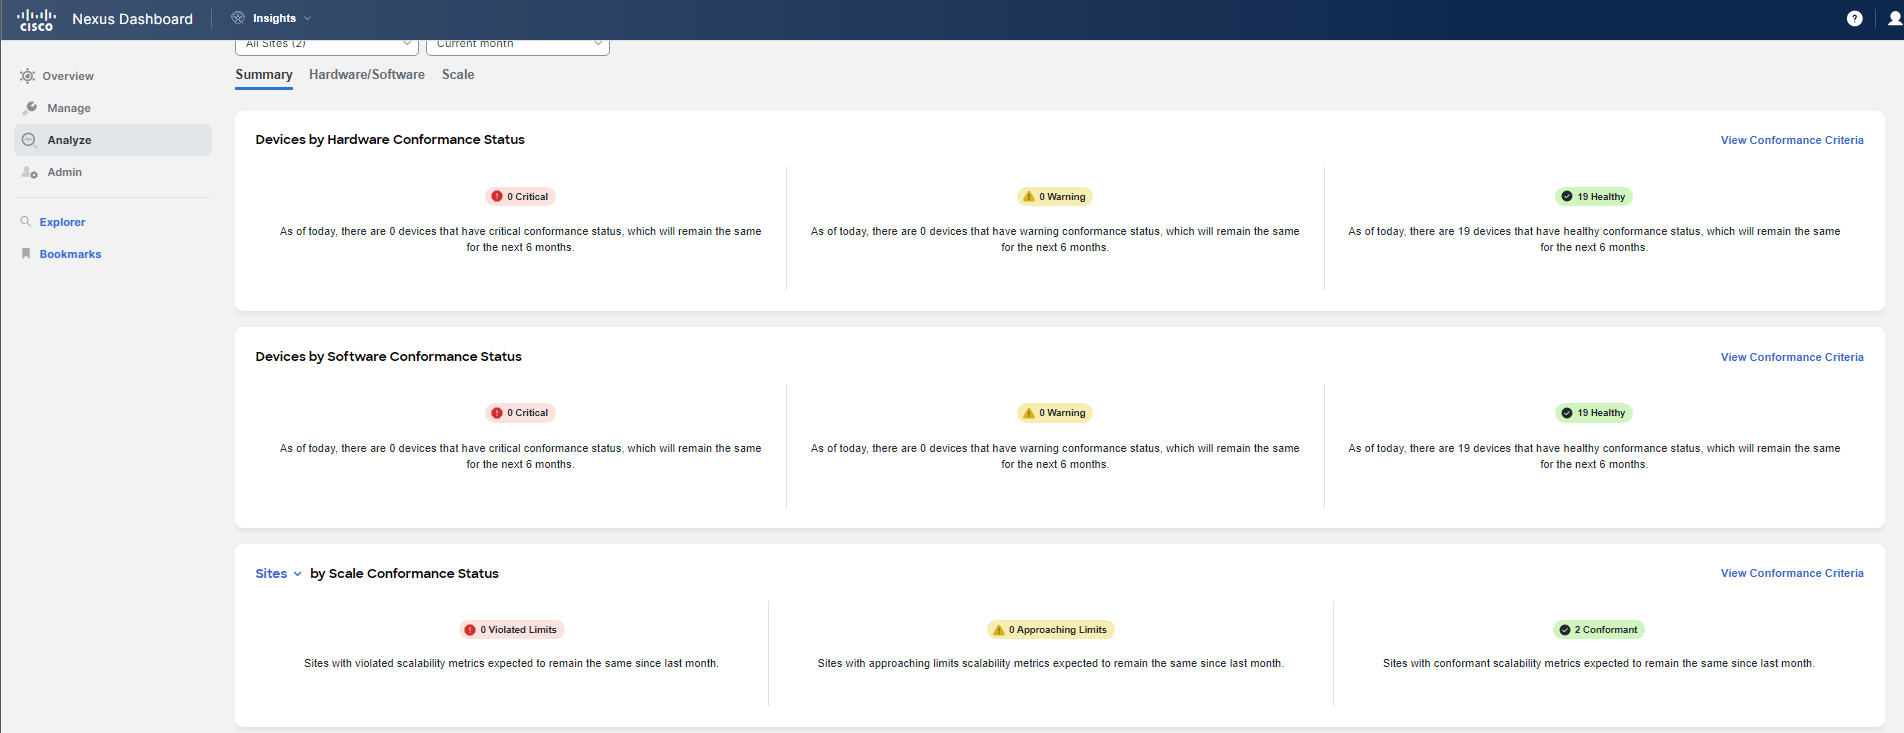
The first thing you will see is the Conformance Report header. Here, you can choose the view of your report by selecting the site(s), the current month, and then navigating between the main tabs - Summary, Hardware/Software, and Scale. You can click on View details to check when the reports were last run, their state, and to trigger the generation of new reports.
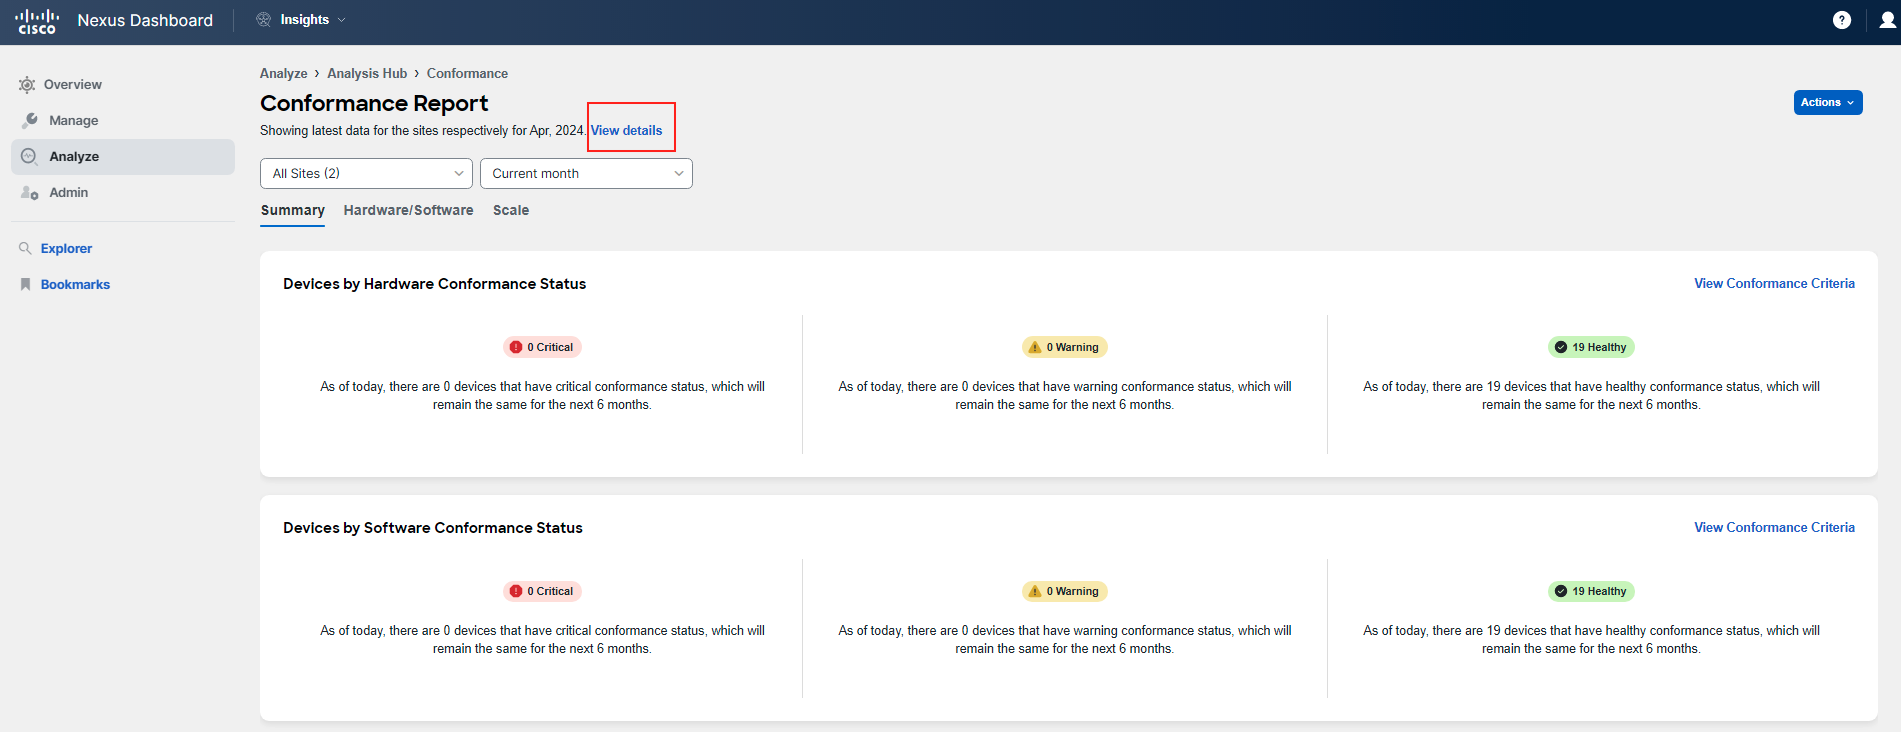
Then, you can scroll down to view the Summary for all three sections. As of today, you can see that everything is healthy or conformant.
Step 2
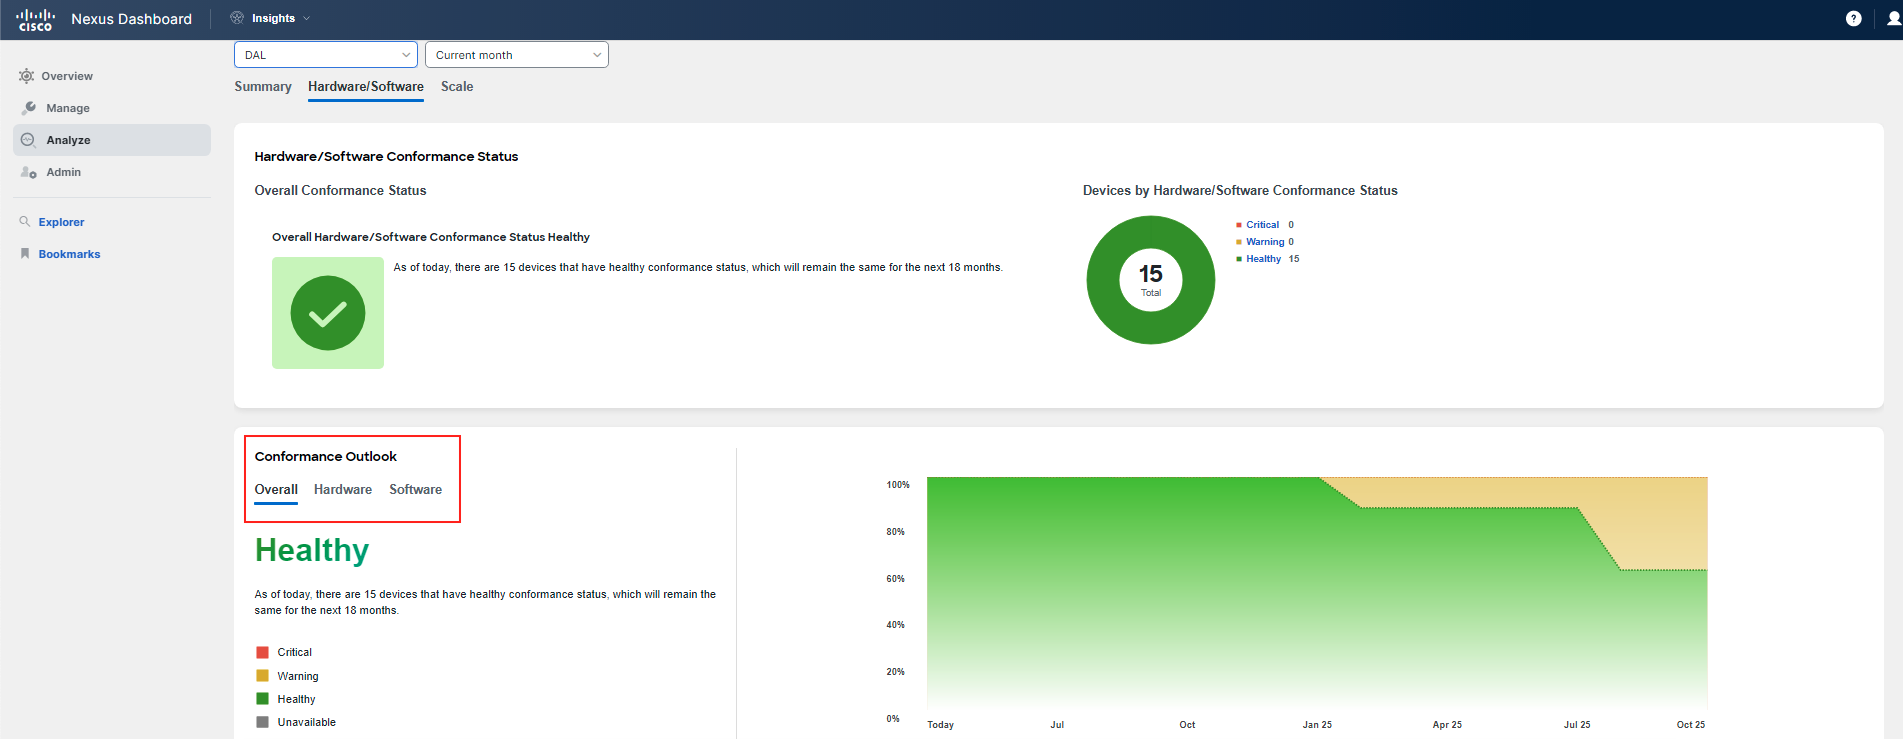
Let's begin the analysis so you can provide answers to your boss. Click on the Hardware/Software tab in the Conformance Report header. Then, select the DAL site, as for this use case, we will focus primarily on this site. Scroll down to examine further details. There are two main sections you will want to explore first - HW/SW Conformance Status and Conformance Outlook. Take a closer look at them.
Hint
You may want to change the view of the Outlook between - Overall, Hardware, and Software.
Step 3
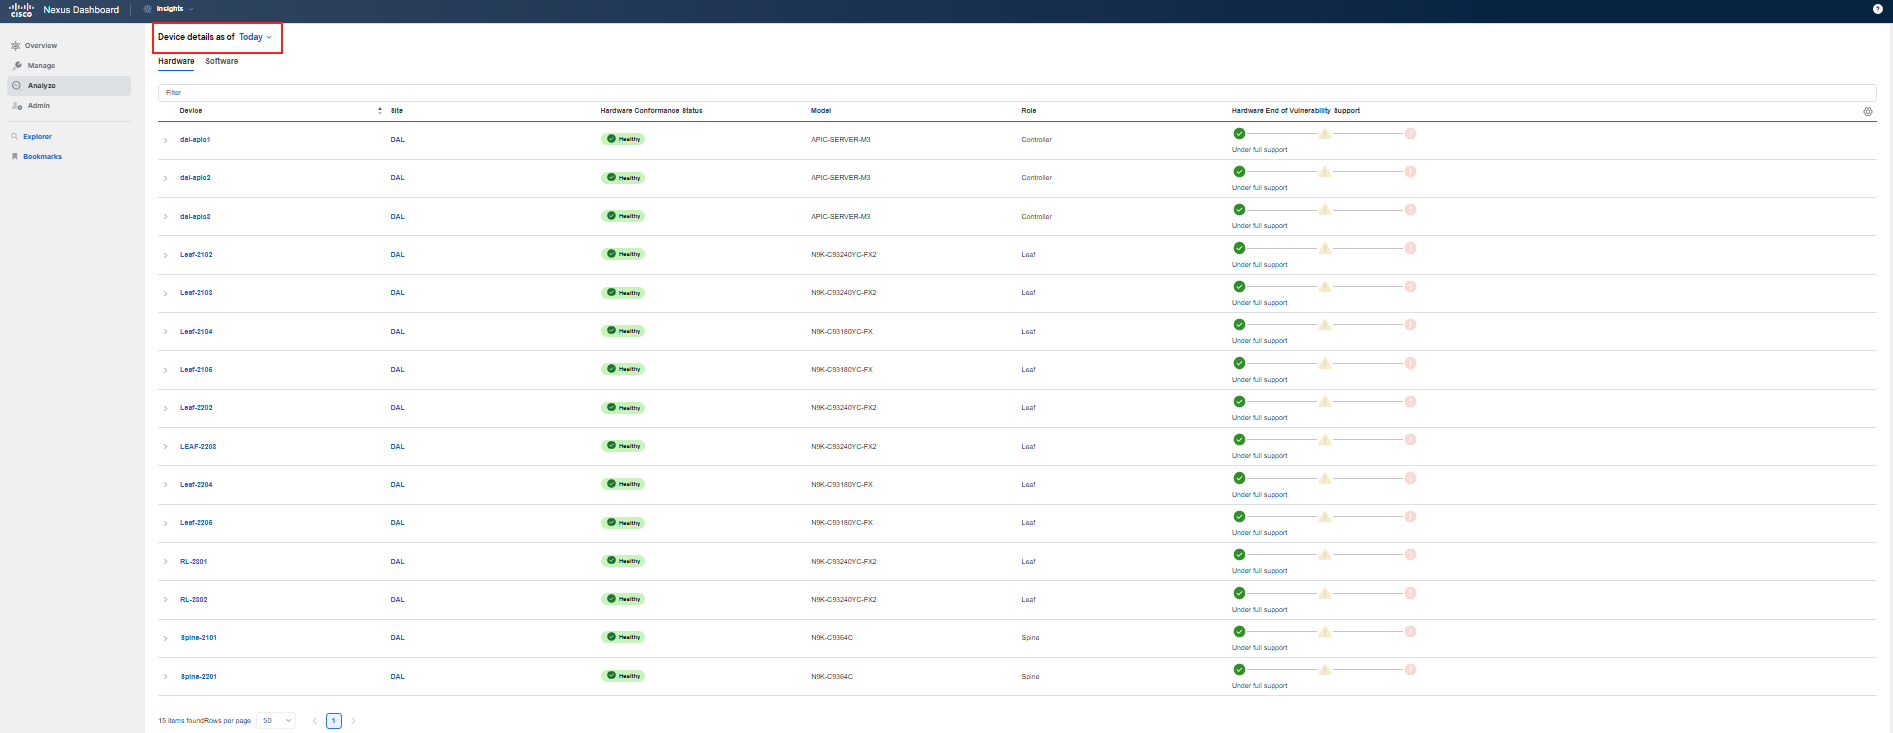
As you may have discovered, in 10 months and in 16 months from now (as of writing this guide), some devices (6) will transition from a healthy state to a warning state from a hardware perspective, thus reducing your overall conformance status. Scroll down to the Device details table, which references the current 'as of today' view. Examine both the Hardware and Software tabs.
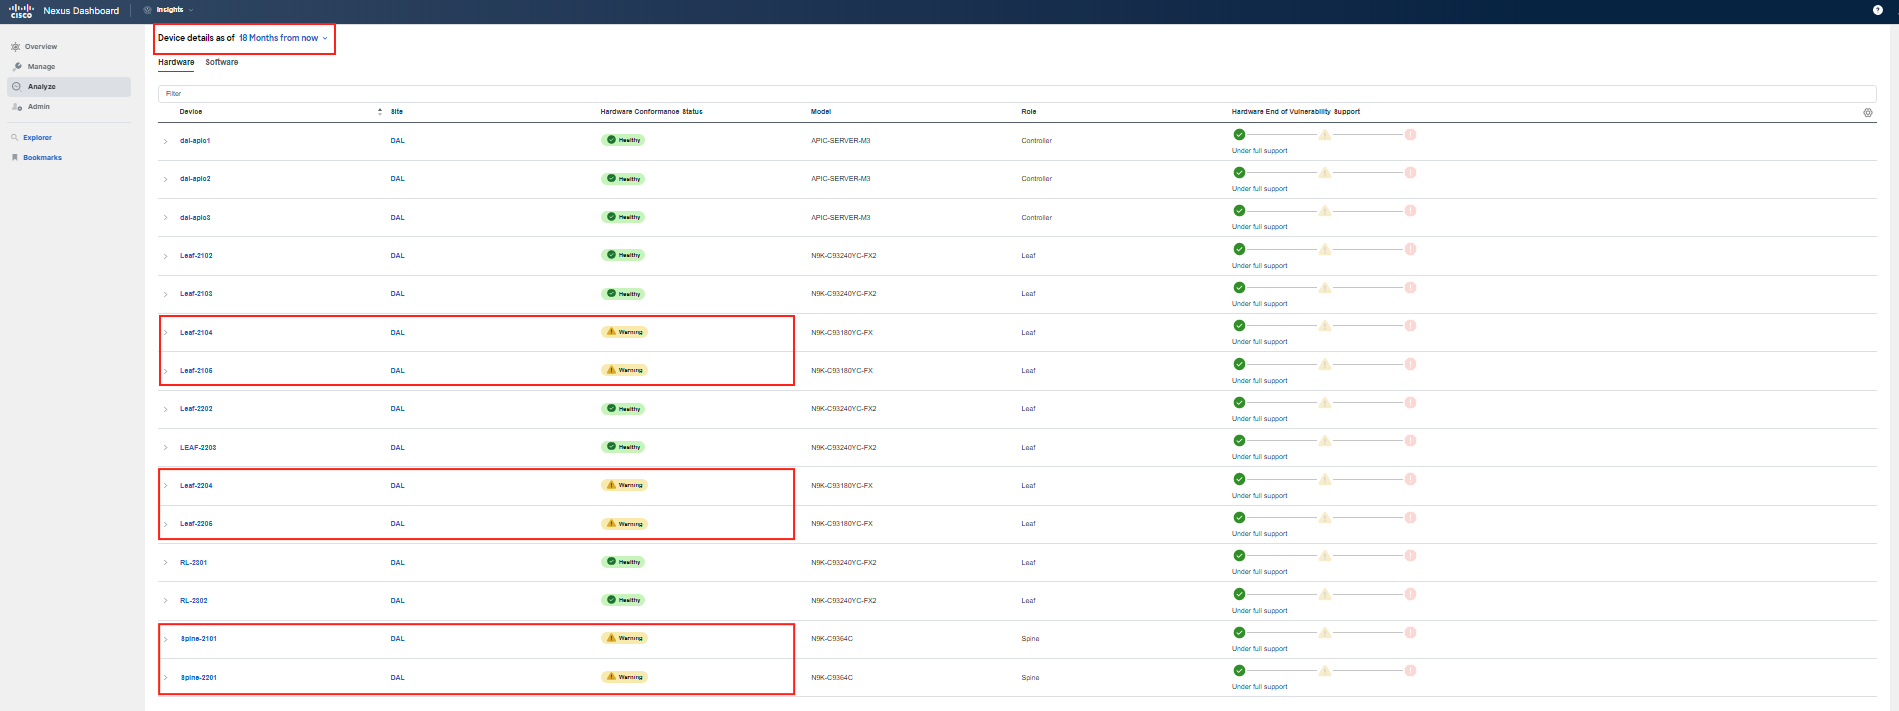
Change the view to "18 months from now", and review the entire table to understand the fabric state in the future.
Step 4
You have found that specific spine and leaf switches will require attention in the near future due to the End of PSIRT Support Date. You can click on the individual spines to get more details from the perspective of individual parts (linecards, PSUs, Fans, etc.). You can also toggle between the Hardware and Software tabs for an '18 months from now' view to perform your analysis.
Step 5
At this point, you have the basic information needed for your analysis. To gain more detailed insights into what's happening, proceed to the Advisories section by navigating to Analyze > Advisories.
Step 6
As soon as you arrive at the Advisories section, you will notice that there are two Hardware Advisories announced by Cisco concerning the Nexus 9332C and 9364C, 93180YC-FX, and 93108TC-FX line of switches.
Note
Keep in mind that we are focusing on the DAL ACI site for this use case. Edit the filter to include 'Site == DAL' and 'Category == Hardware EOL'.
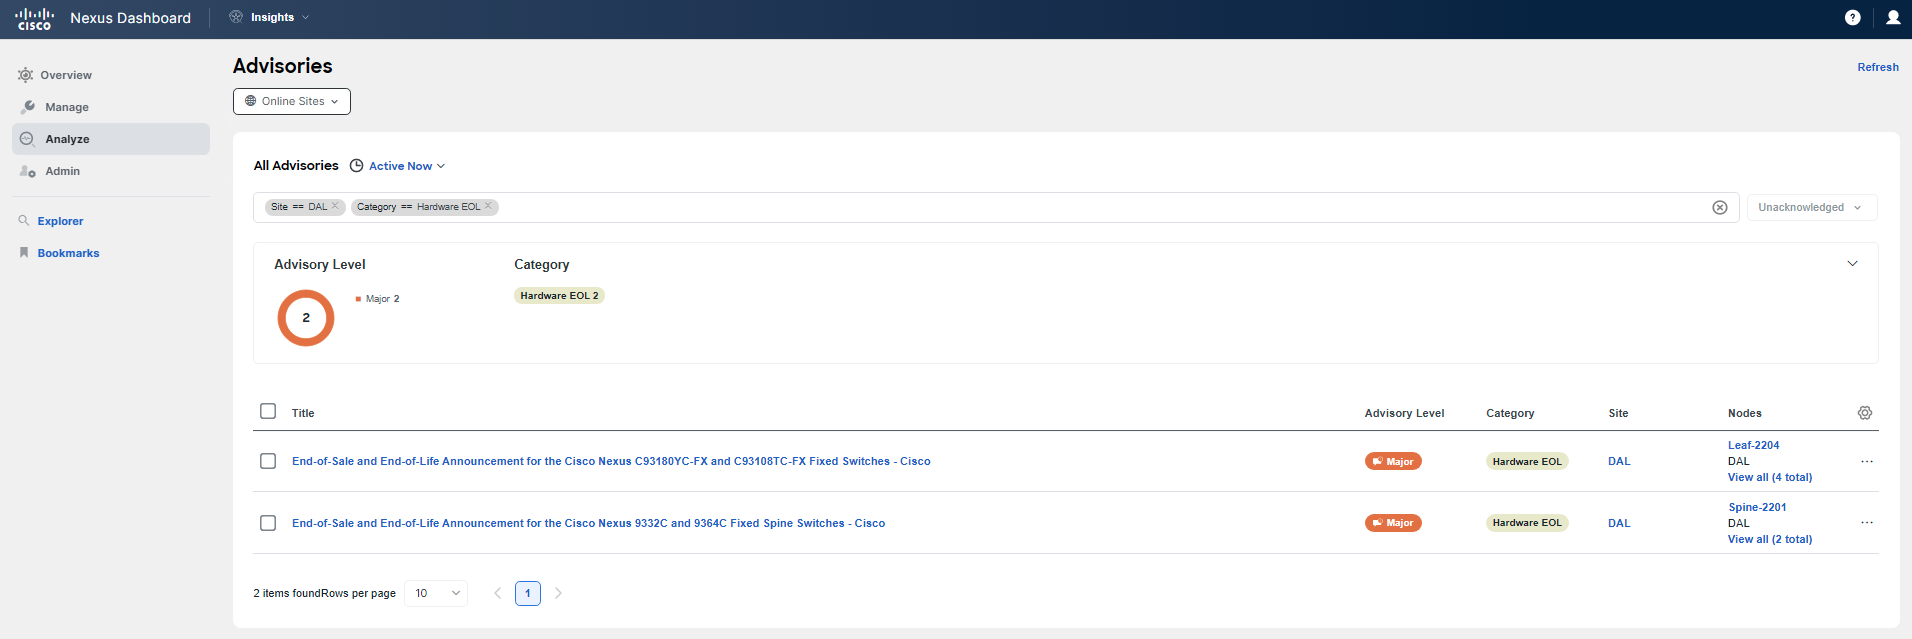
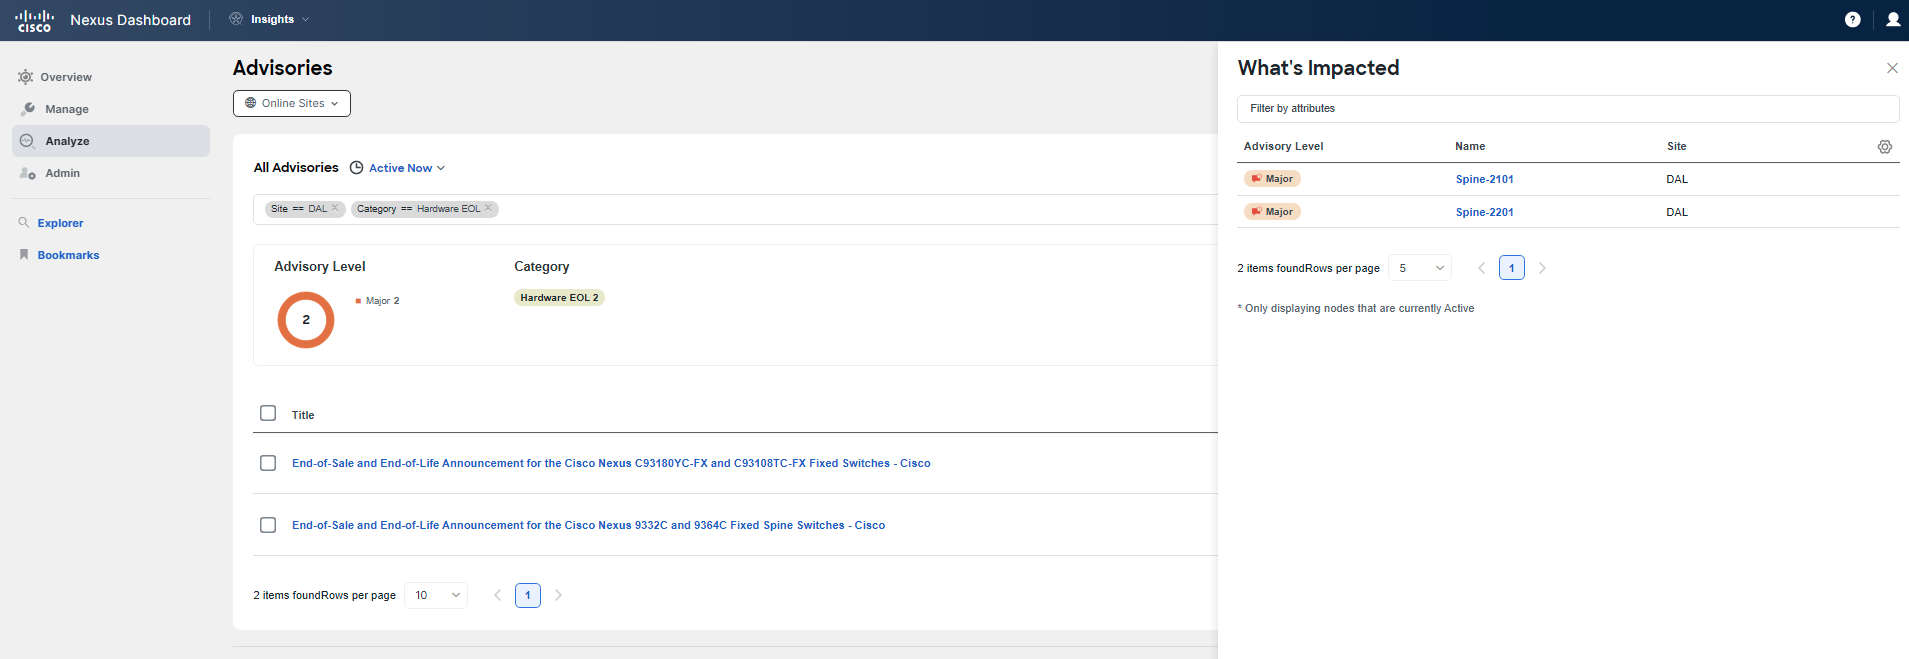
Click on the one of the advisories or on View all under Nodes to investigate, and to get more information.
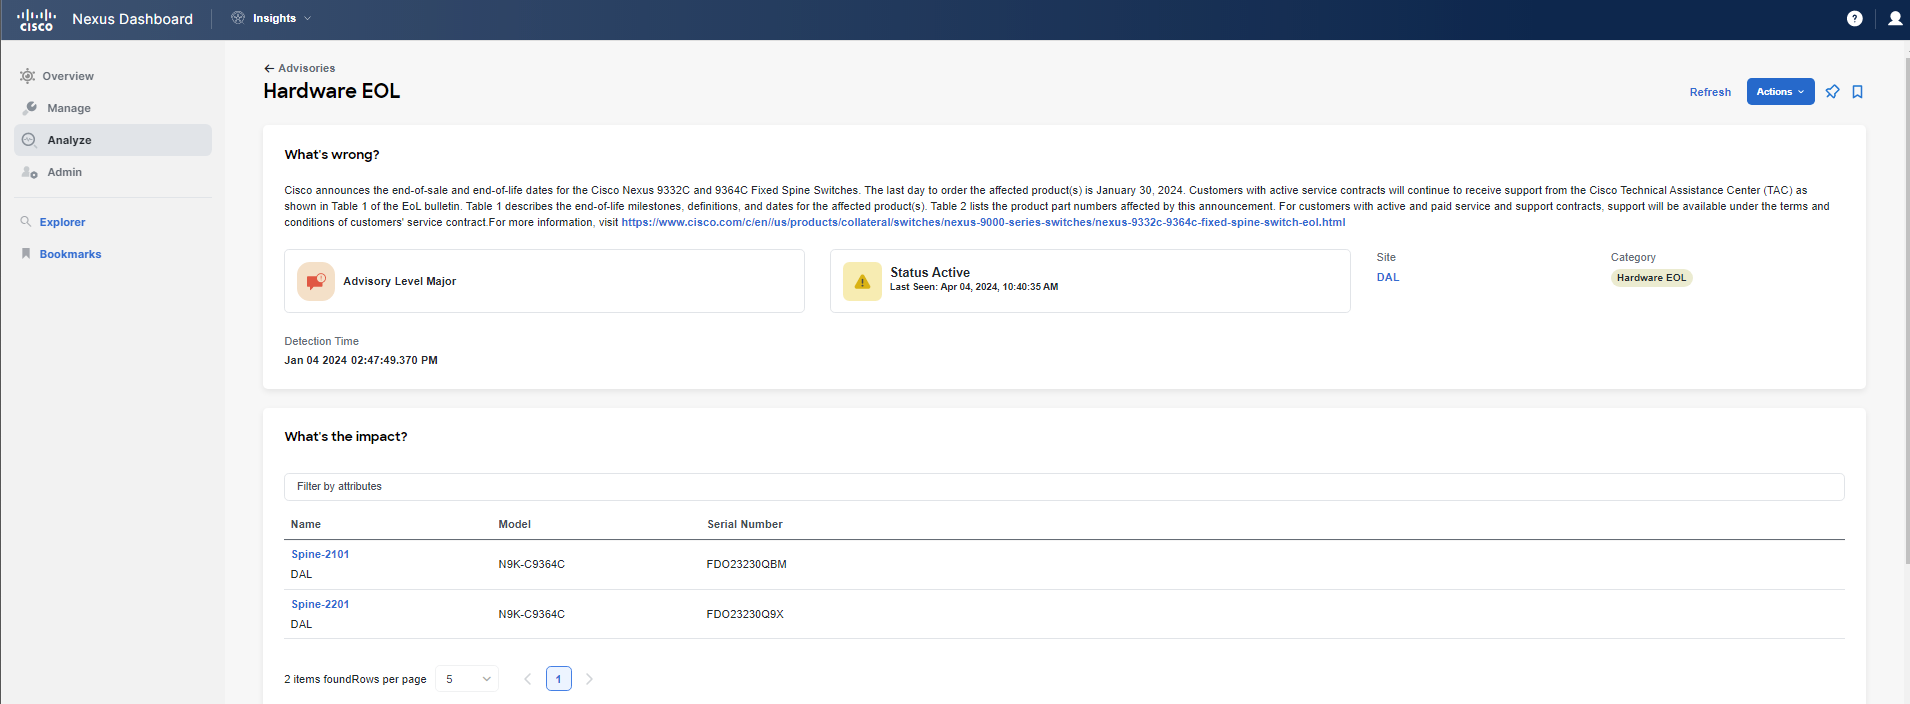
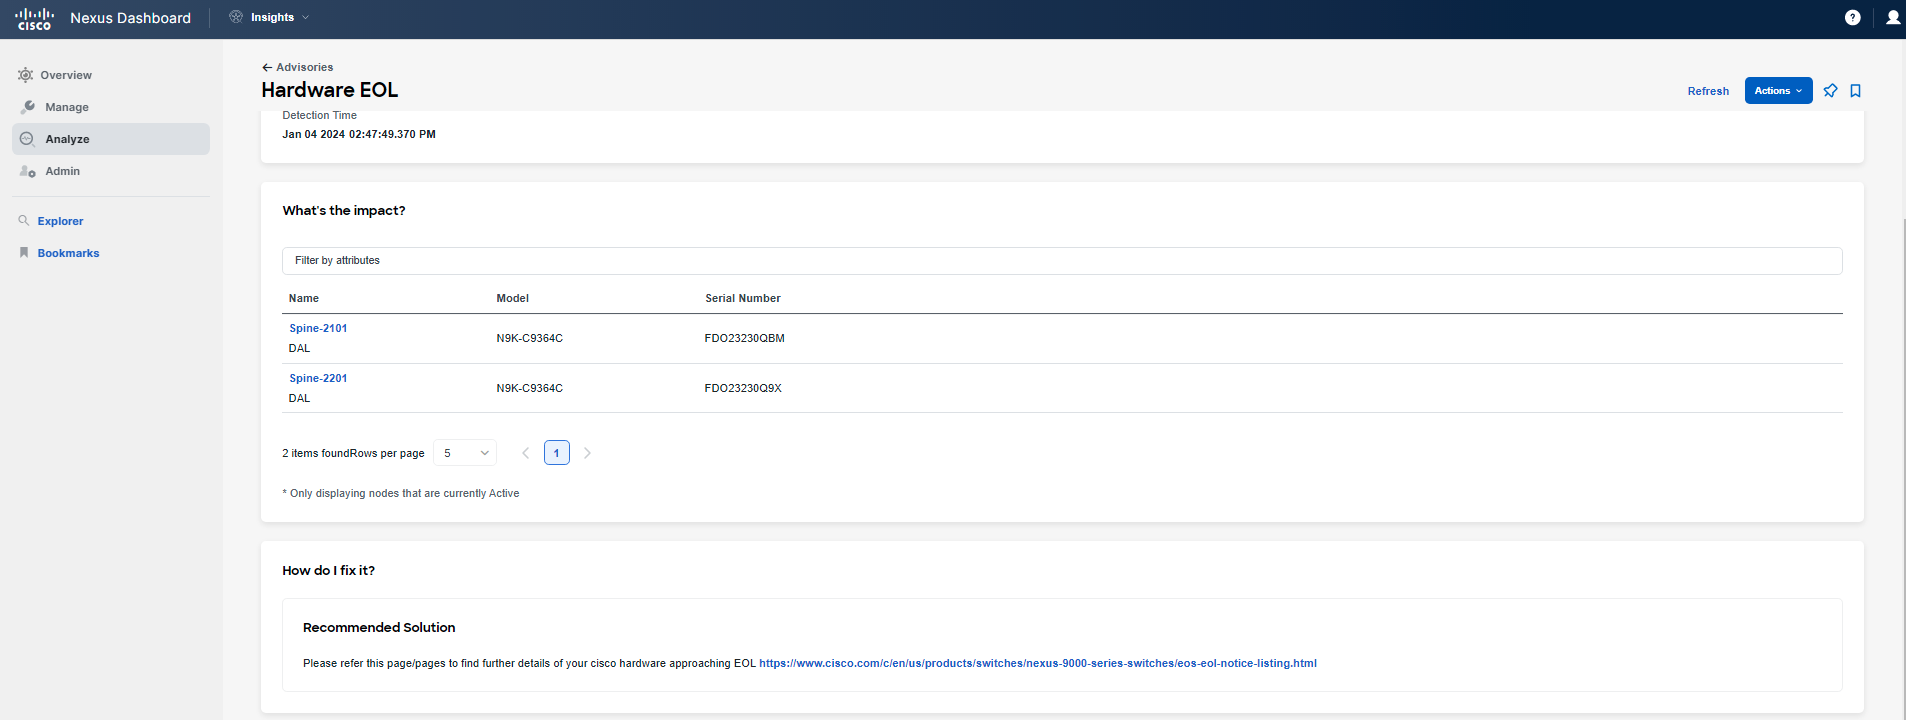
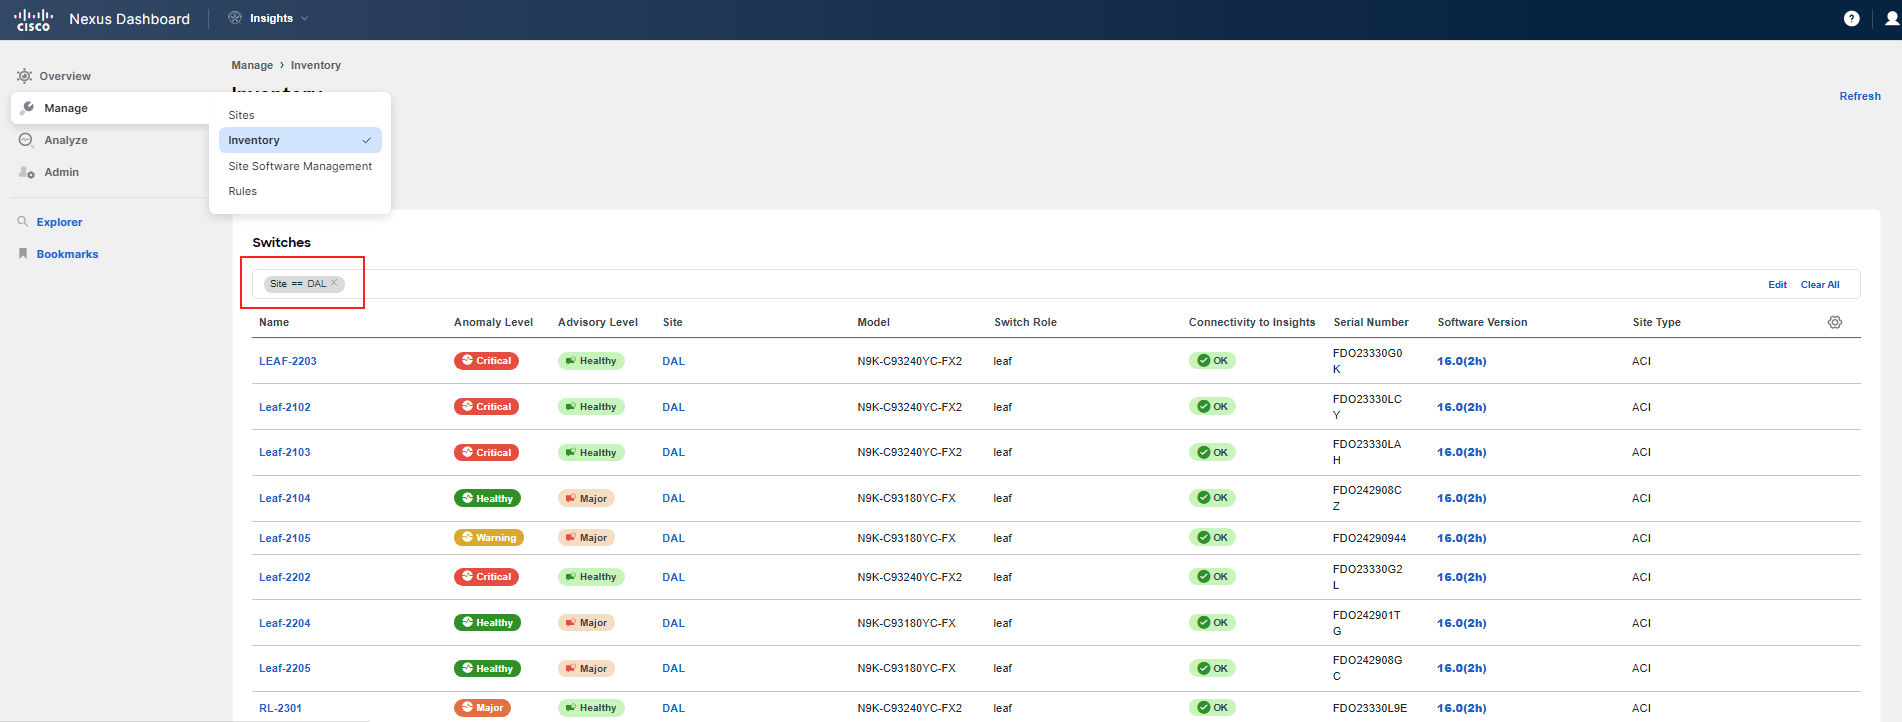
Repeat the same process for any other advisories. Be sure to also check the official Cisco web pages linked in the advisories for more comprehensive information. Nexus Dashboard Insights provides you with targeted End-of-Life (EoL) announcements. Additionally, you may want to review the entire inventory of your ACI fabric site by navigating to Manage > Inventory and examining both the Controllers and Switches tabs. Here you will find the overall Advisory Level and Model information for each particular switch.
Step 7
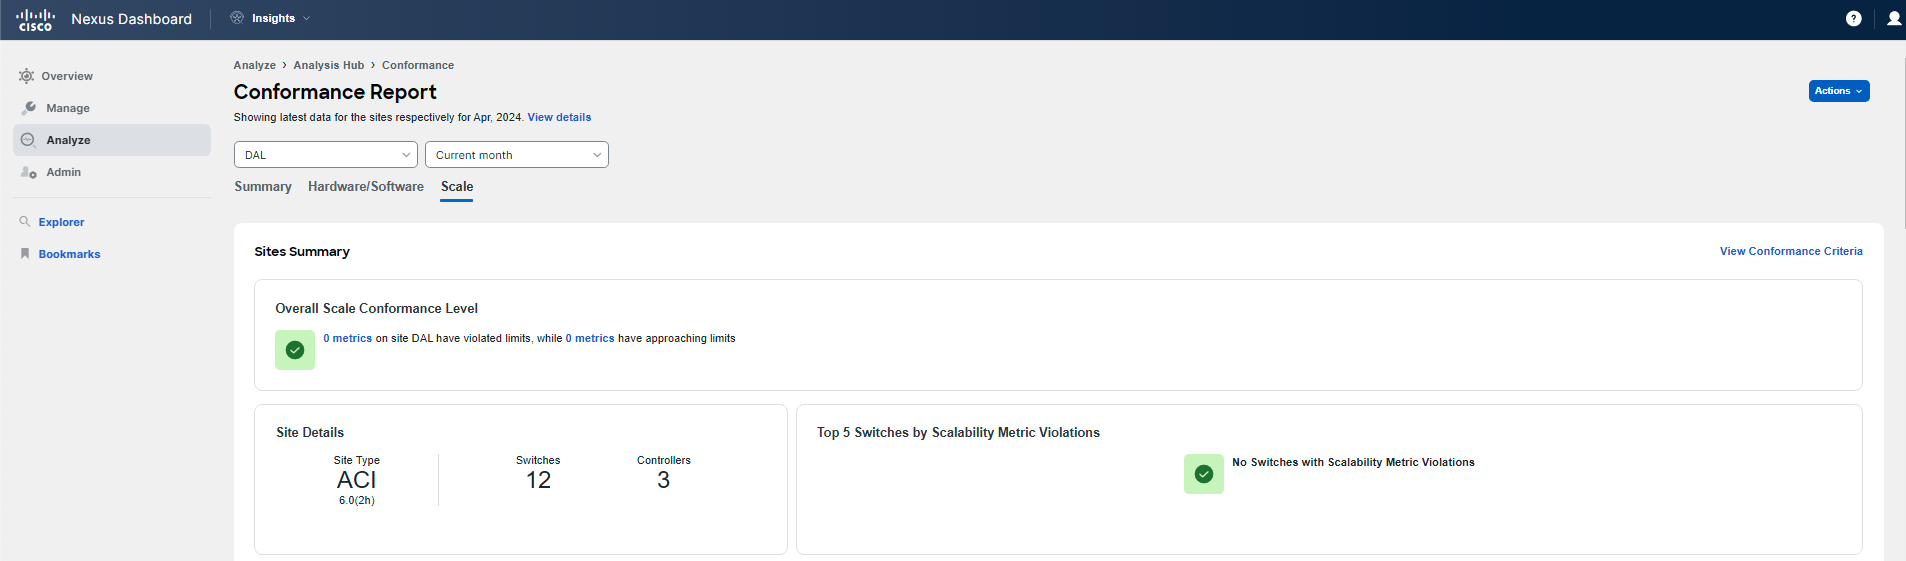
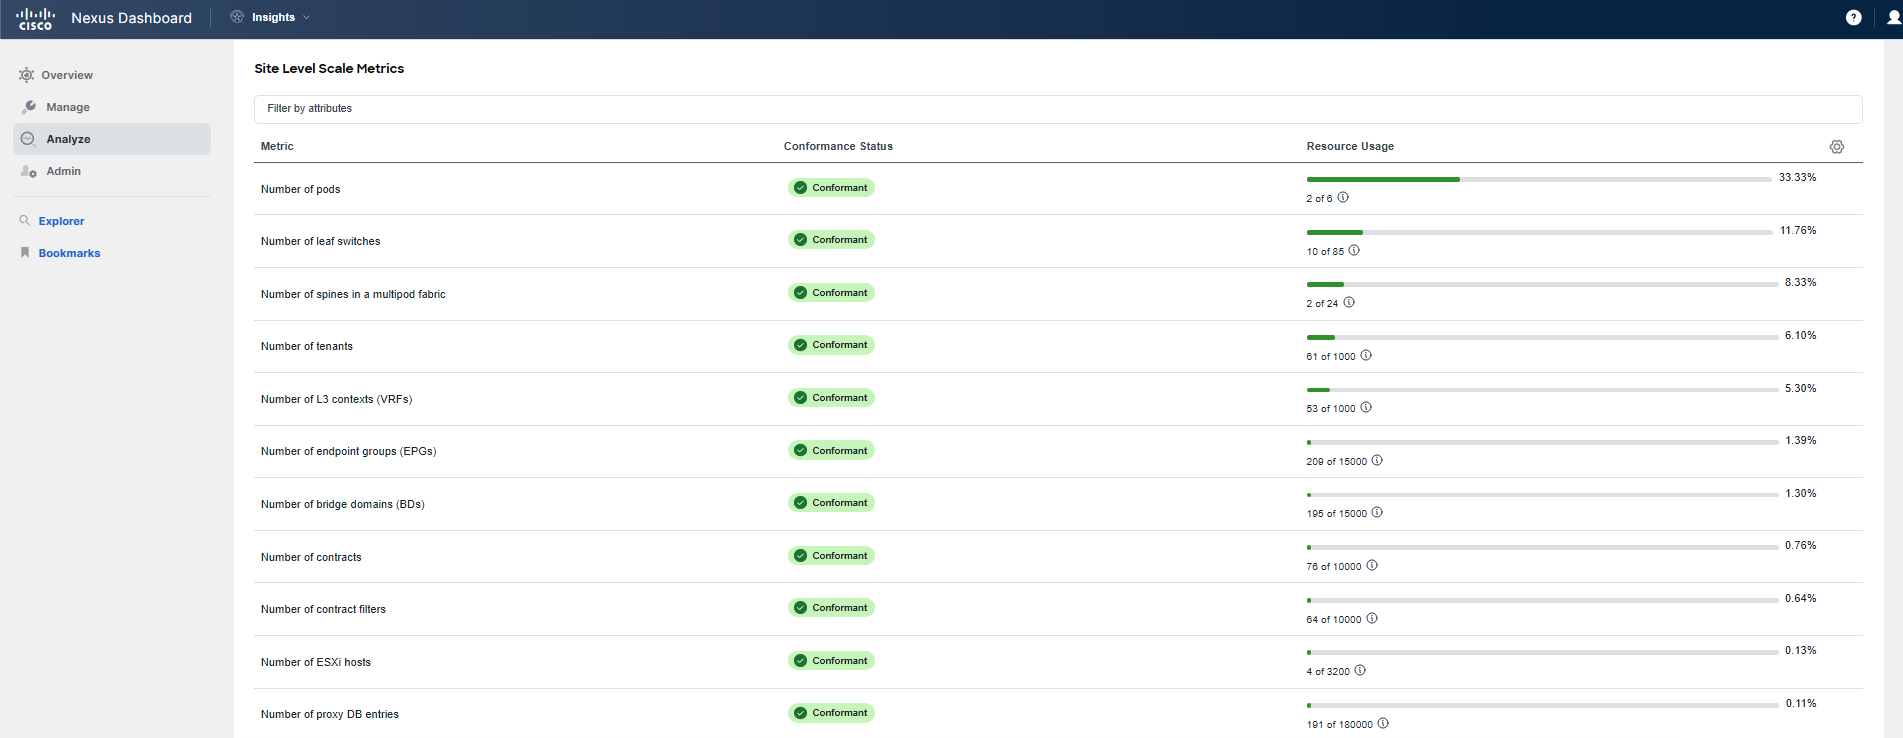
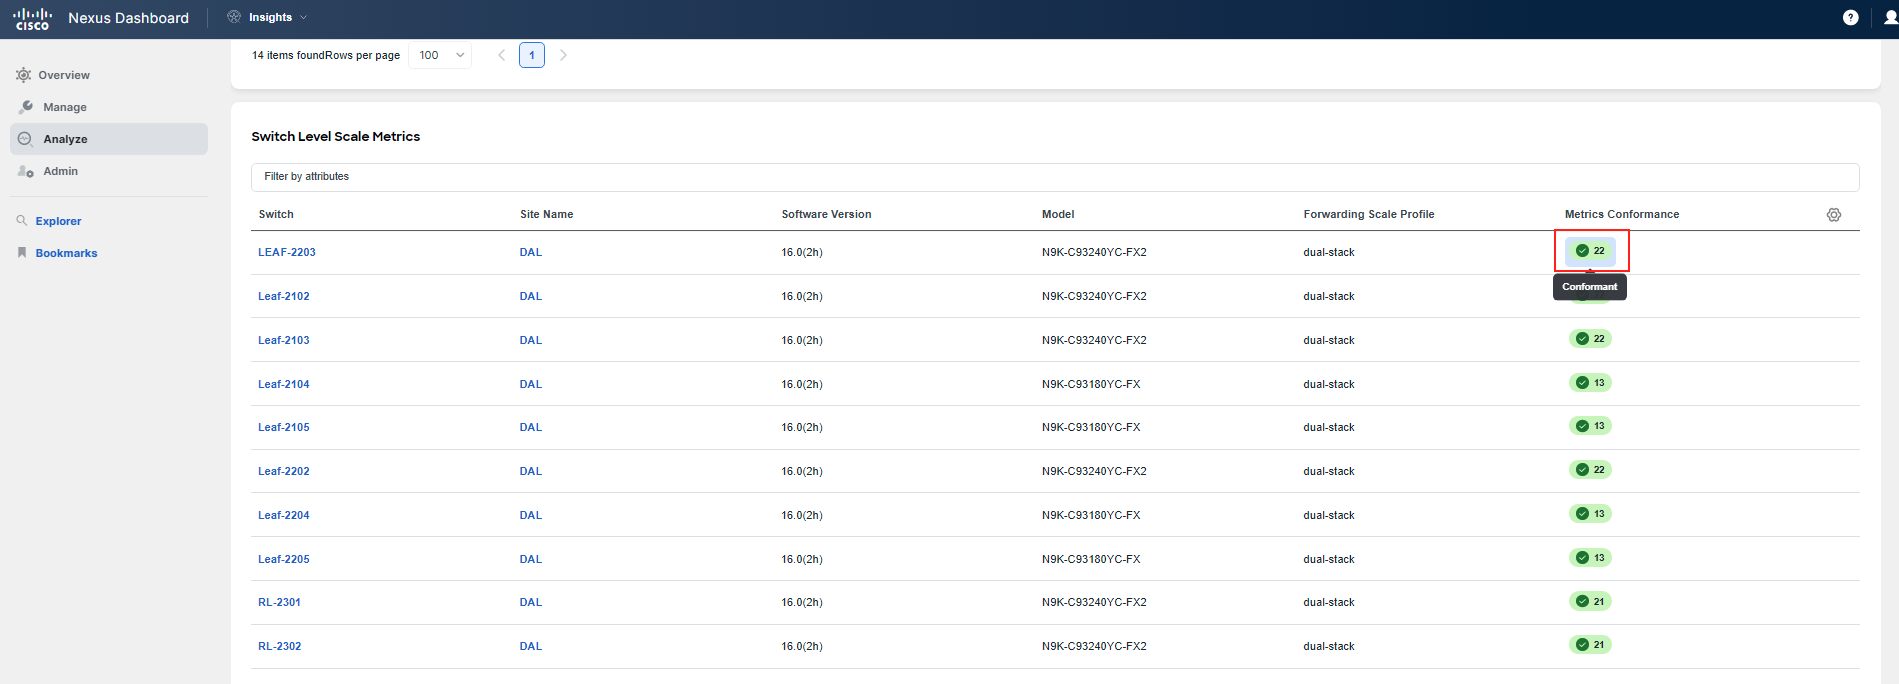
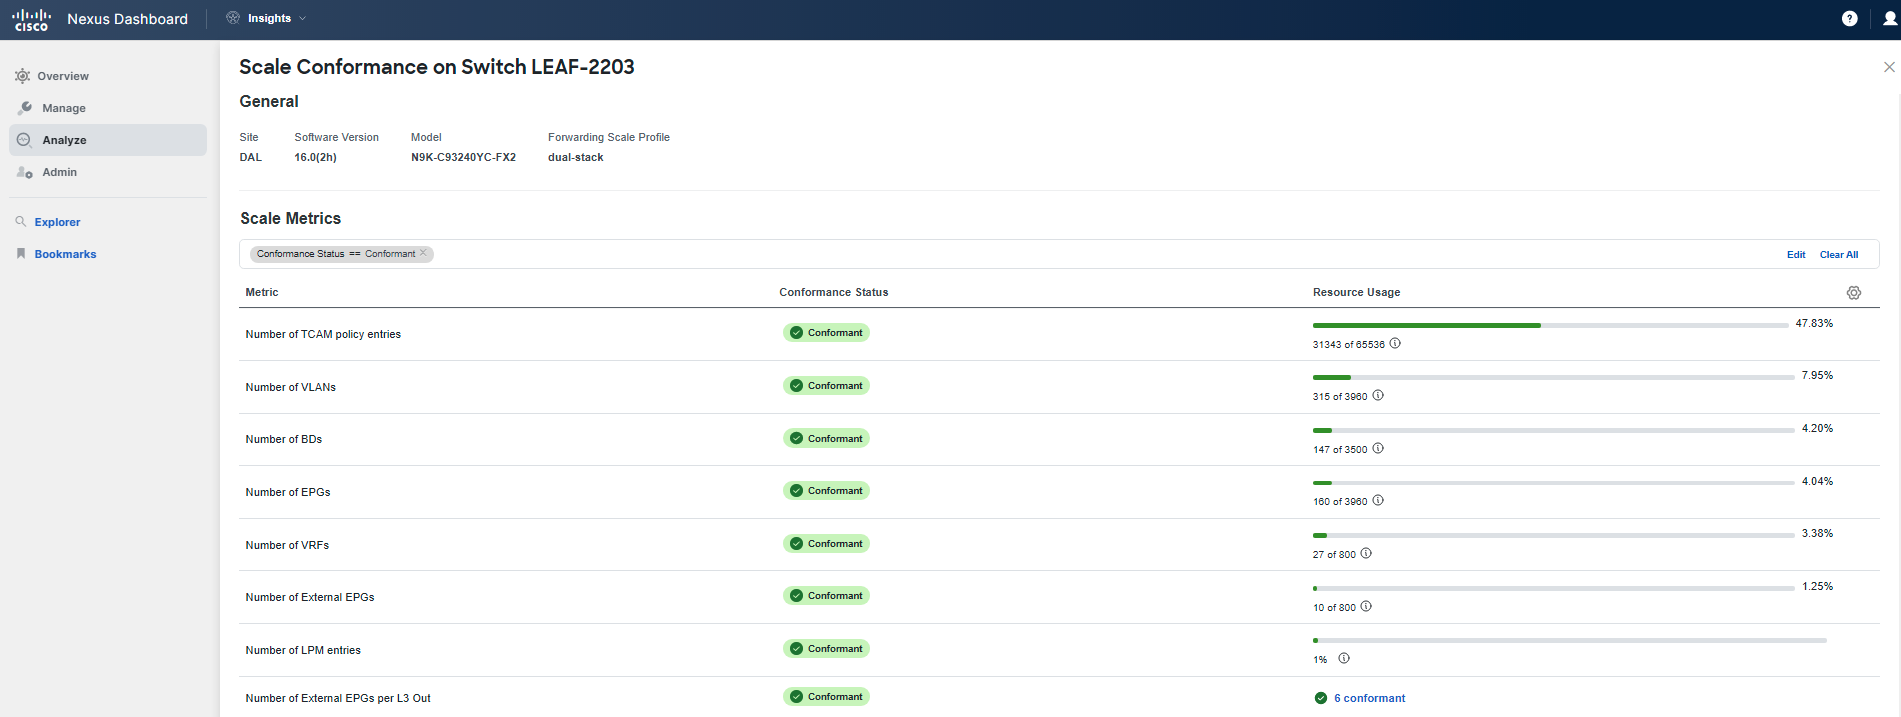
To perform the final check for your task, head back to Conformance, and click on the Scale tab.
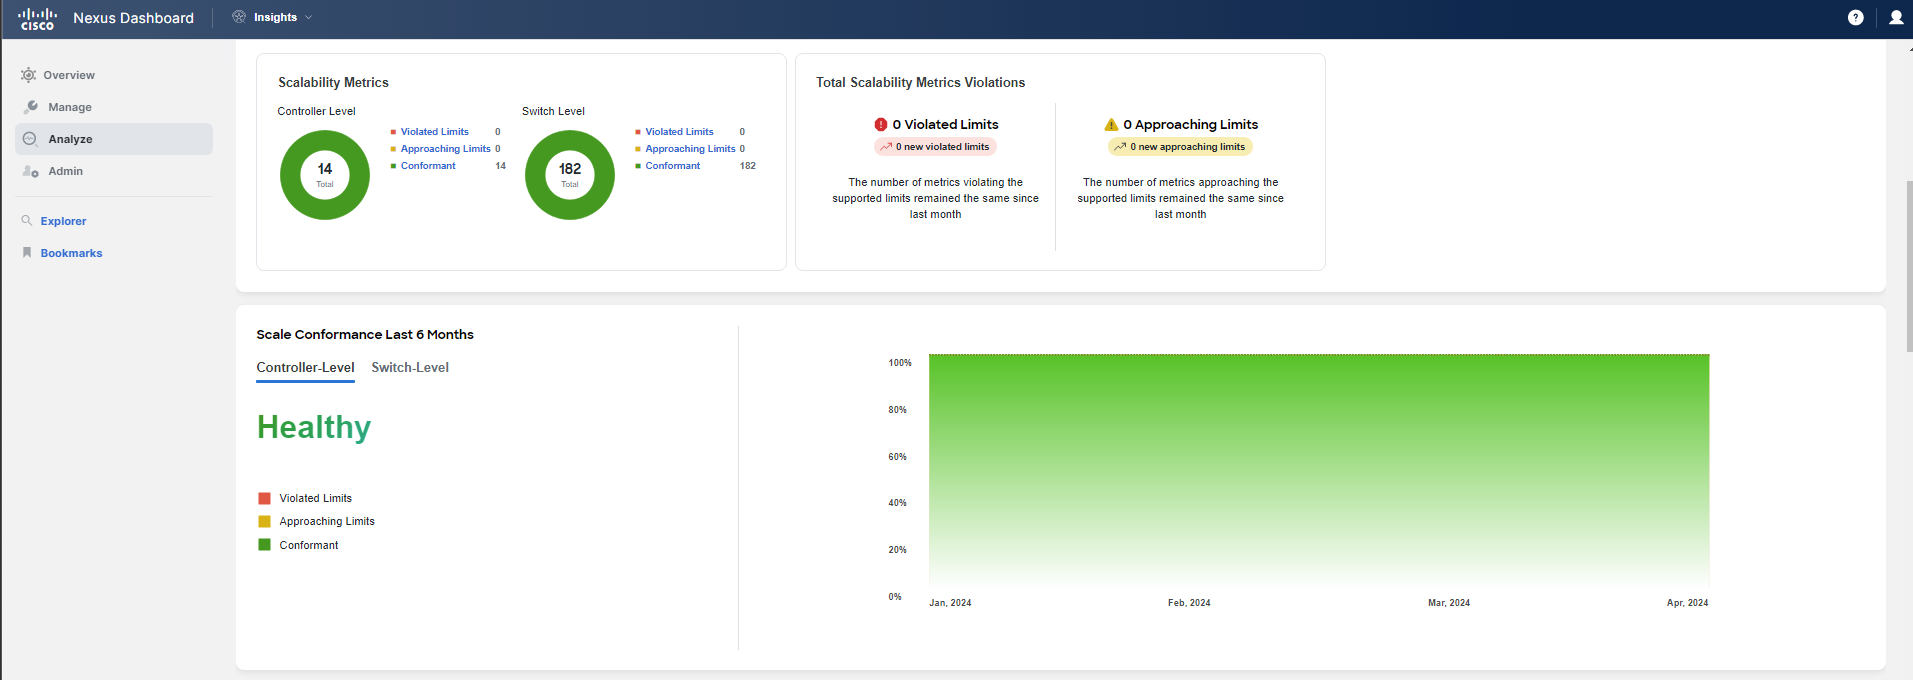
Here, you can determine if your ACI fabric utilization is within the tested scale for various metrics such as the number of leaf switches, number of tenants, number of contracts, or number of L4-L7 devices. Scroll down and investigate the details. This will provide you with the necessary information to assess whether any changes, replacements, or expansions would be required now or in the near term future.
Note
It is recommended to incorporate Scale Conformance Report checks into your routine, particularly during periods of frequent network changes, such as migrations, to monitor how well you are maintaining compliance with supported scale guidelines.
With the help of all this valuable information and Nexus Dashboard Insights, you have completed the first part of your analysis and report. You will continue in one of the subsequent use cases to gather further data on resource utilization, Policy CAM utilization, and available capacity in the Resource Utilization and Capacity Planning use case.
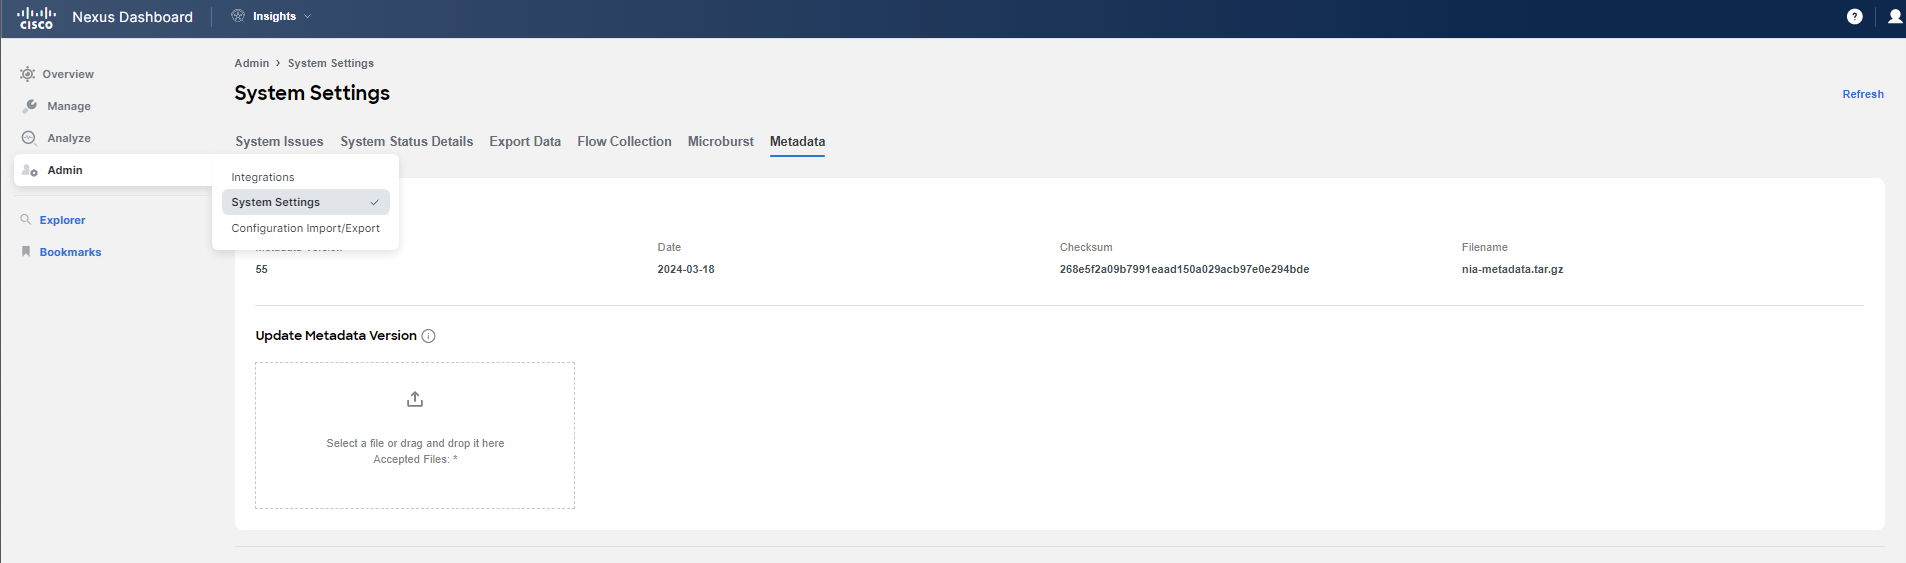
Note
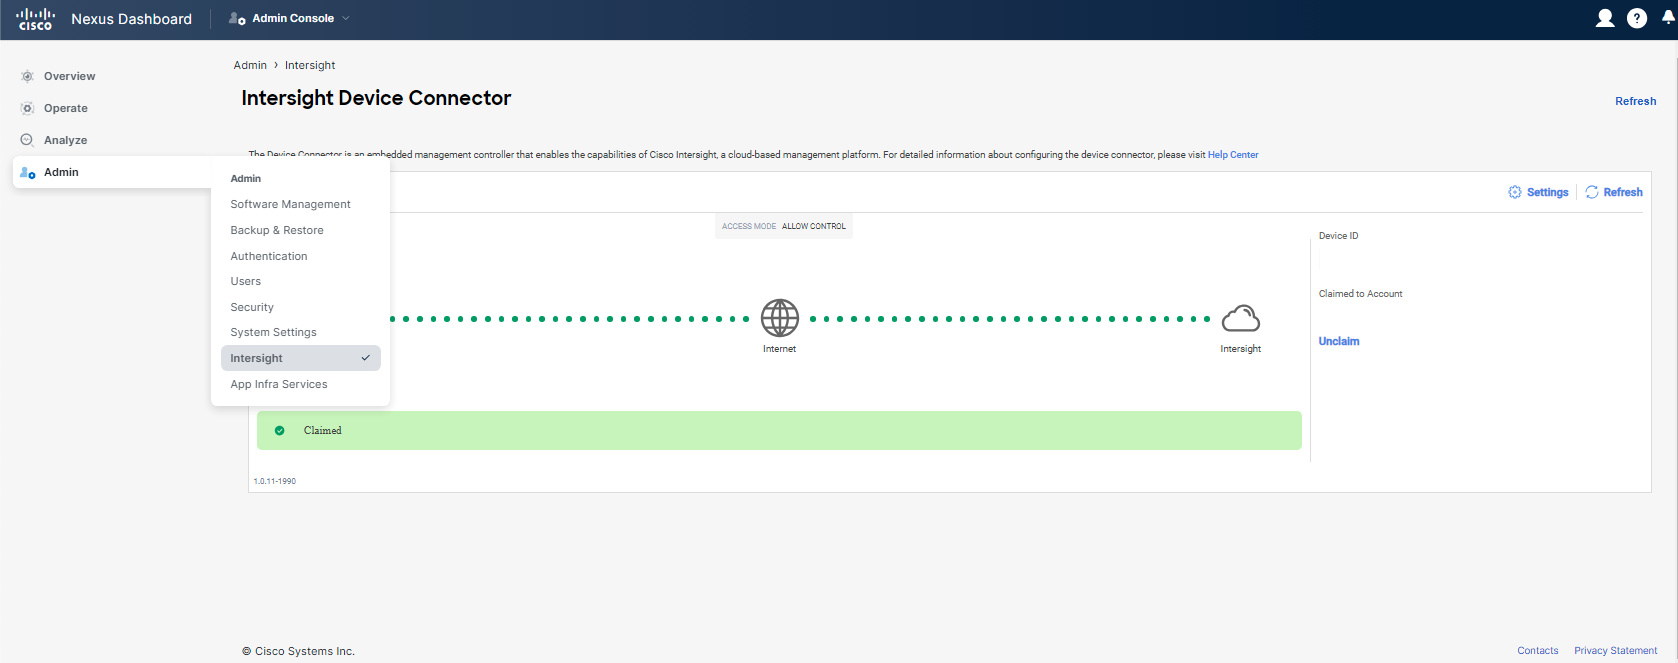
It is important to keep the metadata of Nexus Dashboard Insights current by claiming the Nexus Dashboard cluster on Intersight. This ensures that Nexus Dashboard Insights can provide accurate and detailed information. It is recommended to perform this action on your Nexus Dashboard. The screenshots below illustrate how it should appear.
You are now ready to move on to the next use-case.