Use-Case 3 - Resource Utilization
Resource Utilization and Capacity Planning
In this use case, you will explore how Nexus Dashboard Insights helps administrators proactively determine the resource utilization across the entire fabric and perform capacity management and planning in a simpler manner. It is linked with the Hardware/Software & Scale Conformance use case, so you will be continuing your work.
Nexus Dashboard Insights provides visibility into the resource utilization per fabric, controller, and switch, in three different areas:
- Operational resources: This includes the entries being consumed in each of the hardware and software tables the switches use to perform forwarding functions: MAC entries, IP entries, LPM, or Policy TCAM are some examples.
- Configuration resources: This includes the number of objects configured on the controller and pushed to the switch: VRF, BD, EPG, or VLAN are some examples.
- Interface resources: This includes the interface and bandwidth utilization per switch.
Compared to the Capacity Dashboard in Cisco APIC, Nexus Dashboard Insights provides not only the current values of these parameters but also historical evolution and trend information.
Scenario
Your manager is working on CAPEX needs estimations for next year. He has requested an update on the current utilization of the fabric, especially in terms of port utilization, bandwidth, and critical resources such as TCAM. The company leadership has informed that CAPEX will be very restricted in the upcoming 12-18 months, and therefore, your boss wants to be sure you can accommodate upcoming projects.
Your boss is going to send you the estimated port count to be allocated for upcoming projects next year, but to be prepared, you want to understand the current utilization on the fabric. Hence, you are going to review the following information:
- Ports available in the fabric and per switch.
- Number of available BD/EPG/VLANs that can be allocated in the worst-case scenario.
- Policy TCAM entries available per switch in the worst-case scenario.
Additionally, if any TCAM optimization can be done, you want to proactively inform your manager about it.
Solution
Step 1
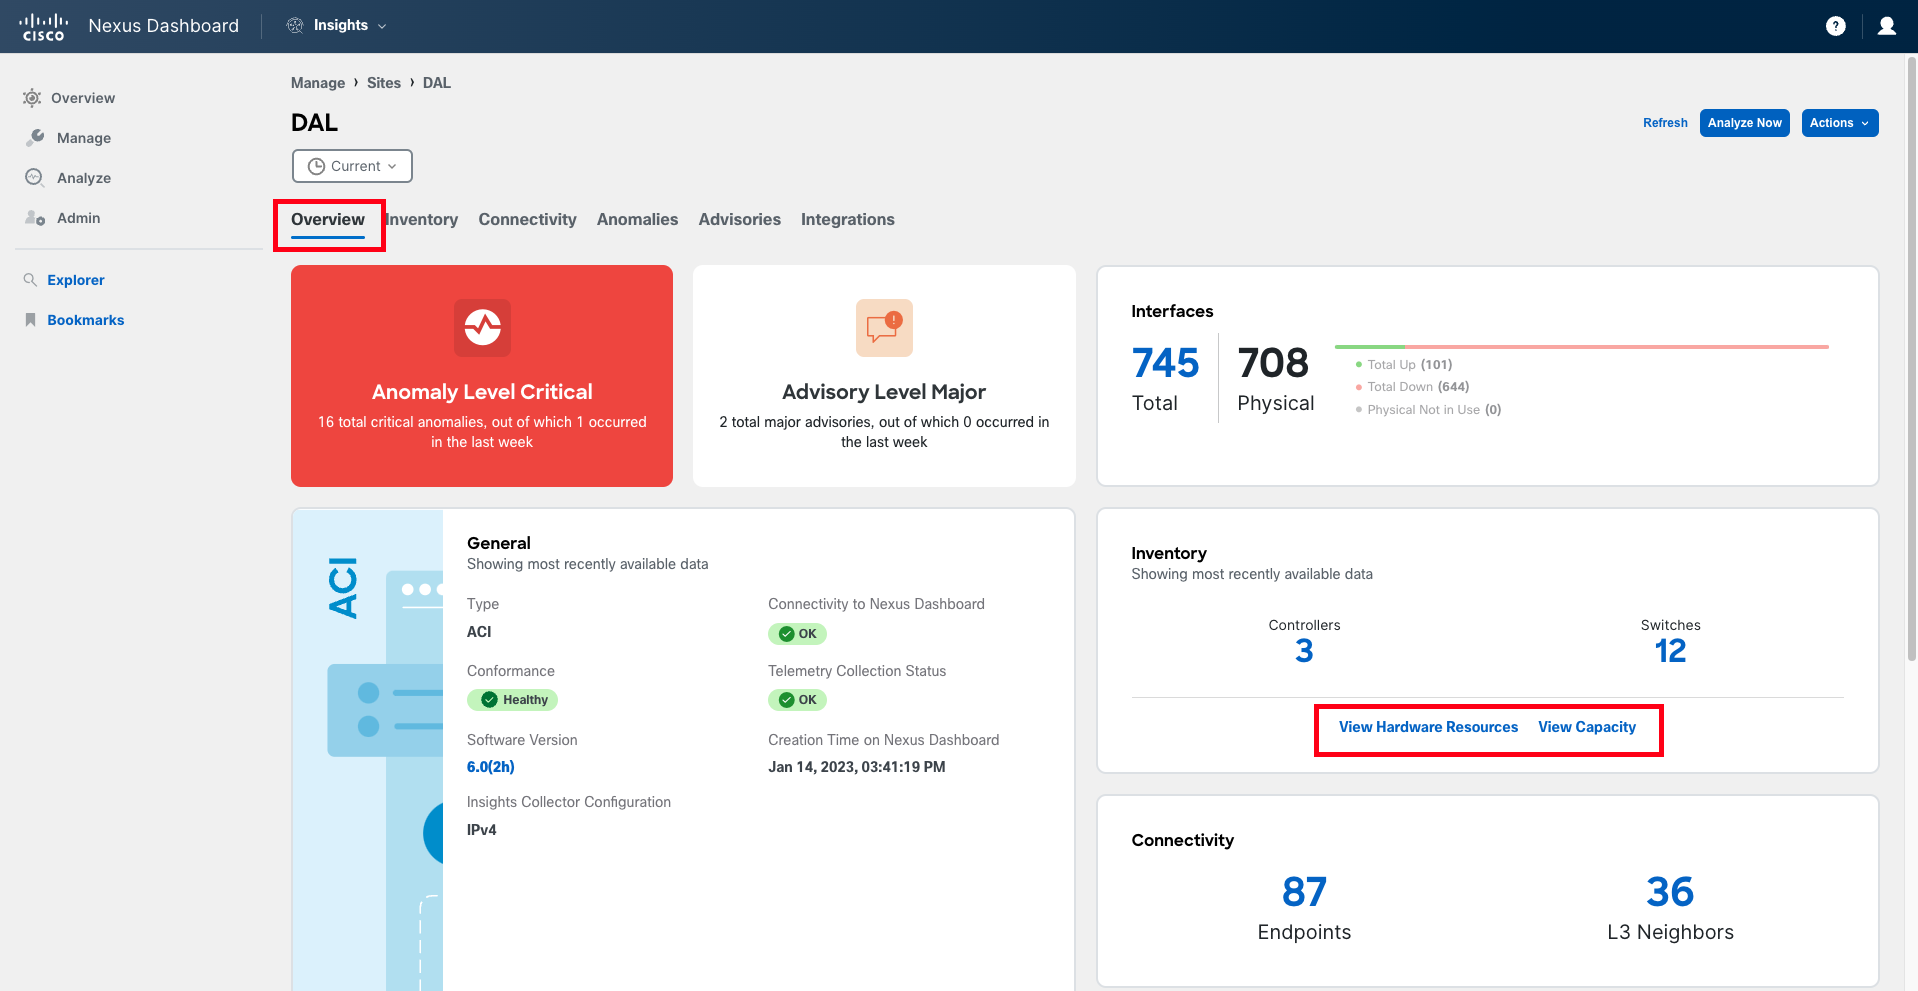
Resource utilization and capacity available can be obtained from the site view. Therefore, navigate to Manage > Sites > DAL (Dallas) > Overview. Once you are on the overview page, scroll down and find the Inventory panel. There, you will see two links to navigate to either Hardware Resources utilization or Capacity utilization information.
Step 2
Click on View Hardware Resources. A side panel will open that will show you information about CPU, memory, storage, power consumption, and other environmental details for each device in the fabric, both in a time-series format and in a tabular representation.
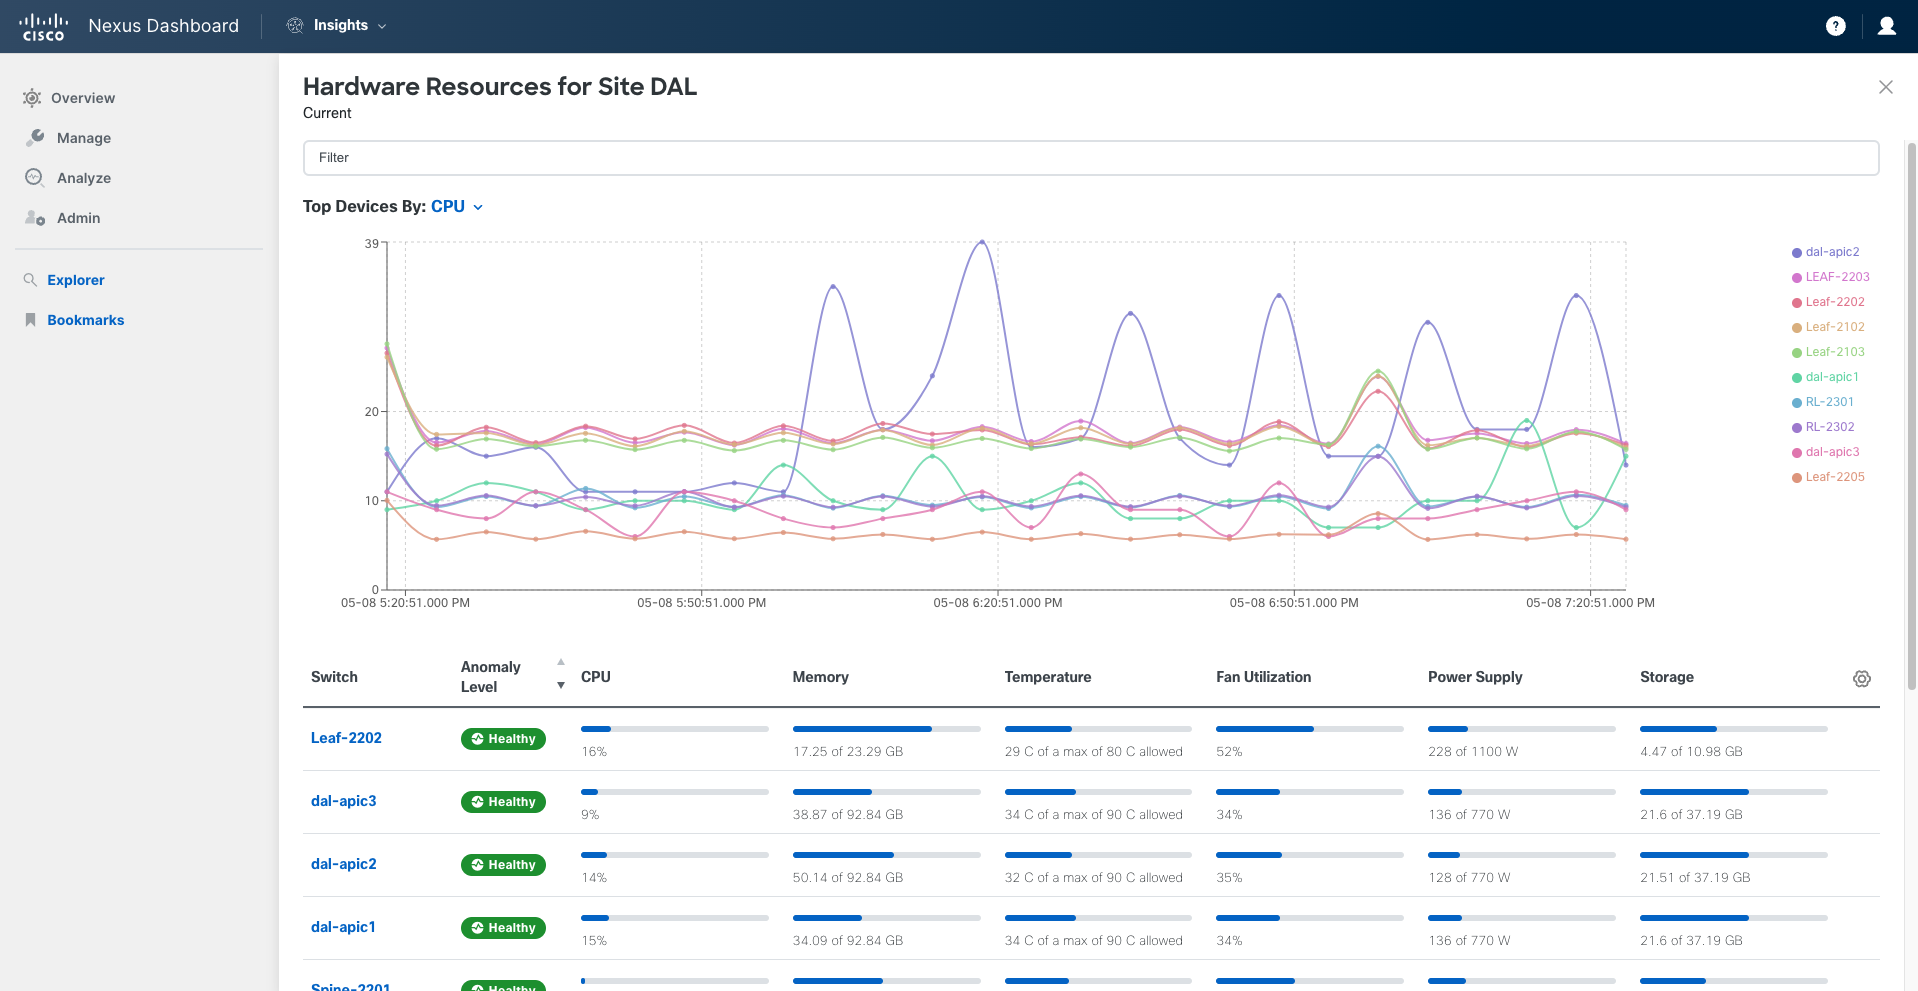
Although this can be useful for other use cases, it is not helping us with the task we are working on. Hence, close this window and go back to the Site Overview.
Step 3
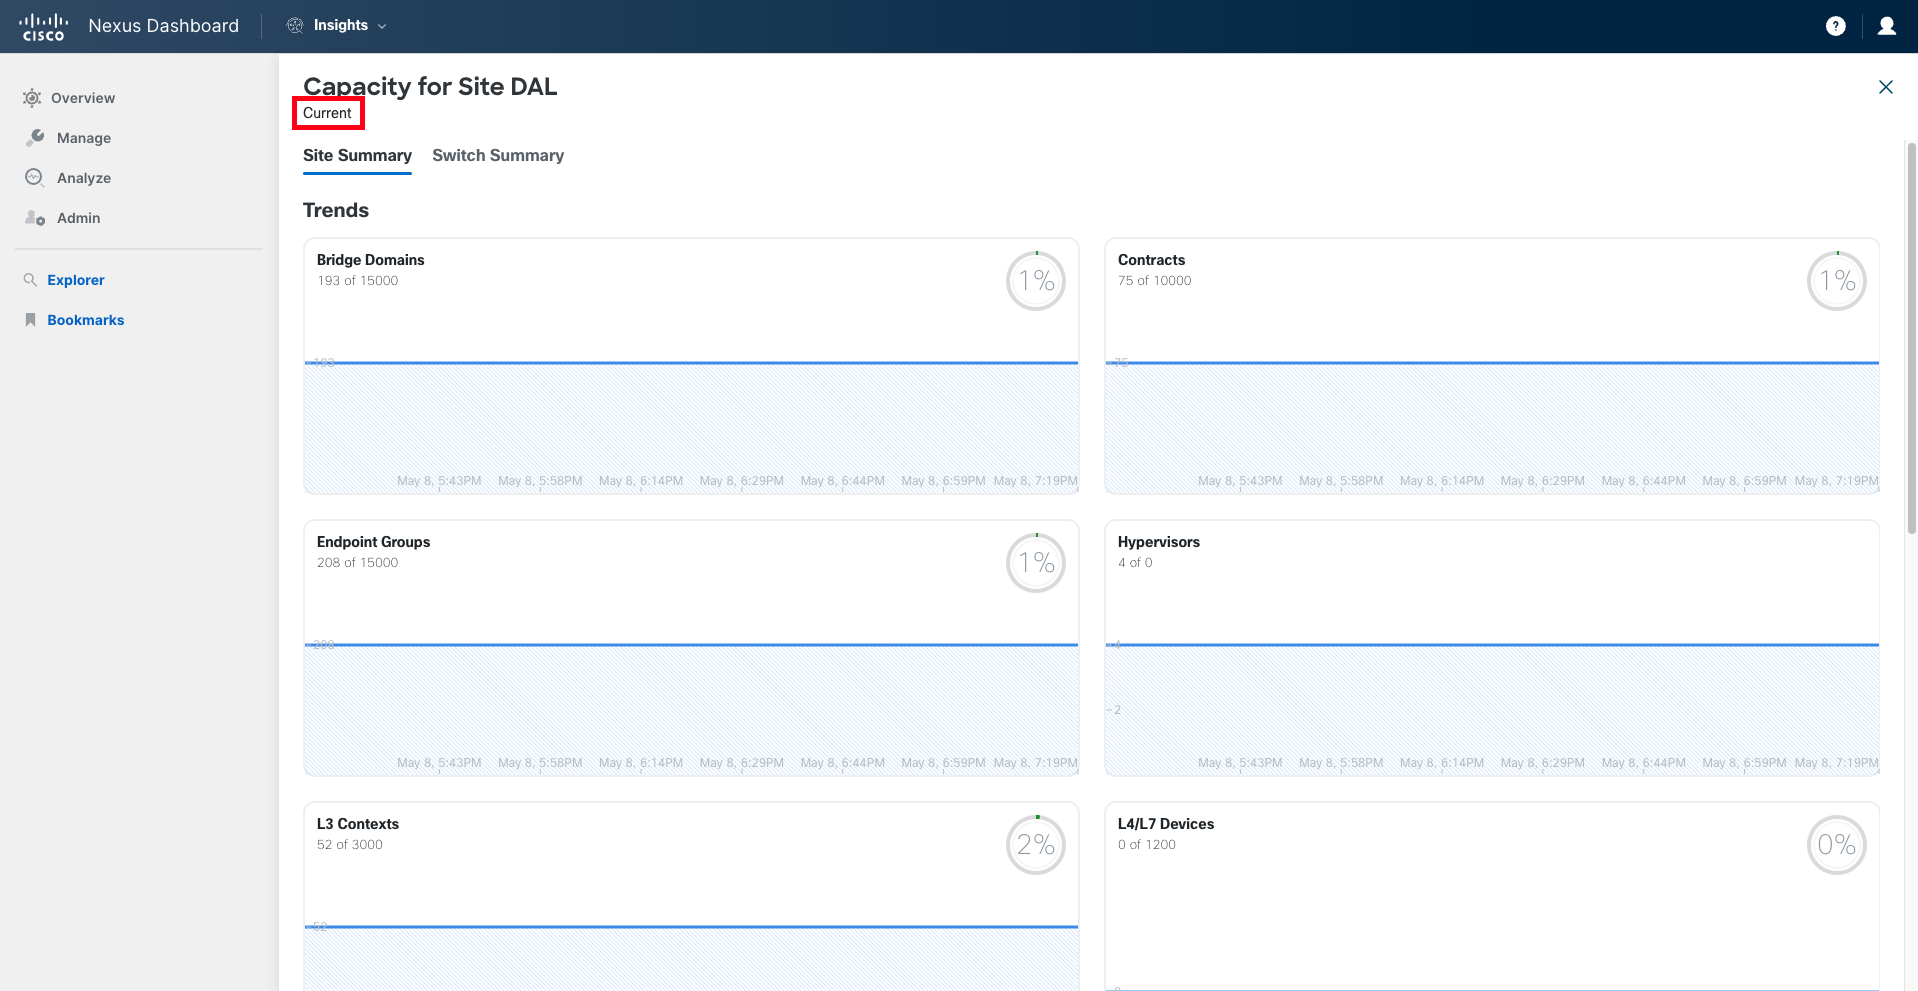
On the site Overview window, click now on View Capacity to navigate to capacity utilization information. A panel will be displayed that shows the capacity utilization per site and per switch.
There are some capacity limits that are associated with the configuration applied on the APIC, and hence they are linked to the site itself, while other limits are linked to the switch hardware and therefore must be evaluated on a per-switch basis. From this section, we can explore both capacity limits.
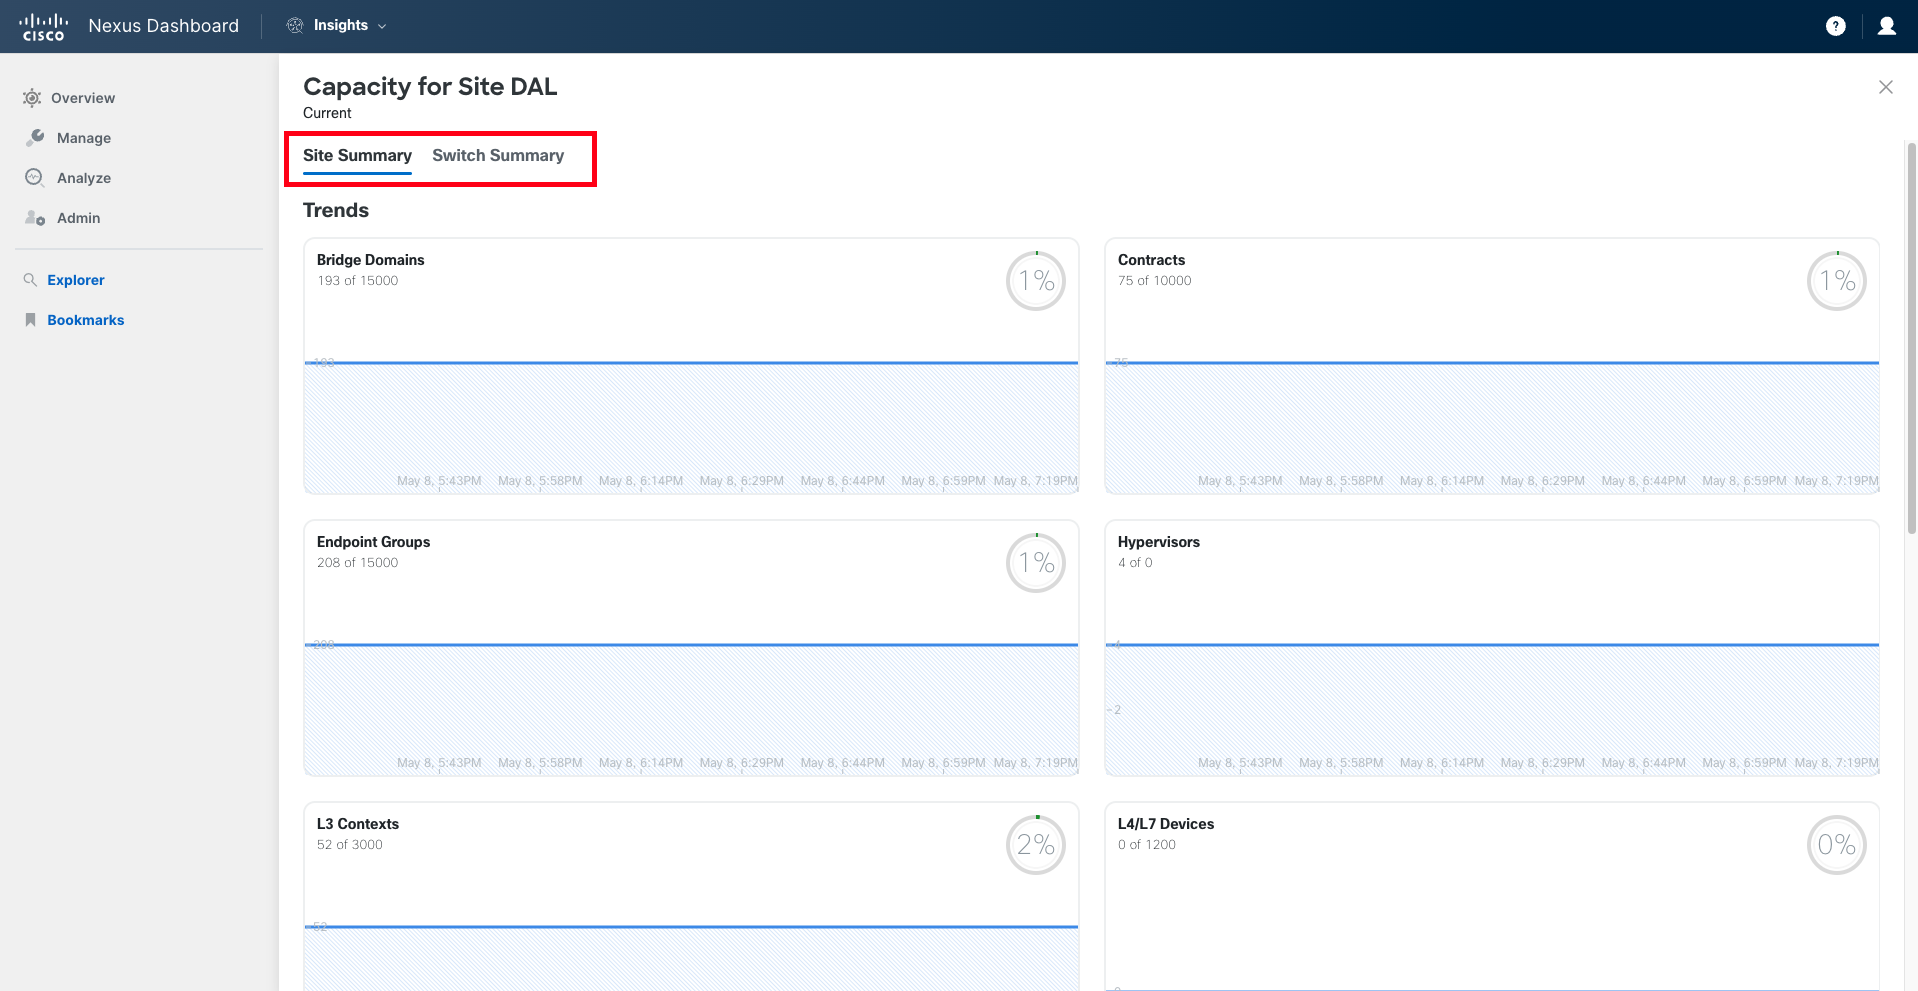
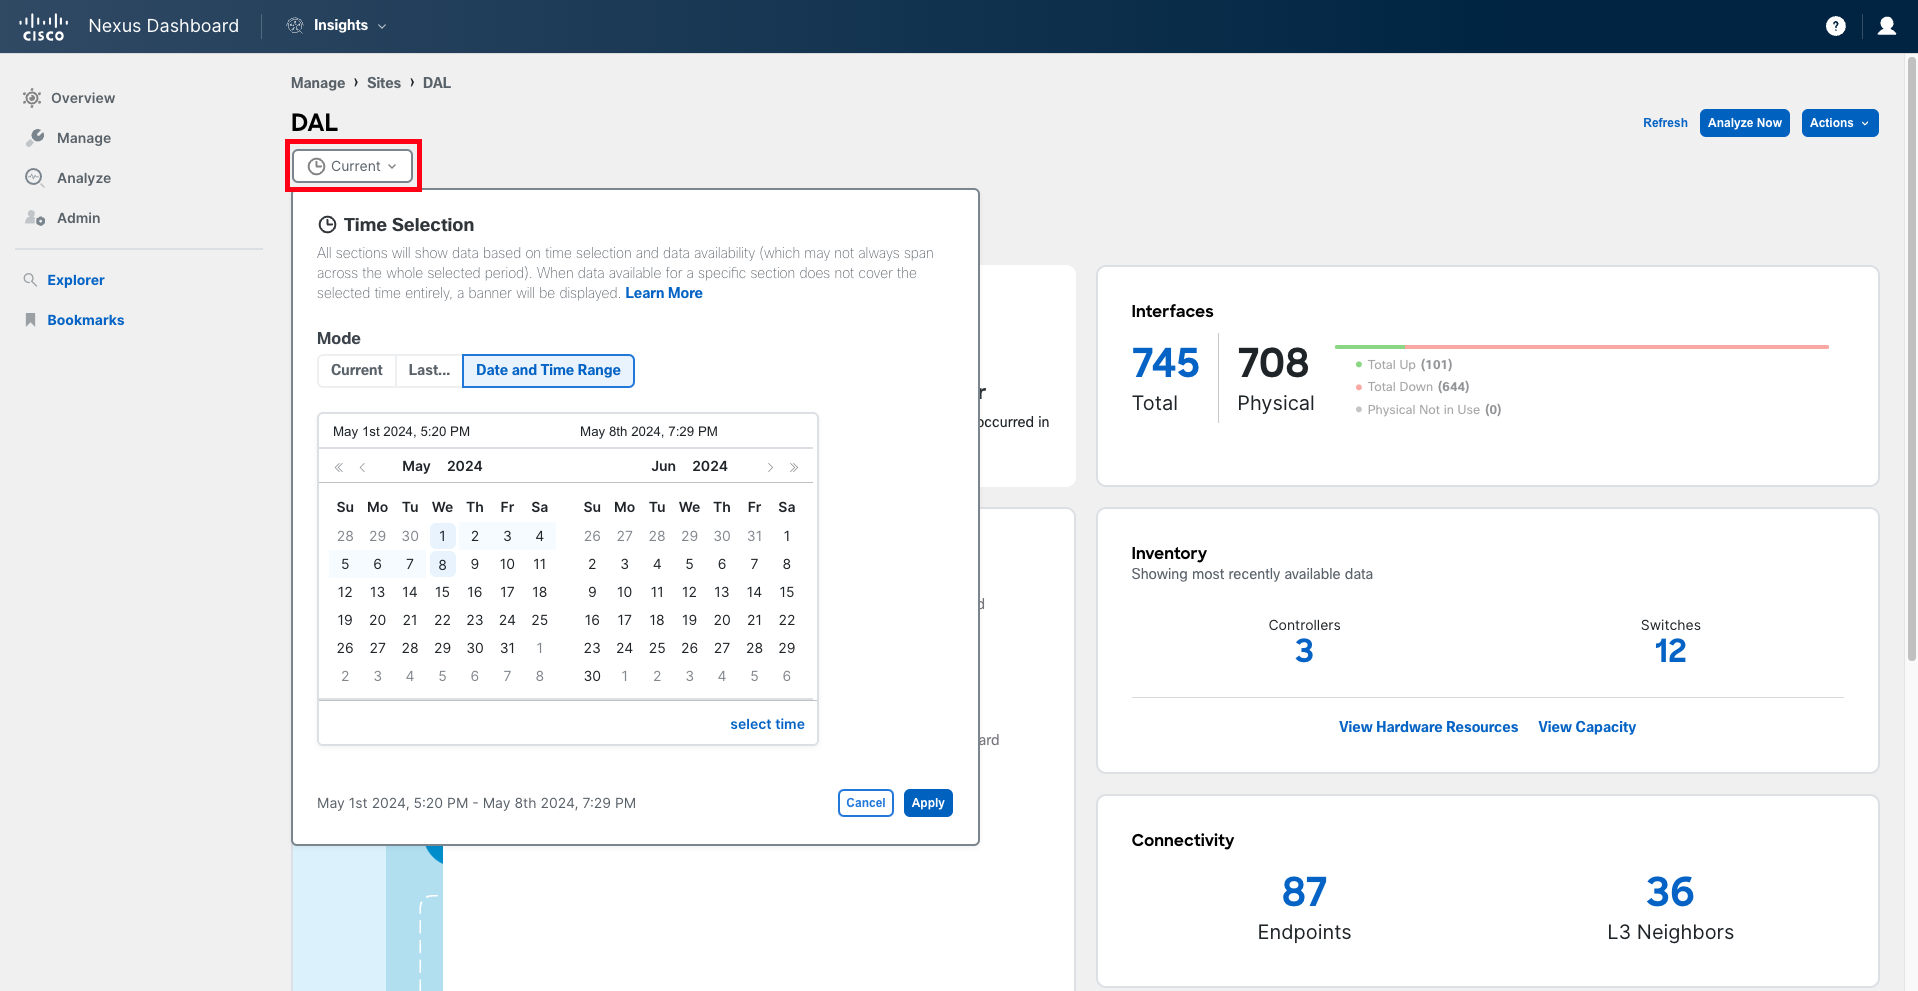
Note that we can evaluate not only the current capacity utilization but also the utilization at any moment in the past. Just under the section header, you can visualize what the current time selection is. By default, this will be Current, which is equivalent to the last 2 hours.
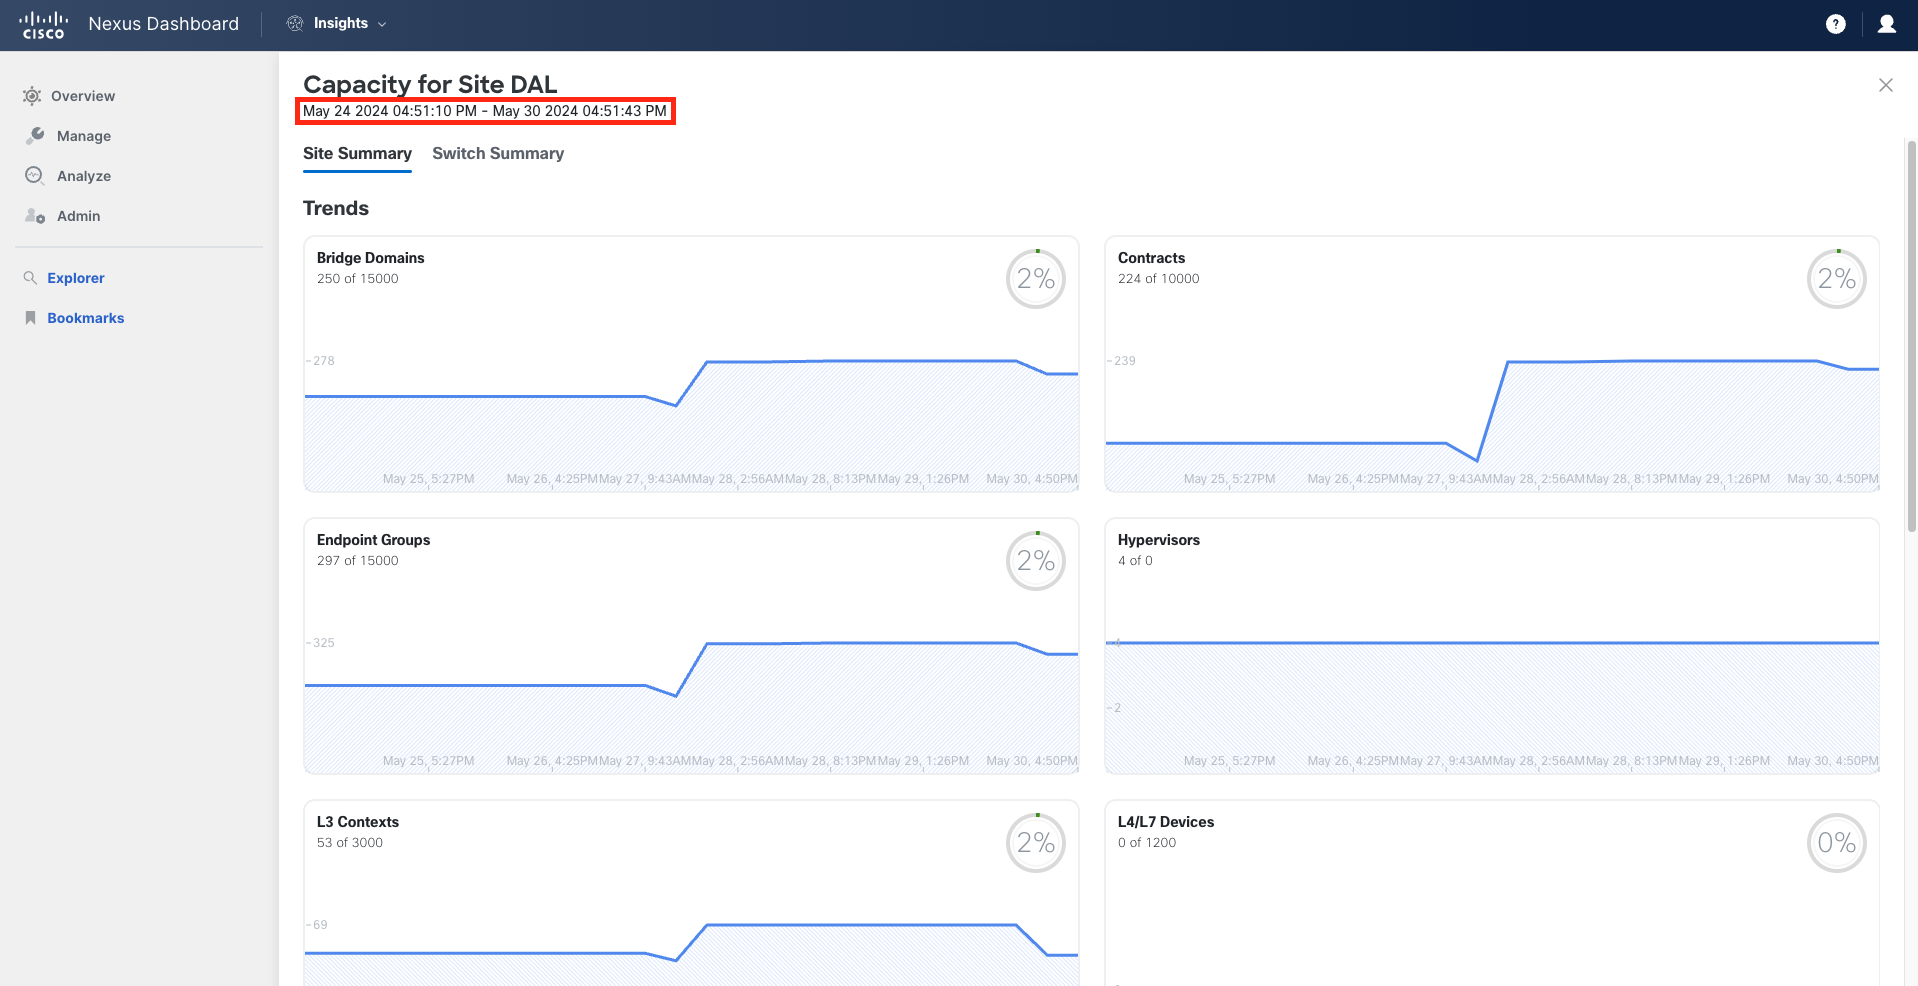
The time range can be changed by using the time selection dropdown available under the site overview page. Once the time range is changed there, it will be applicable to the entire site information.
Note
The values shown in the following screenshots may differ from what you see on the fabric today. Also, note that data retention is 30 days; going beyond 30 days may result in no data being returned. For the rest of the use case, unless stated otherwise, use "Current" or "Last Day."
Step 4
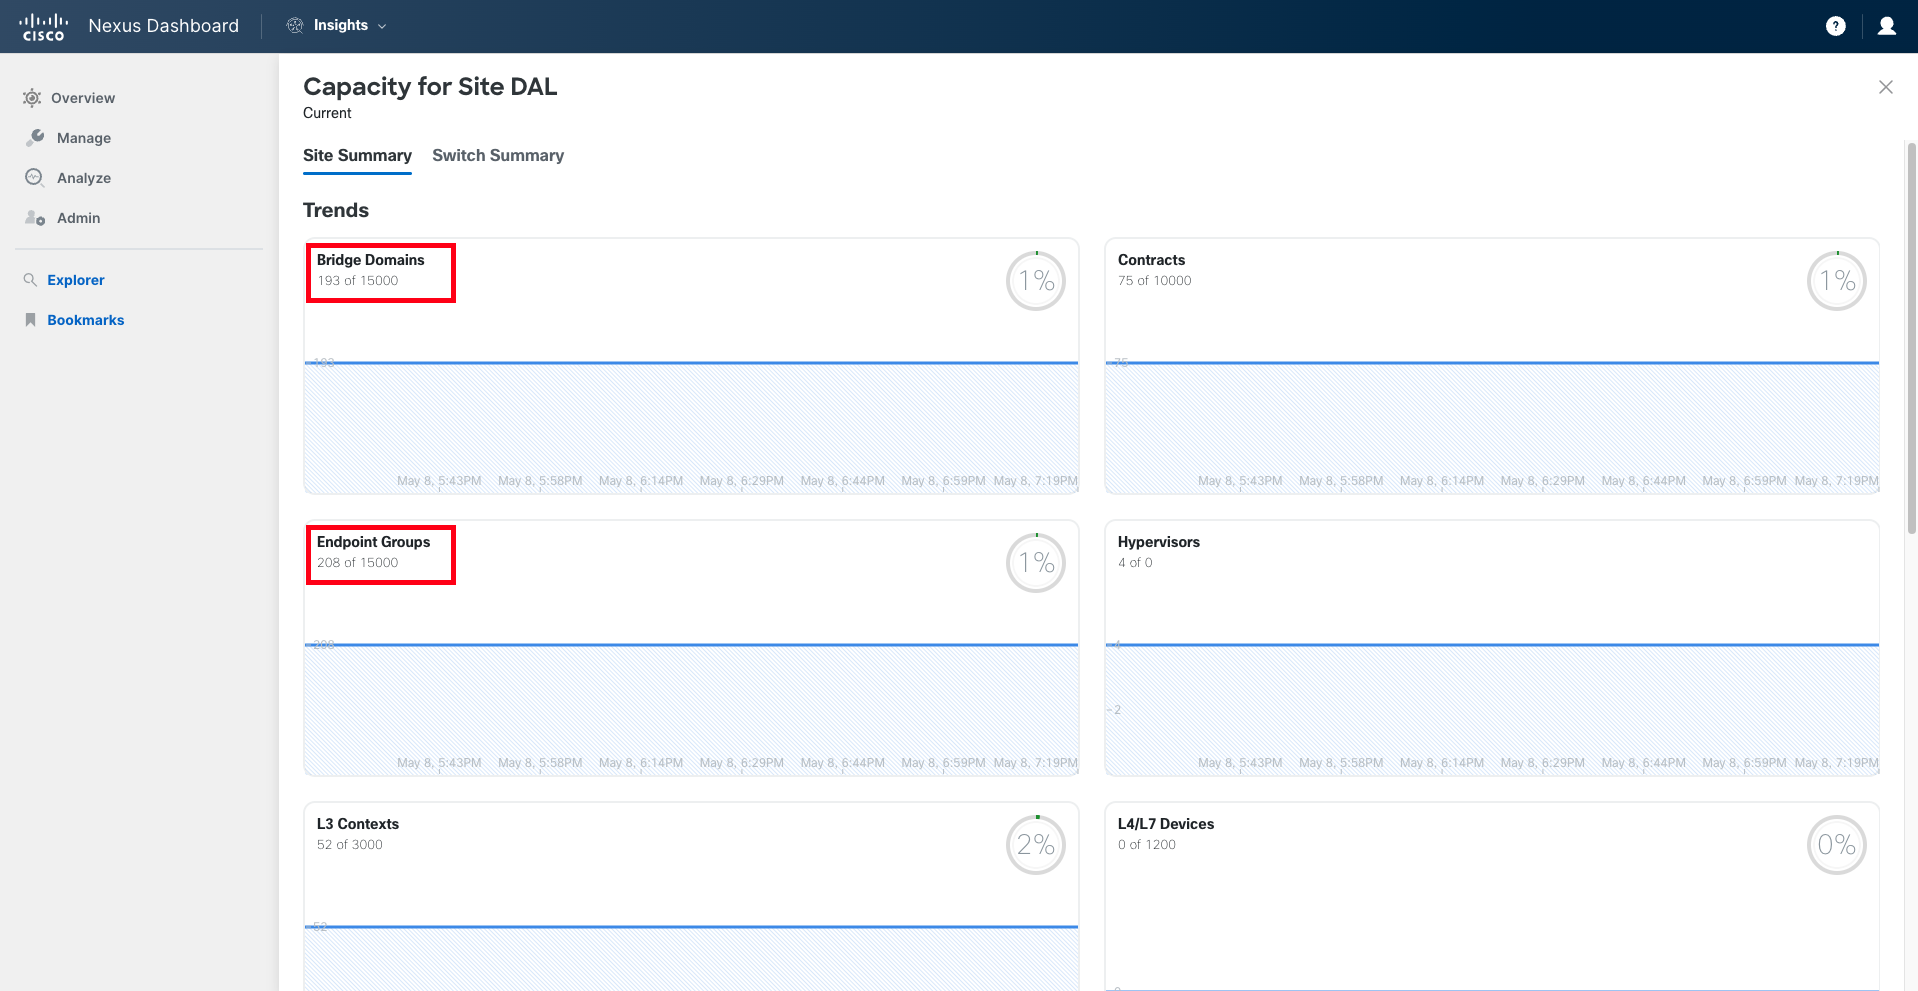
From the Site Summary view, collect the information needed for your capacity report. In this case, you will focus on the Bridge Domain and Endpoint Group utilization.
Note
For lab purposes, you do not need to collect or write down any values. In a real scenario, this information might be included in your email or report in some form (such as tables or screenshots).
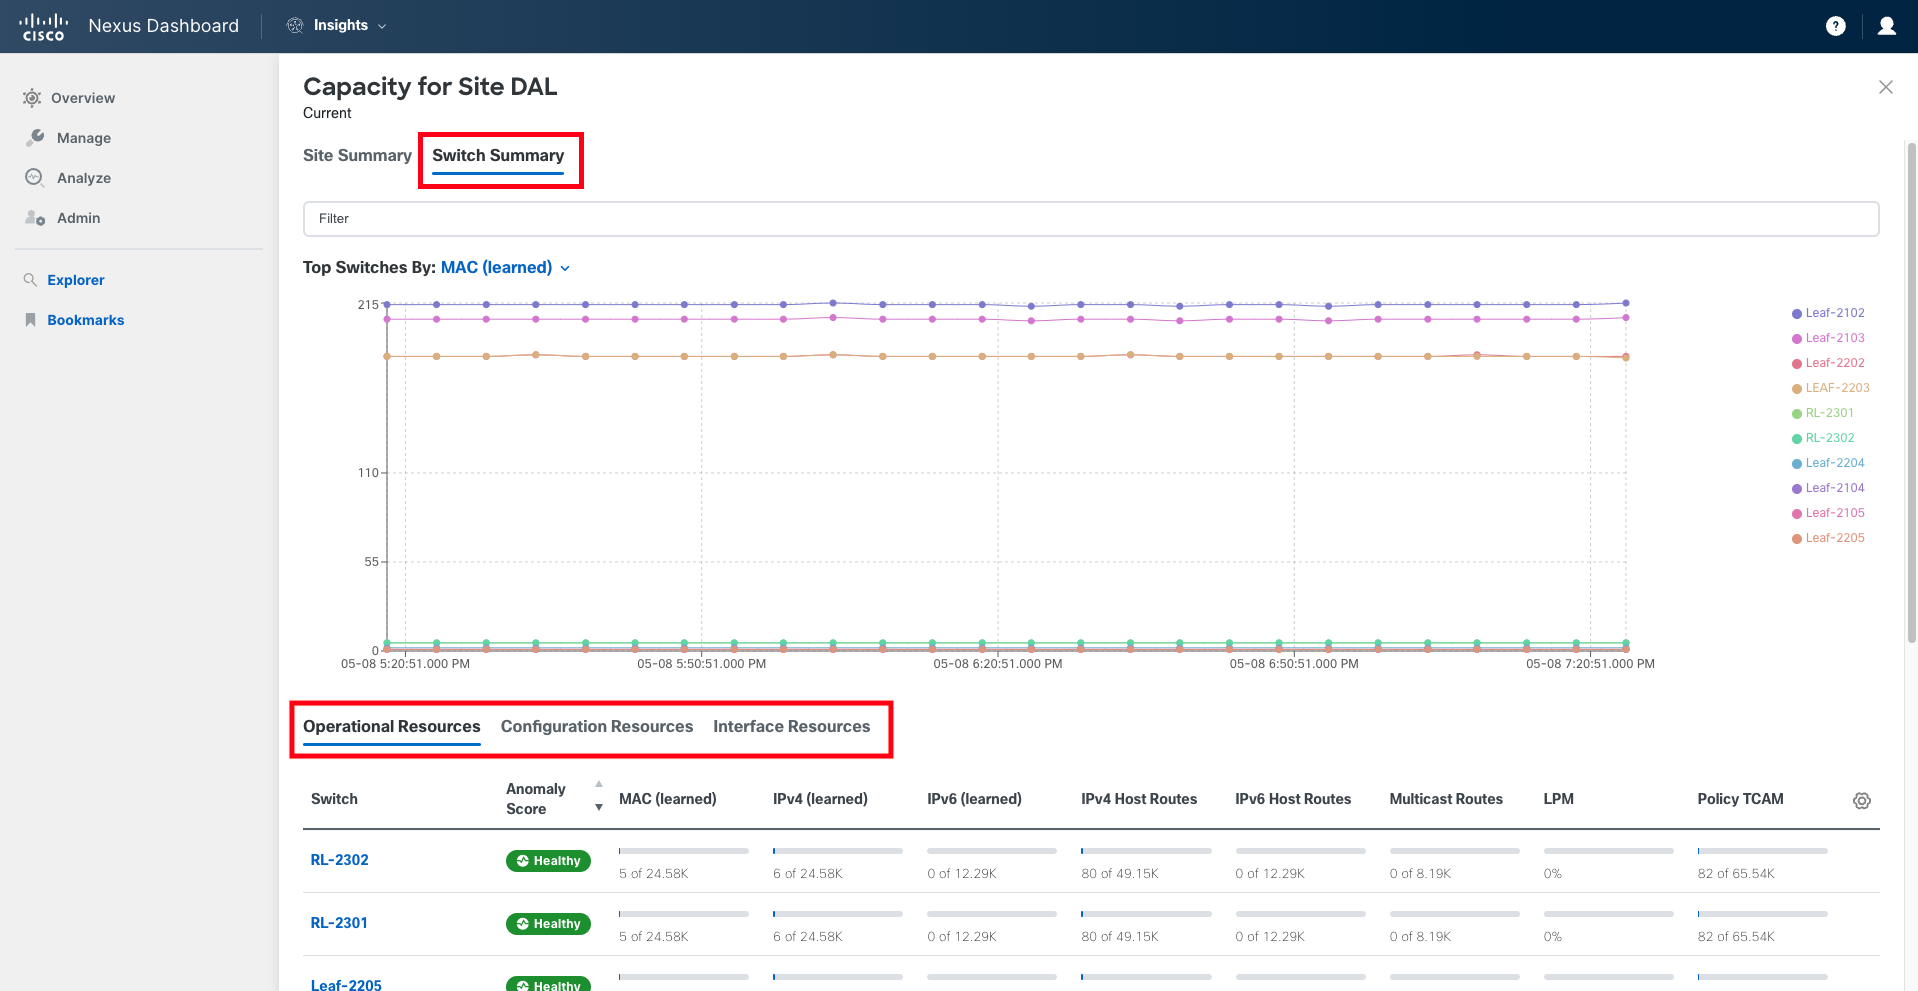
Step 5
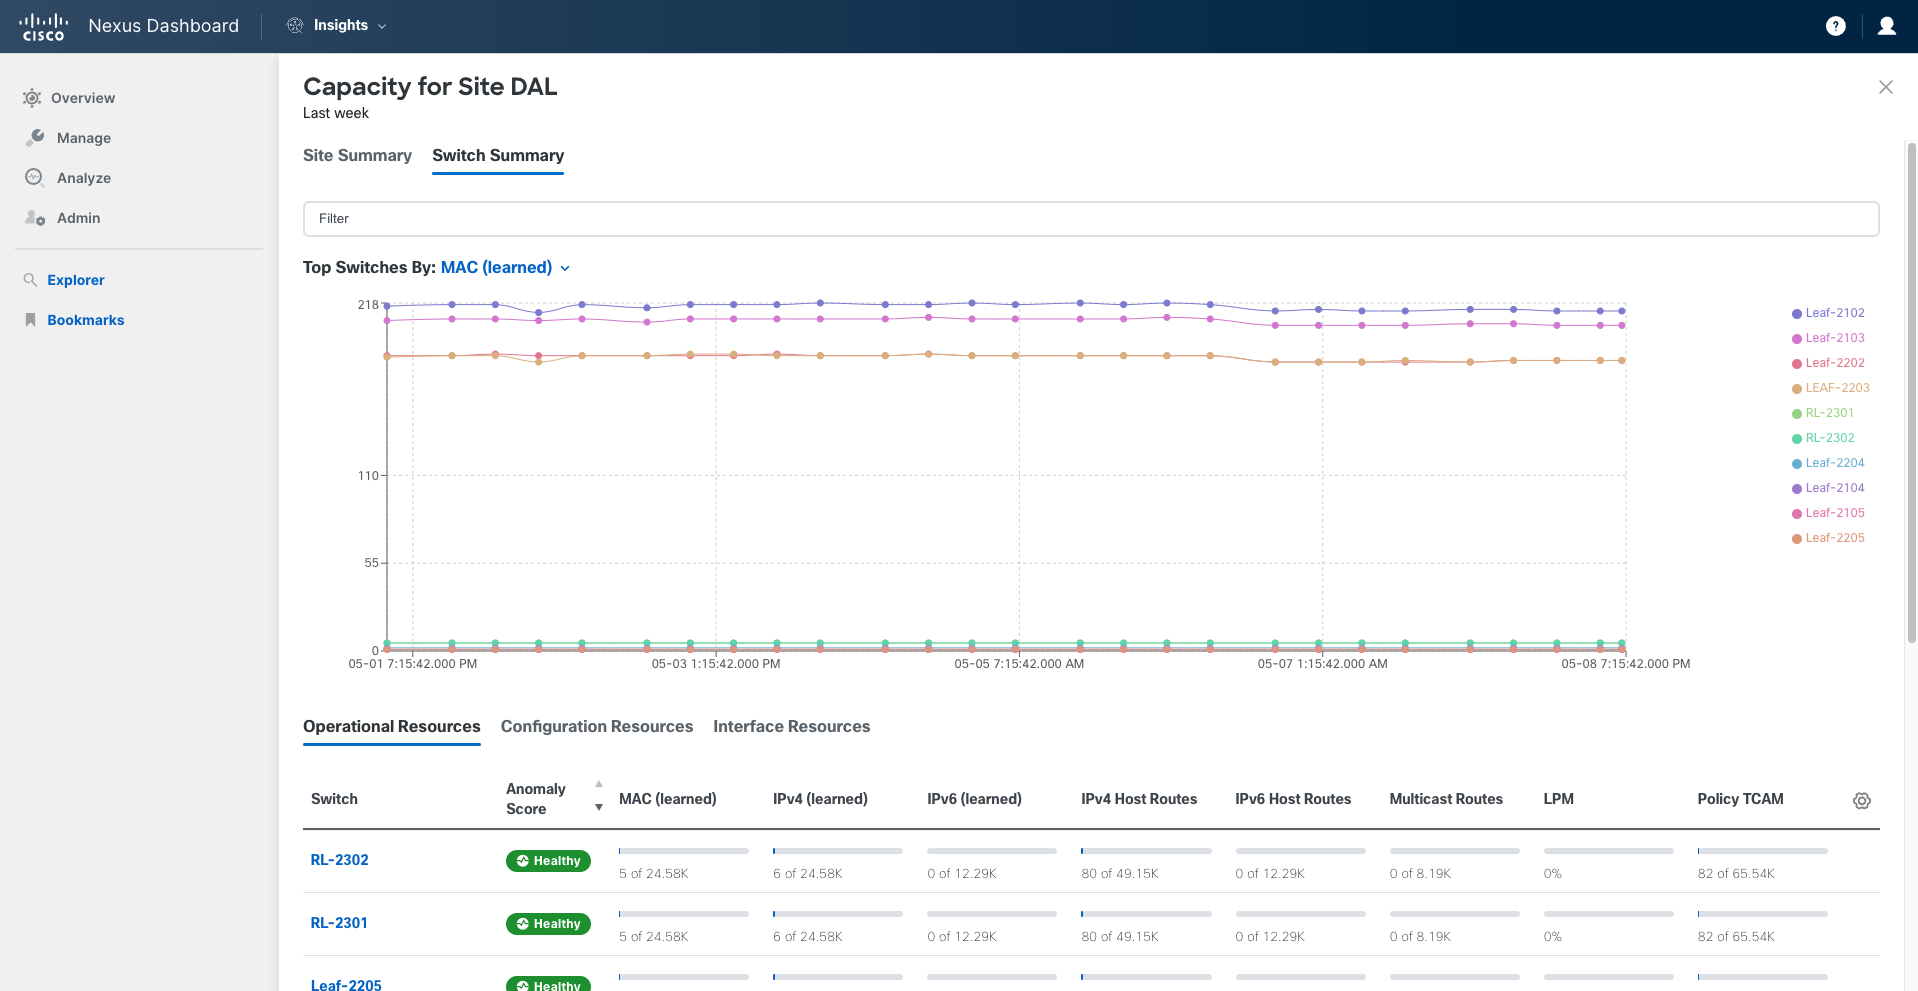
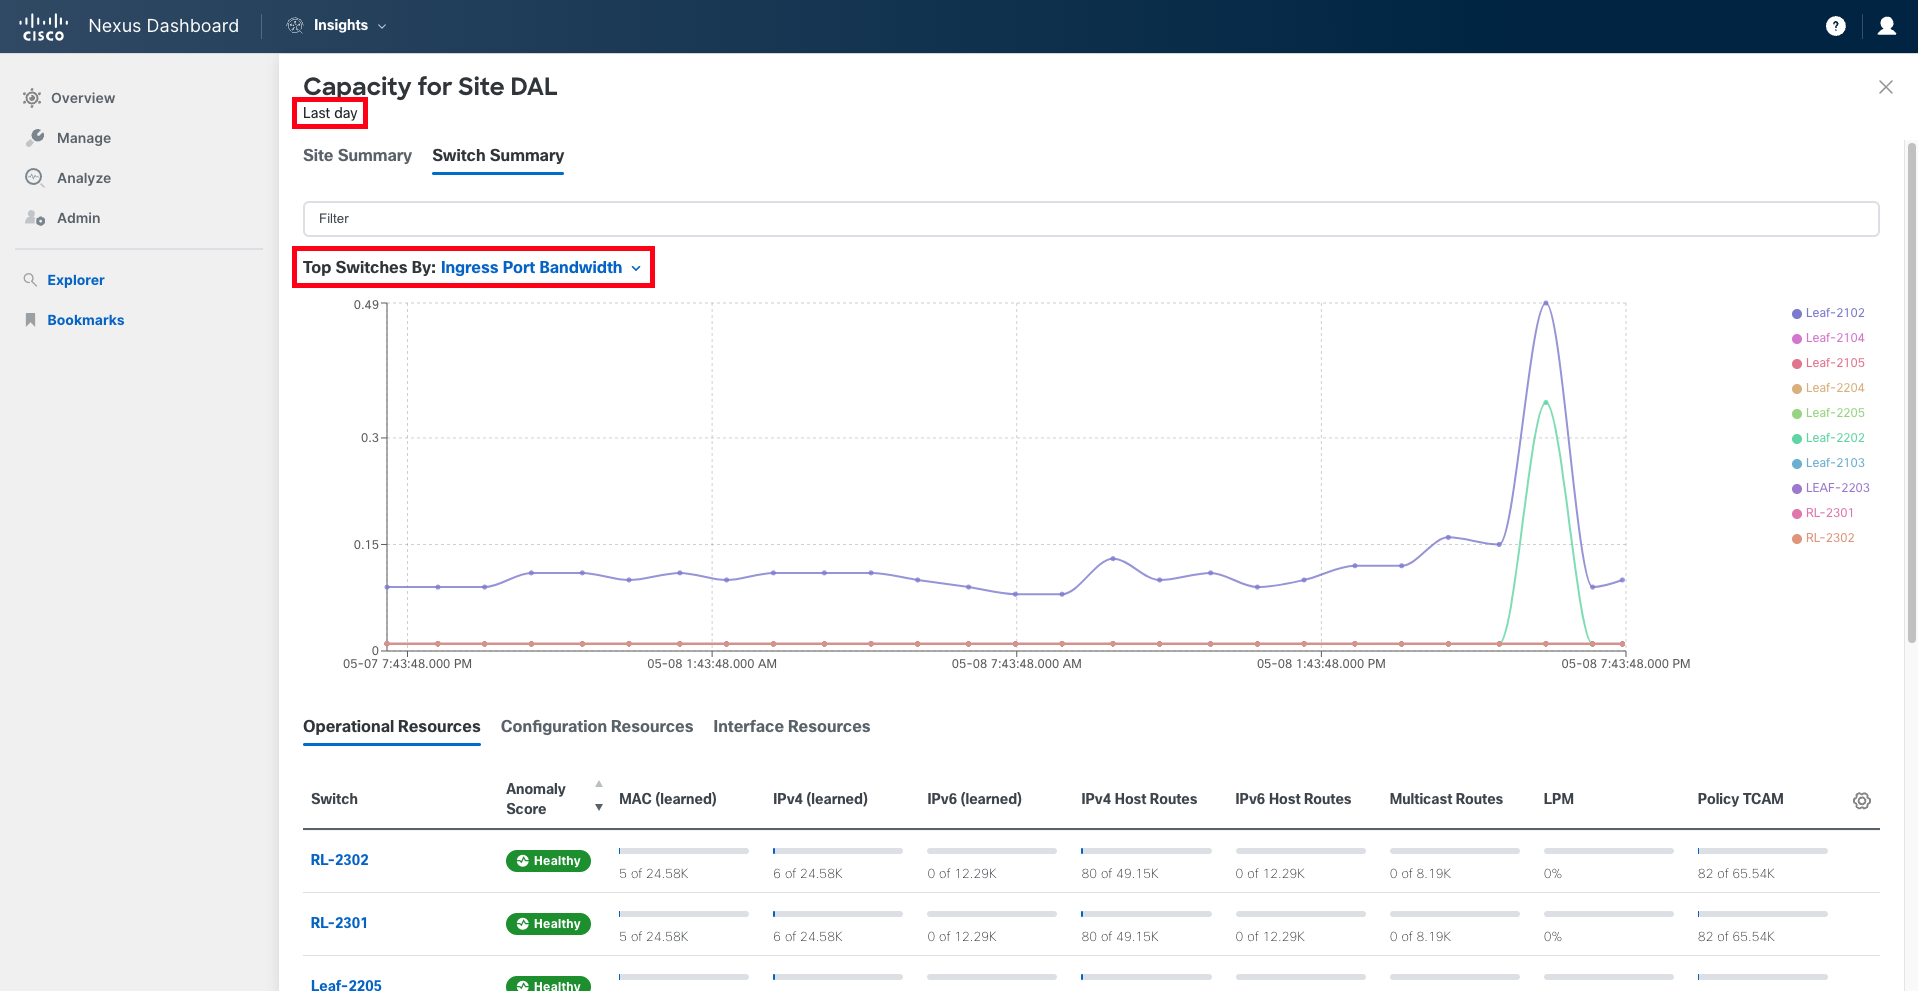
Navigate to Switch Summary. There, you can find a time-series representation at the top, displaying the top switches by the selected parameter. Below the graph, you can find a tabular representation of Operational Resources utilization, Configuration Resources utilization, and Interface Resources utilization.
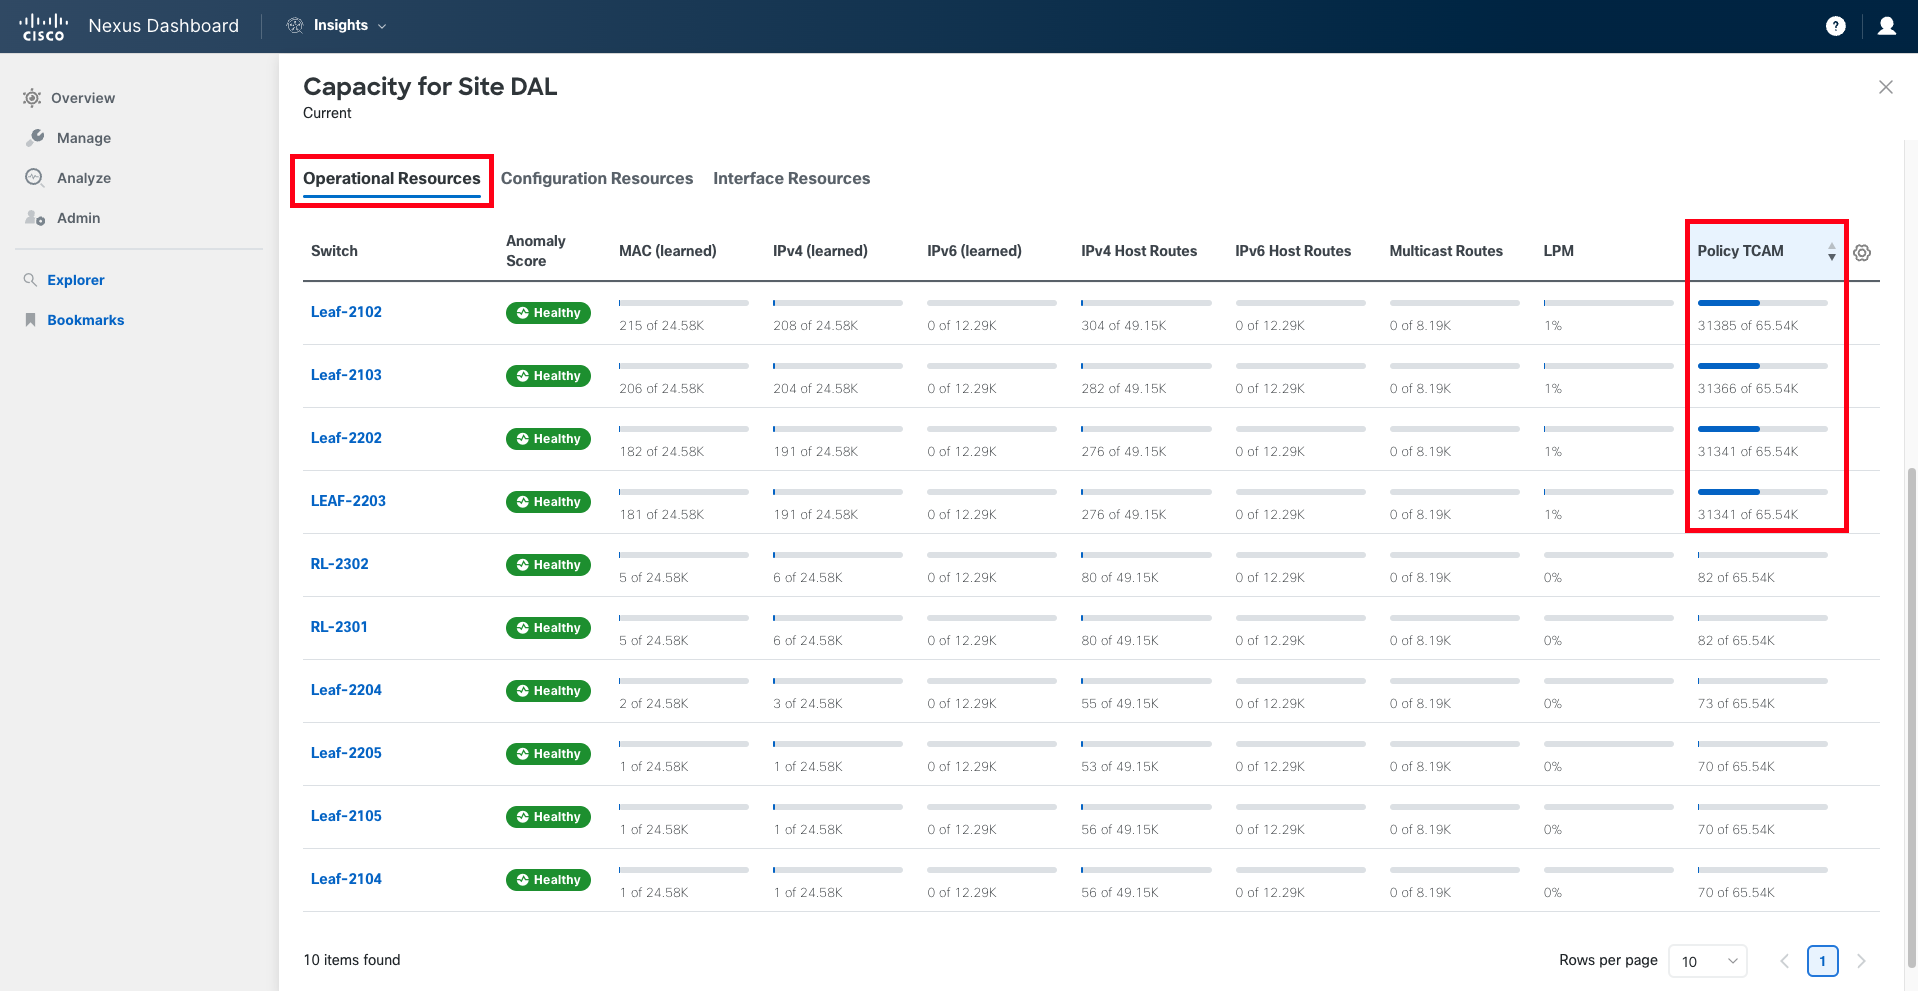
Step 6
Start by examining the Operational Resources. You can quickly confirm that none of these parameters show a high utilization that may cause concern. However, there are some switches that have significantly higher Policy TCAM consumption than others. You will discover more about this in subsequent steps.
Before moving forward, take notes on the TCAM Utilization levels of your switches for the report.
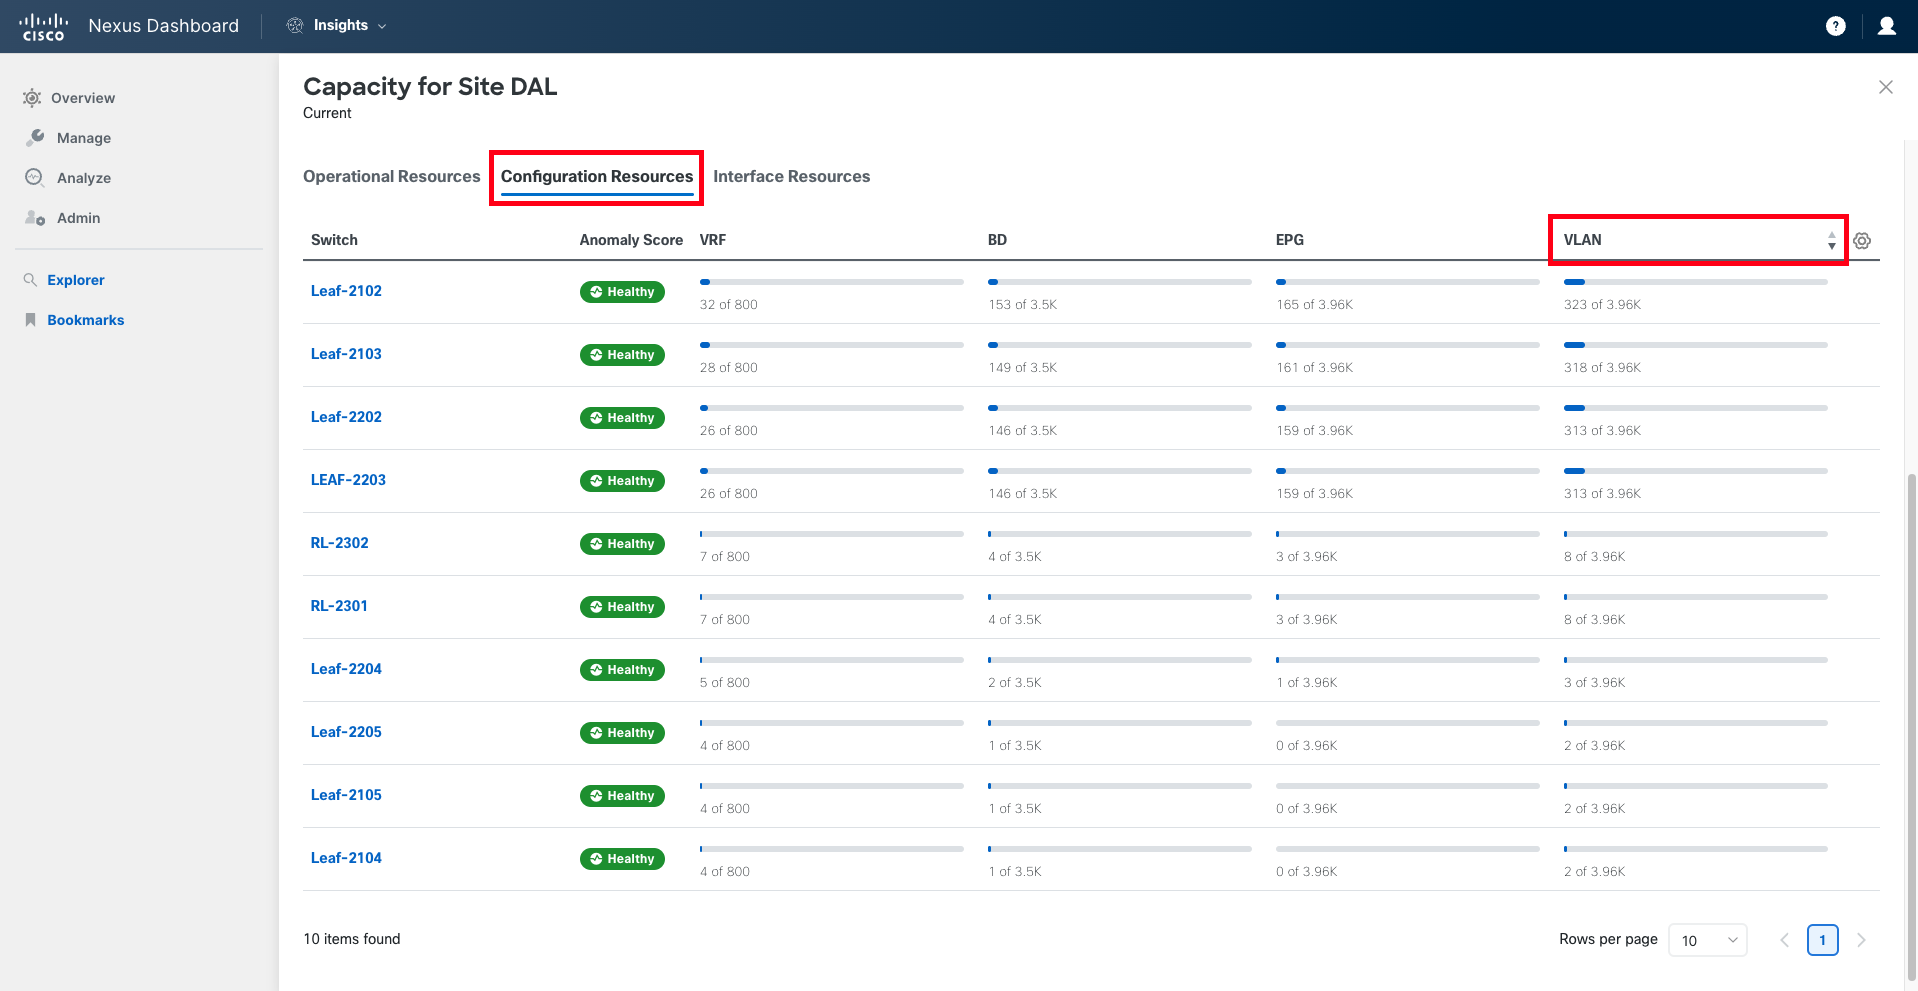
Step 7
Now, navigate to the Configuration Resources tab. Once again, you can quickly understand that capacity utilization in your fabric is not a concern at this moment. For a clearer view, sort the results by VLAN, bringing the higher values to the top. The same operation can be applied to other columns.
Collect the required information on BD, EPG, and VLAN utilization for your report.
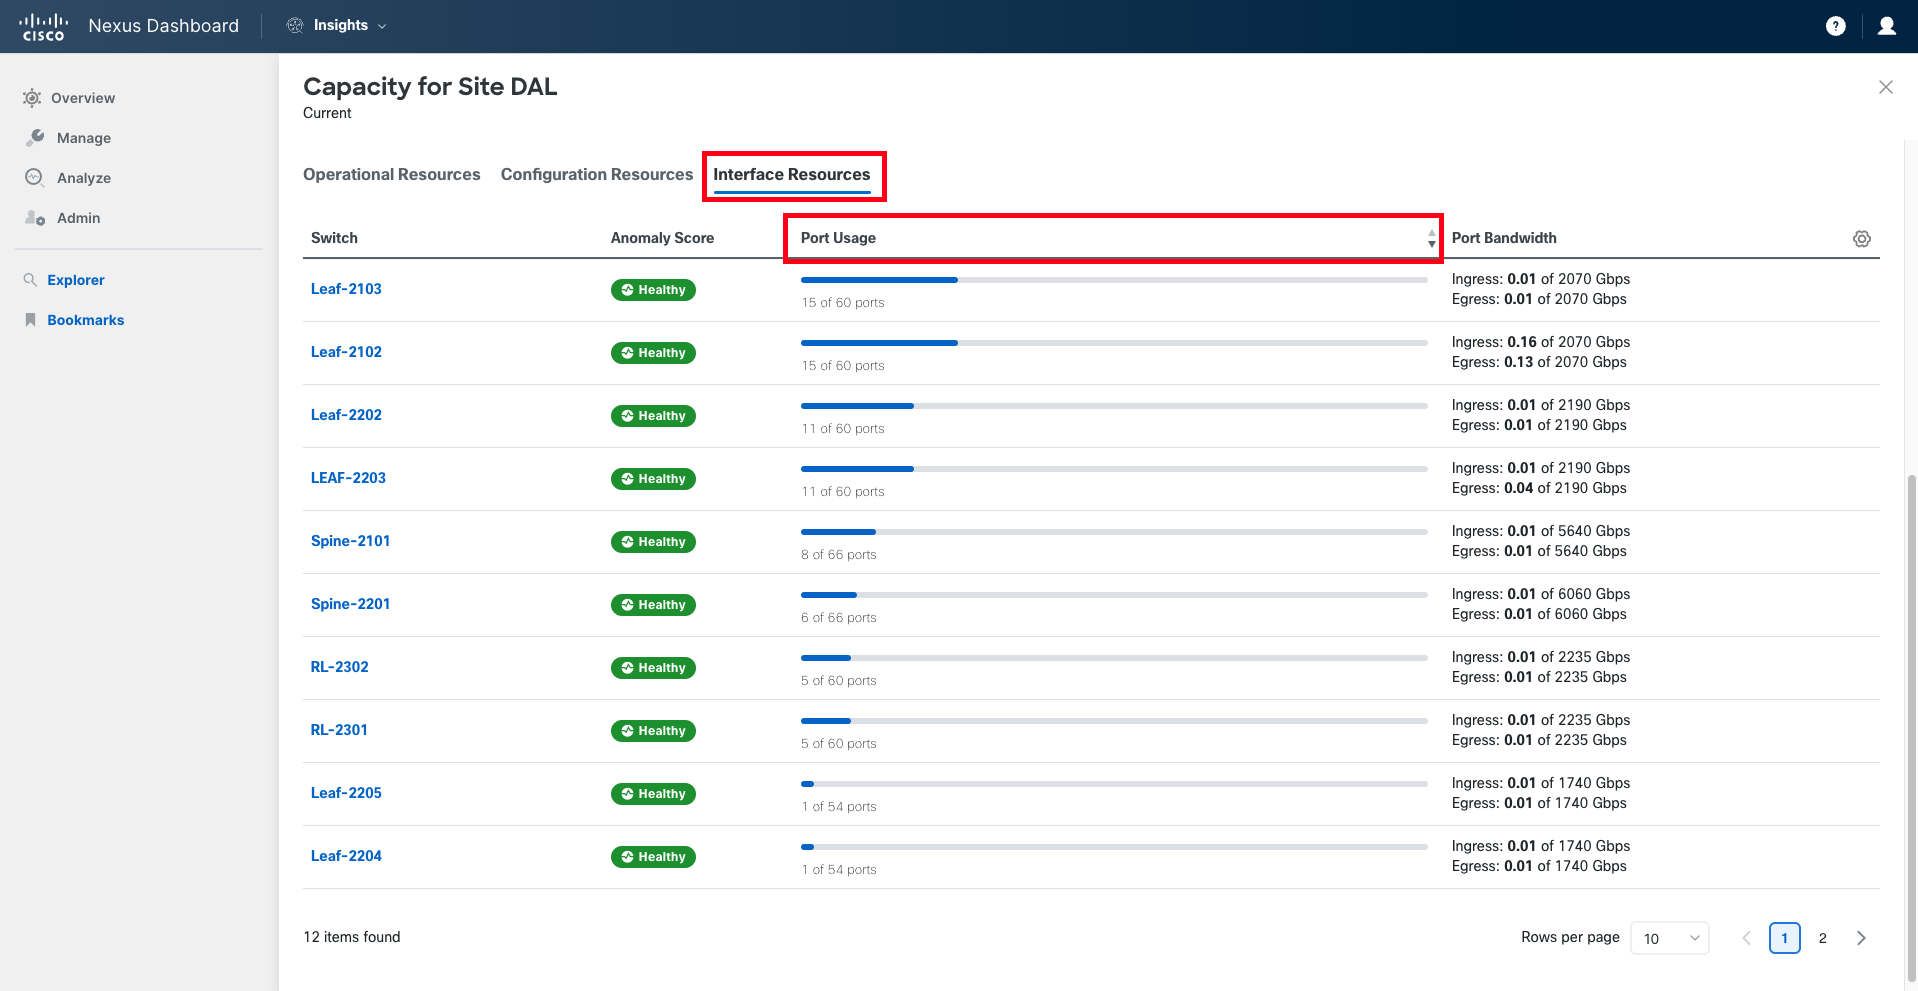
Step 8
Last but not least, move to Interface Resources. On this screen, you can find two important pieces of information:
- The number of ports in use per switch
- The bandwidth used per switch, both ingress and egress
Sort the information in descending order based on port usage. Identify the switches with a higher number of ports in use.
Note
In a real scenario, you could use the information in this view to calculate available ports per rack, pod, switch, or any other categorization useful for your business or to support your decision-making process.
Regarding Port Bandwidth utilization, since this value fluctuates significantly over time, it is advisable to analyze this information using the time-series view.
Therefore, scroll to the top of this panel, go to the dropdown Top Switches by: and select Ingress Port Bandwidth. Optionally, change the time range displayed by using the time range selection dropdown at the site level. In this case, Last Day has been selected. Depending on the deployment mode and available disk space, you should be able to look back up to 30 days.
The same analysis can be performed for Egress Port Bandwidth.
Step 9
In previous steps, you noticed that Policy TCAM usage was substantially higher on some nodes. However, you were not able to understand why or what contracts were causing that higher consumption. Without this information, evaluating any possible improvements or optimizations is nearly impossible. Let's explore how Policy CAM Analyzer can help you here.
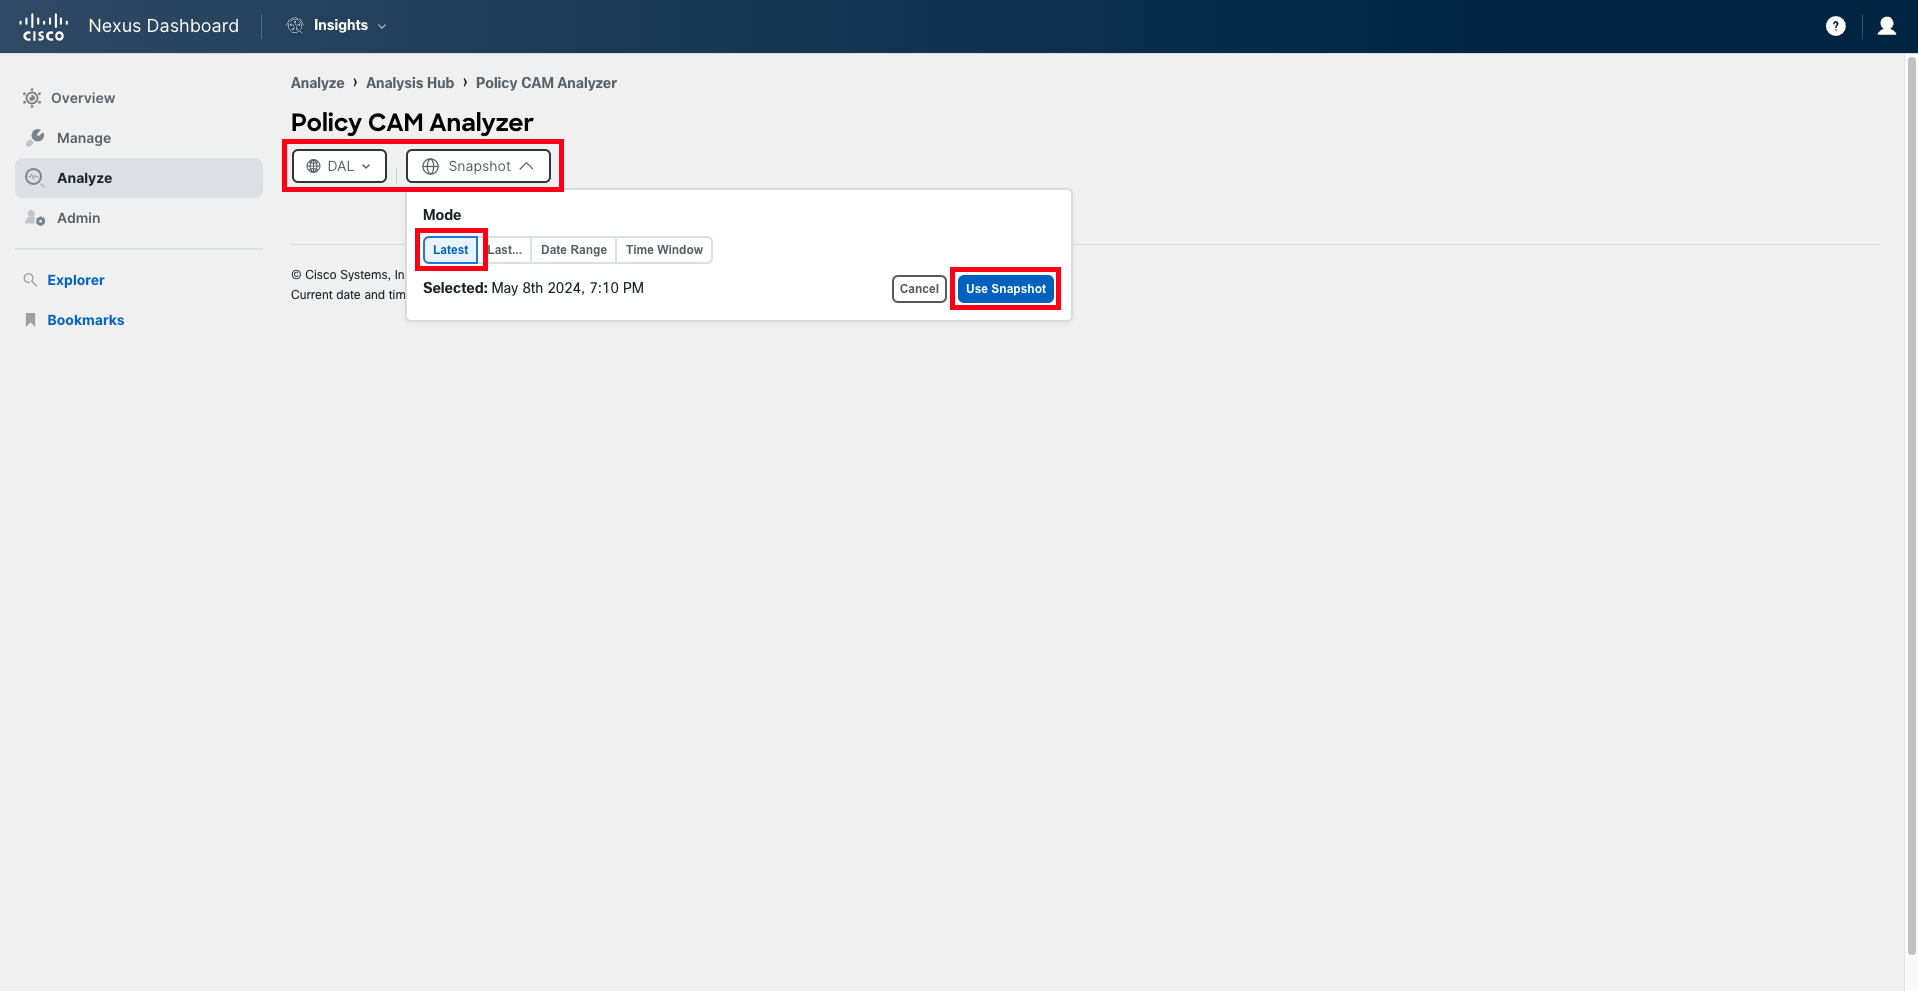
Navigate to Analyze > Analysis Hub > Policy CAM. Select the Dallas (DAL) site, and the latest available snapshot to run the analysis.
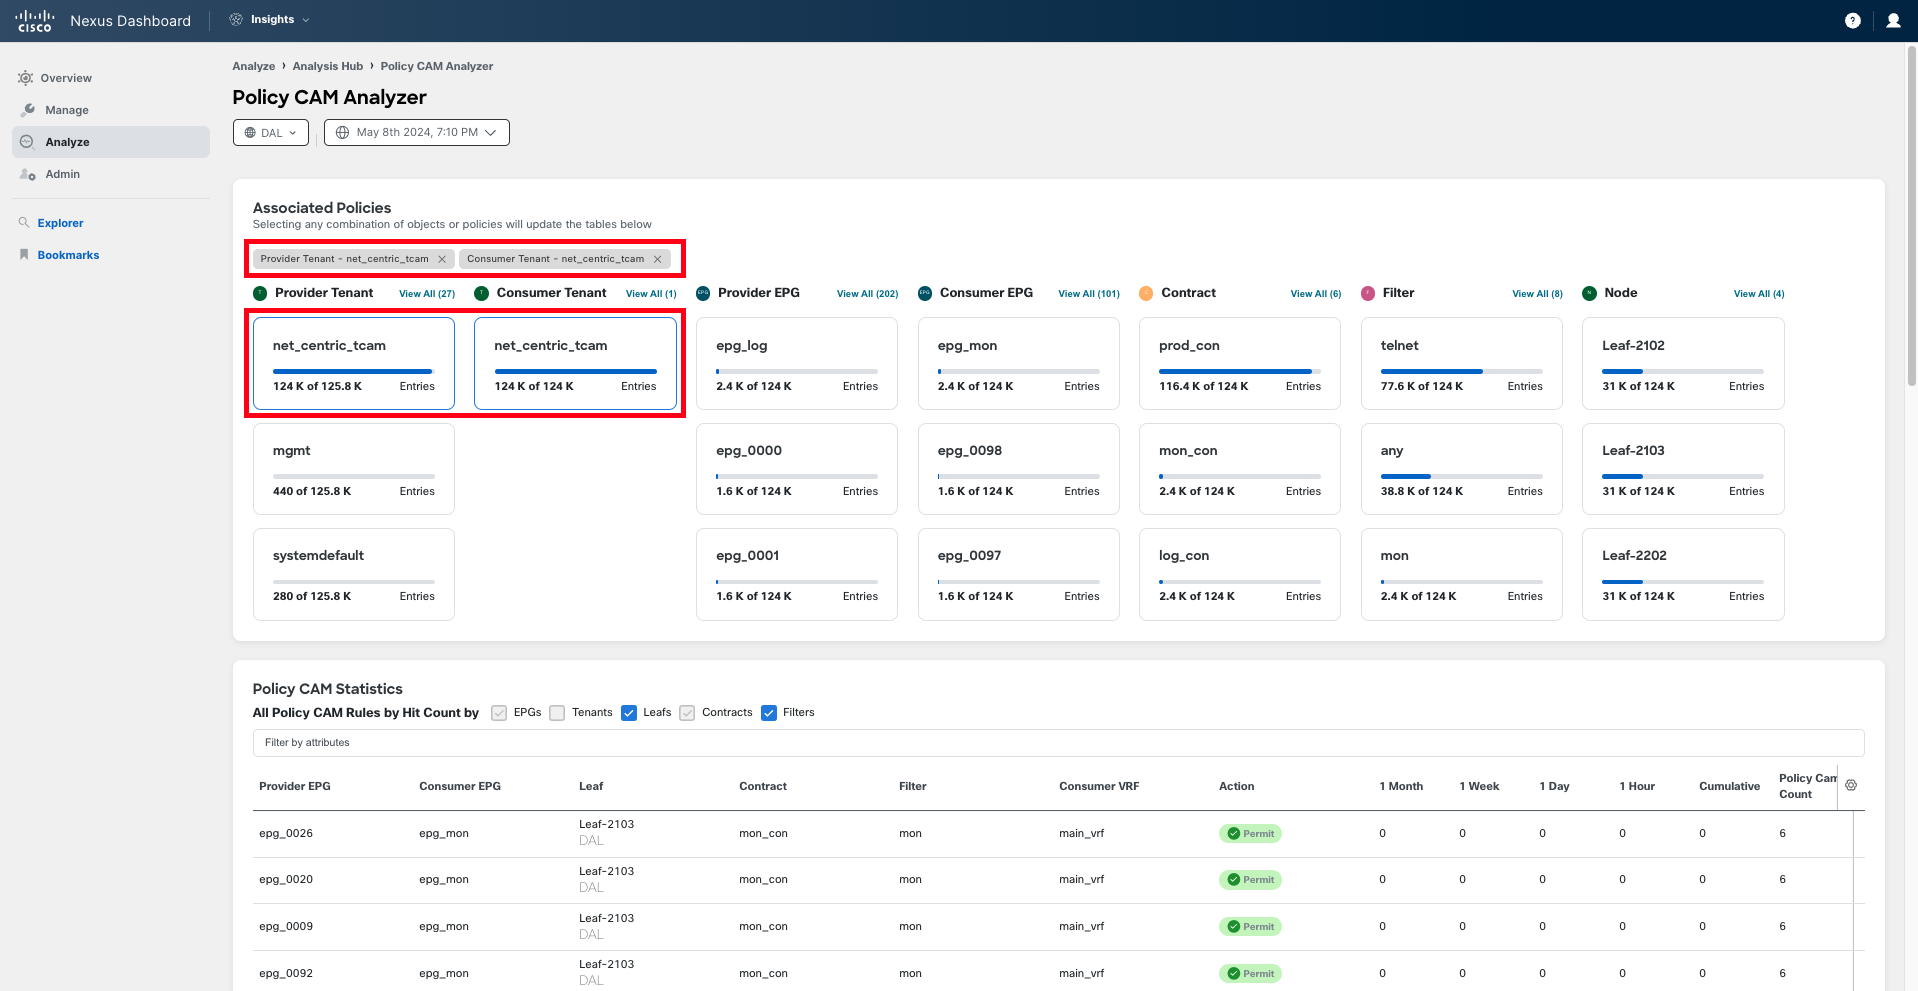
Once the analysis results are displayed, you will find four main sections on the screen:
- Associated Policies: In this section, you can see how many policy CAM entries are used by every configuration object. All elements are clickable, which allows you to filter the view based on them, thus helping you determine the biggest policy CAM consumption areas in your configuration.
- Policy CAM Statistics: In this section, you can find the number of hit counts in the last hour, day, week, and month, which is fundamental to understanding which rules are no longer in use, and hence being able to remove them with confidence when they are no longer needed.
- Policy CAM Rules: In this section, you can explore the rule entries that have been programmed into the hardware TCAM of all switches.
- Anomalies: In this section, any anomaly related to Policy CAM will be listed, such as stale policy CAM entries.
In the context of the analysis you are conducting, let's focus on the first section. You want to understand which entities are consuming more policy CAM entries and determine if any optimization can be done.
Step 10
Take a quick look at the Associated Policies section. You can quickly notice that a high number of entries are used by the tenant net_centric_tcam. Click on that tenant to filter based on it.
Step 11
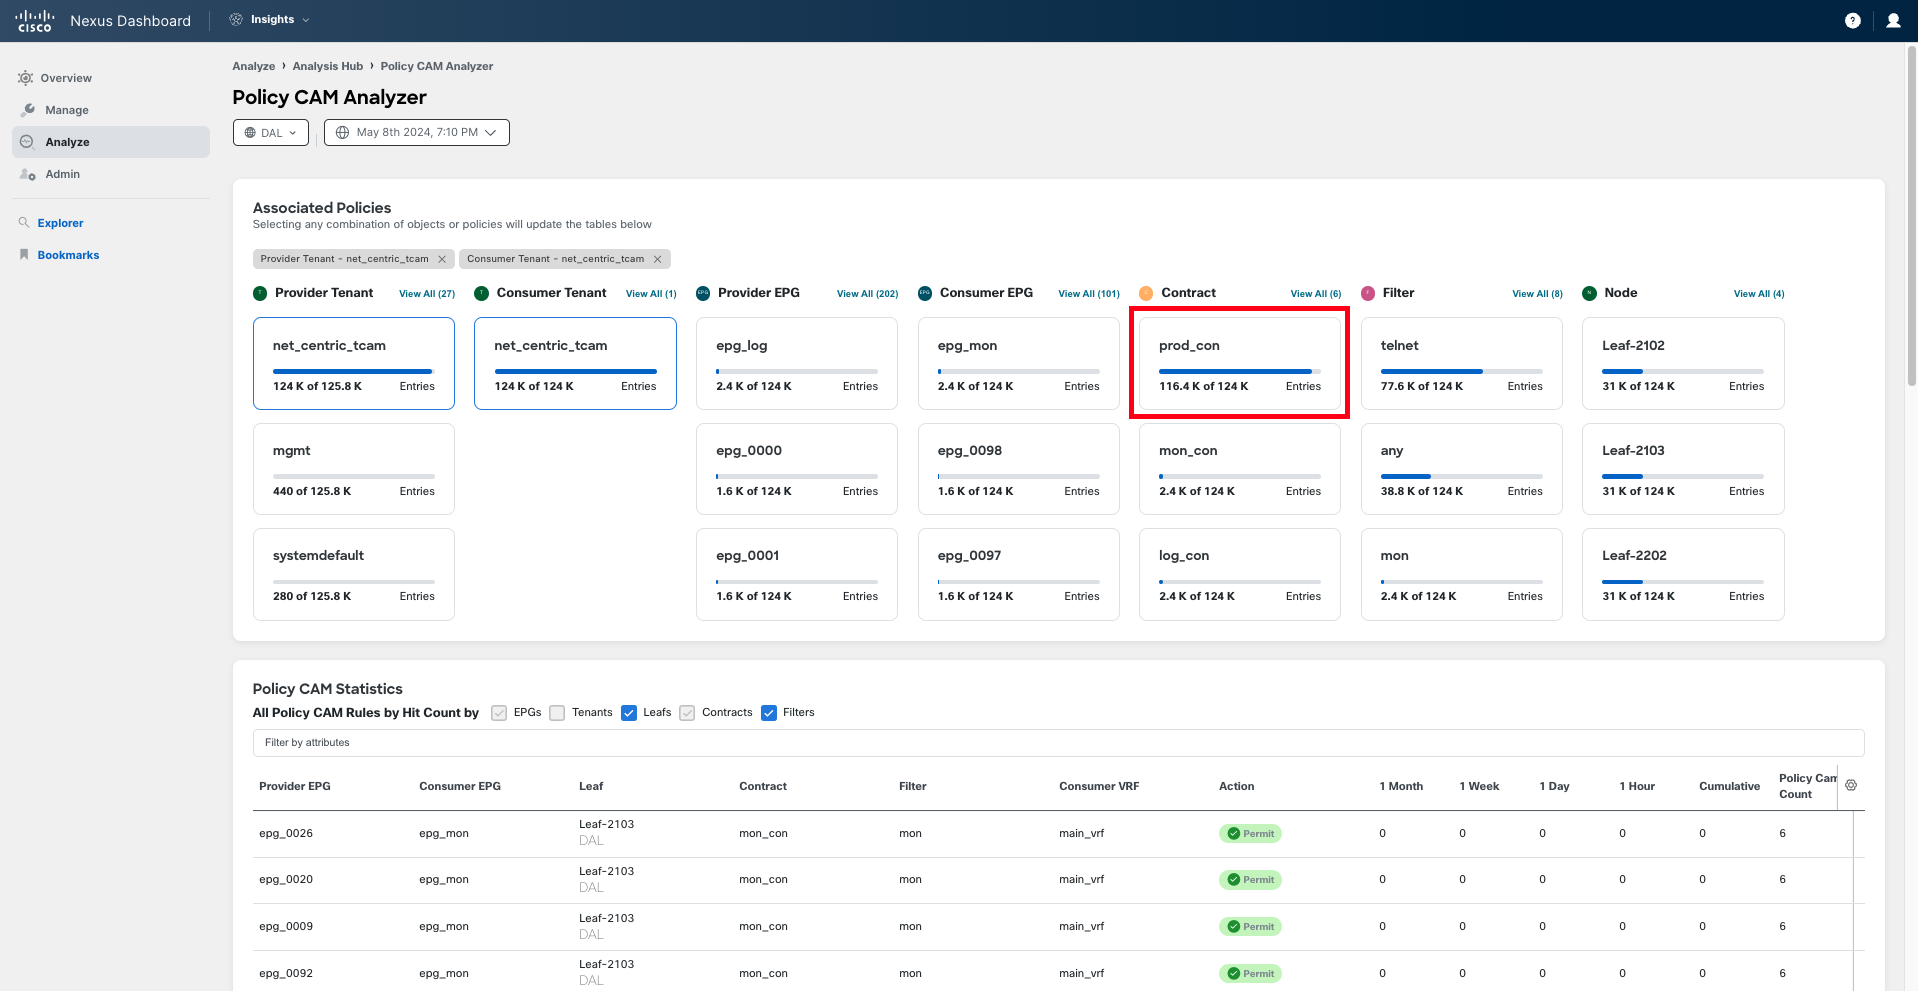
Out of the contracts from the net_centric_tcam tenant, the contract prod_con seems to be consuming the most entries. Click on that contract to narrow down your search.
Step 12
Once you have filtered by tenant and contract, you can see all the EPGs that are providing and consuming that specific contract, the filters that the contract uses, and how they contribute to the total number of entries used.
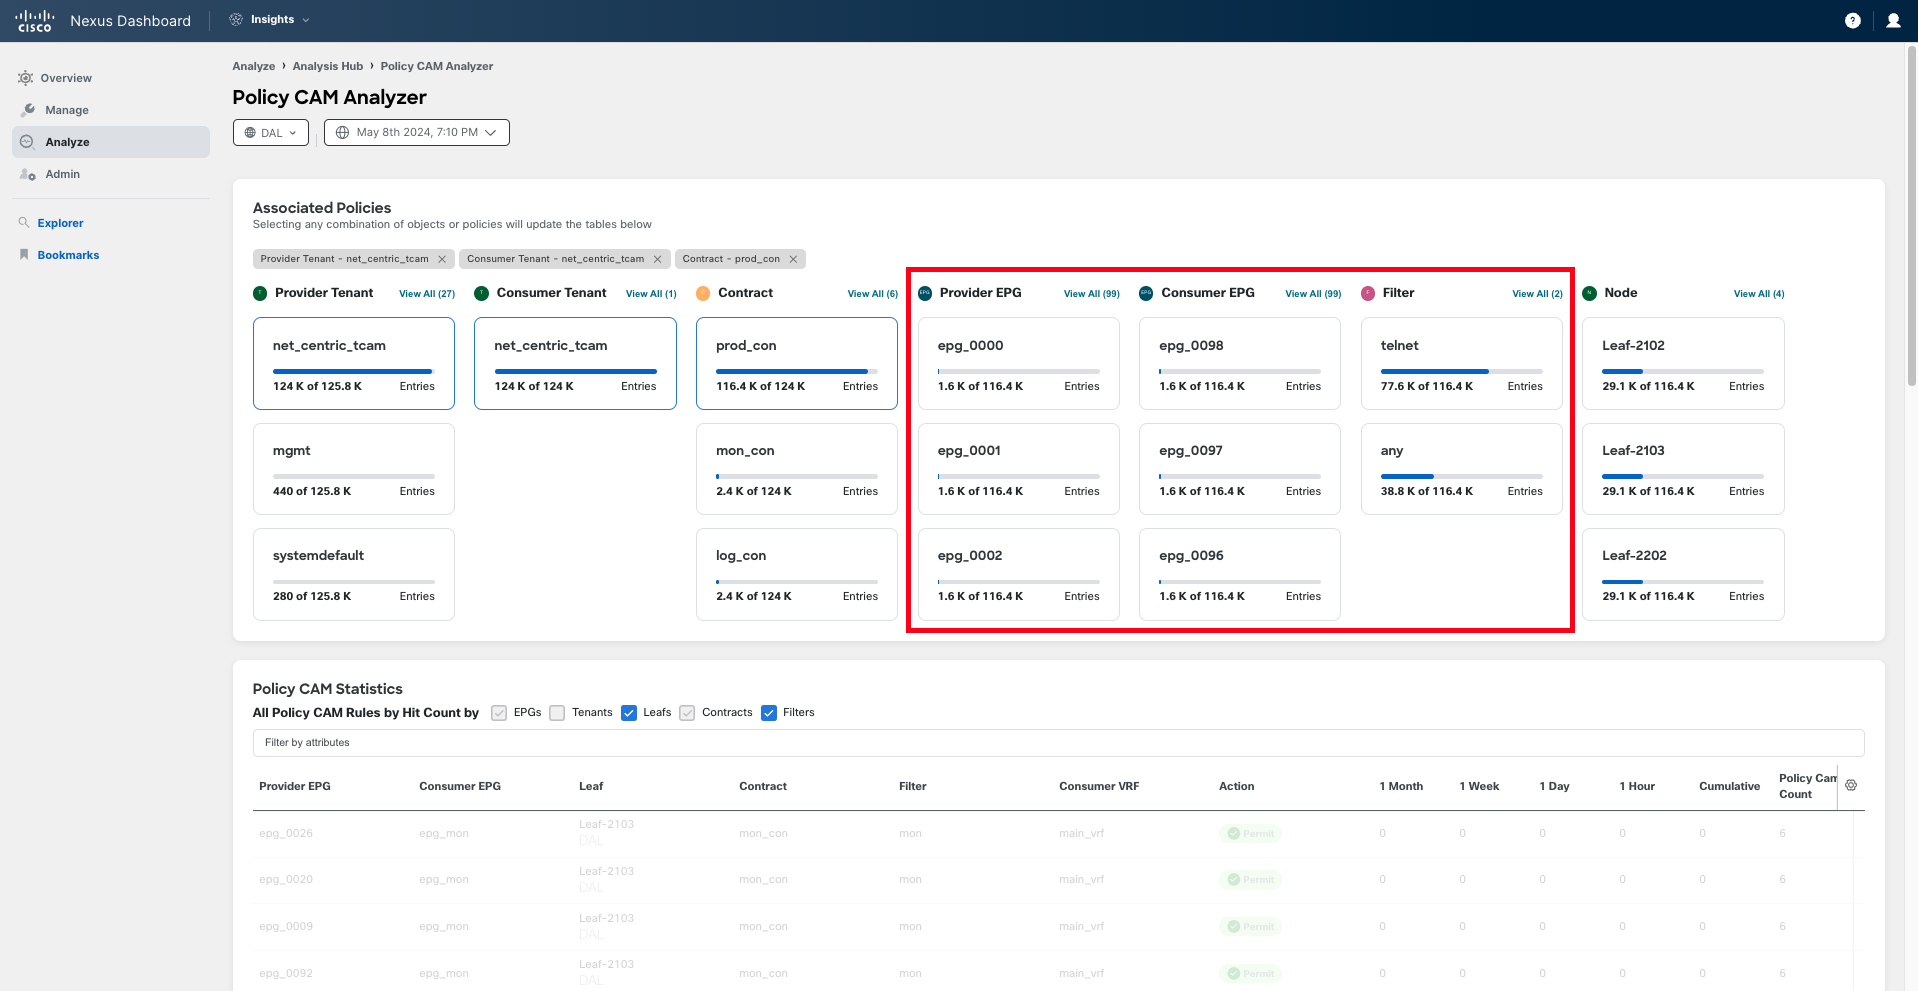
At this point, you can see that the contract prod_con is consumed and provided by a large number of EPGs. This contract has two filters, and while you don't see at this point what the filters are, you can see that there is a filter called any (likely, an ip-any-any rule) and another filter called telnet, which uses twice as many entries as any.
Note
You can see how those filters are configured, and what entries they have, either on APIC, in this policy CAM analyzer in other sections, or by using the Explore functionality on Nexus Dashboard Insights.
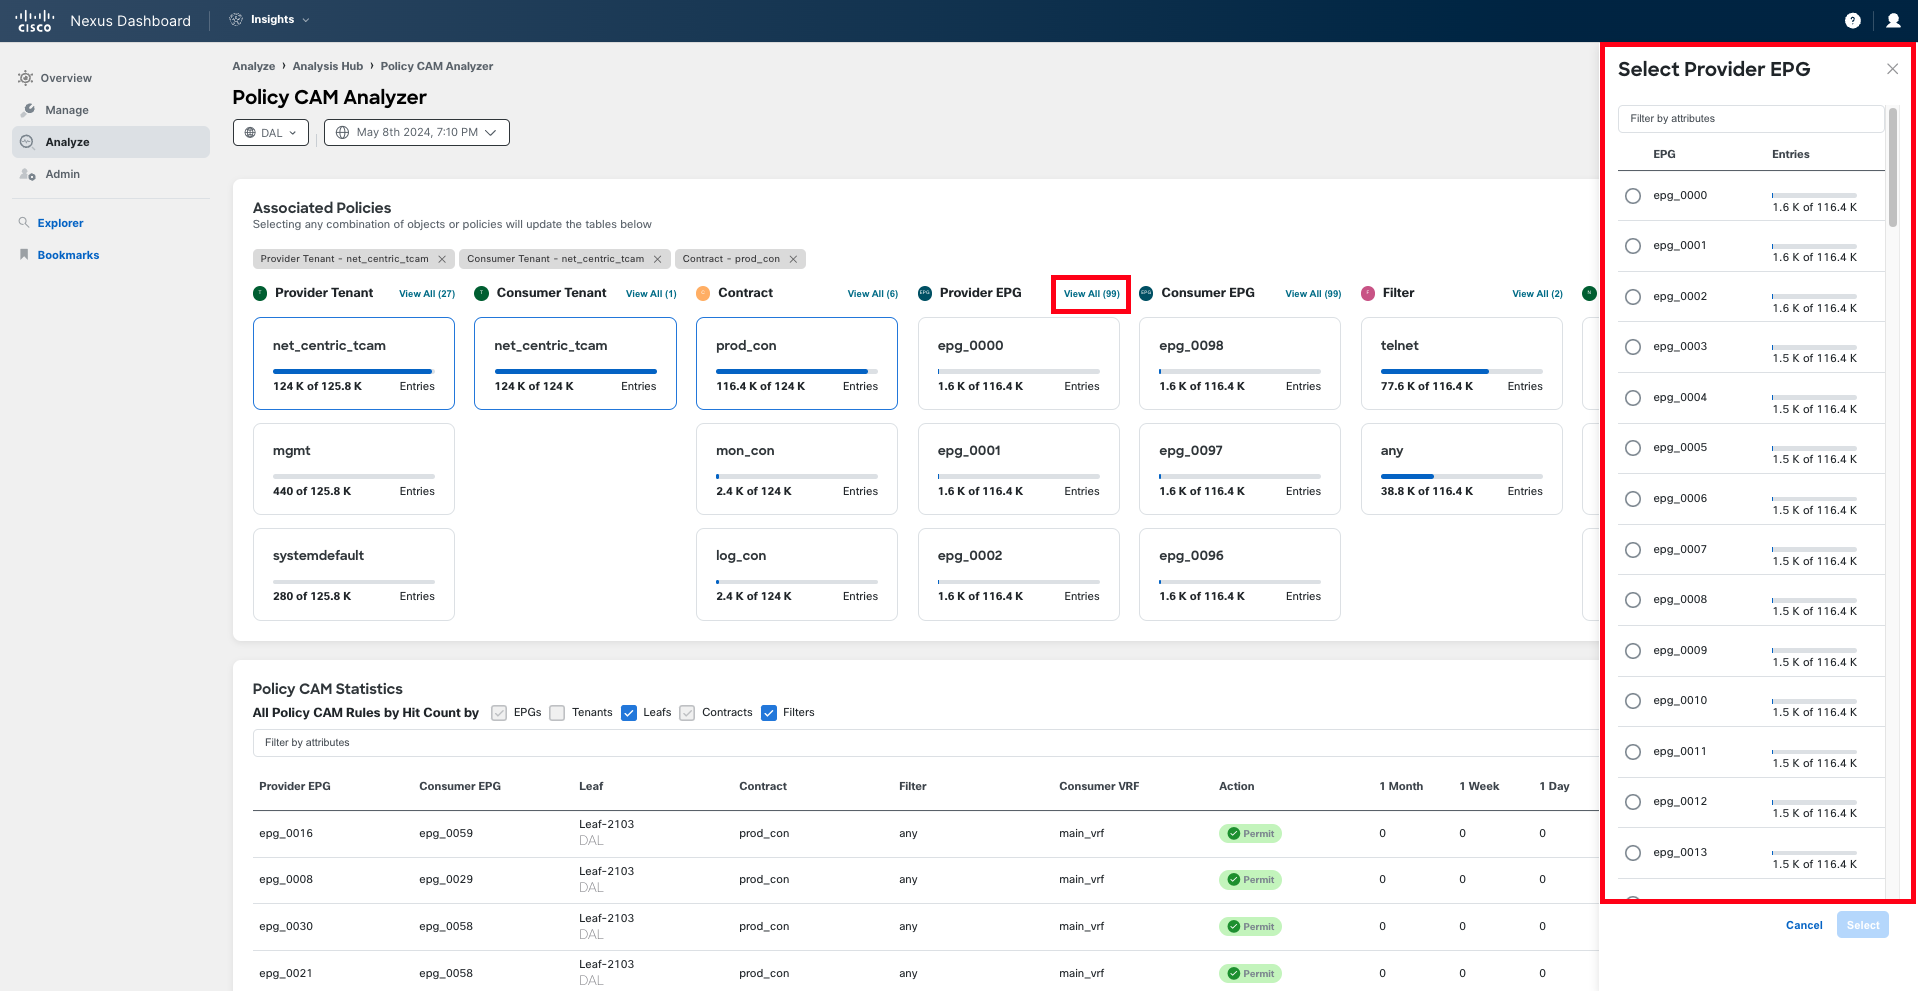
Click on the hyperlink that says View all (99) next to the Provider EPG and Consumer EPG columns to see the full list of EPGs that are providing and consuming this contract. Click also on one provider EPG and note how many consumer EPGs can communicate with it.
With all this information, you can gain a good understanding of the situation here: There is a contract that is consumed and provided by a large number of EPGs within that tenant (most likely, all or most of the EPGs that are part of the tenant). While Nexus Dashboard Insights does not provide the final solution at this stage, thanks to this analysis, you now understand that some optimization is needed. This configuration could really benefit from the use of vzAny to significantly reduce the number of TCAM entries being used.
There are other use cases where the Policy CAM Analyzer can be of great help: determining contracts that are no longer in use, identifying policy CAM issues, or analyzing whether changes in contract configuration improve TCAM utilization.
You are now done with this use case; you may move to the next one or perform the extra task below.
Extra task
If you have time, feel free to explore what else the Policy CAM Analyzer can offer. In the Associated Policies section, click on View all under tenants and locate your pod. Then, select any contract associated with your pod's tenant, and scroll down to examine sections such as Policy CAM Statistics, Policy CAM Rules, and Anomalies. You may discover beneficial information, such as whether your contract is being utilized, which leafs are registering hits, or which leafs are not. This can assist you in optimizing your policy.