Use-Case 4 - Compliance
Configuration & Segmentation Compliance
Nexus Dashboard Insights features a component under the Assurance pillar that allows the creation of Compliance Rules. You can define communication and configuration standards that the Cisco ACI fabric must adhere to. With Compliance, you can outline your fabric's "Golden" configuration and communication template. Once configured in Nexus Dashboard Insights, it will periodically analyze the state of these rules (your template) as part of the periodic assurance analysis, providing an assessment of your ACI fabric. This feature assists in auditing your network.
In this use case, you will learn how to navigate Compliance, explore the configurable options, investigate the status of already established rules, and you will set up a new rule.
Scenario
Consider the following scenario.
The engineering team has created Compliance rules that are applied in Nexus Dashboard Insights to monitor critical configurations, policies, and objects in ACI. These rules delineate your network's golden state, or the standard that the fabric should consistently meet.
Task 1: Upon arriving at work in the morning, you begin your daily routine of checks to ensure everything is functioning correctly, or reviewing if there are any issues, faults, or anomalies.
Task 2: You will also configure a new rule based on guidance from the engineering team, which will aid in securing the upcoming change window during which new configurations will be applied to an existing policy.
Solution
Step 1
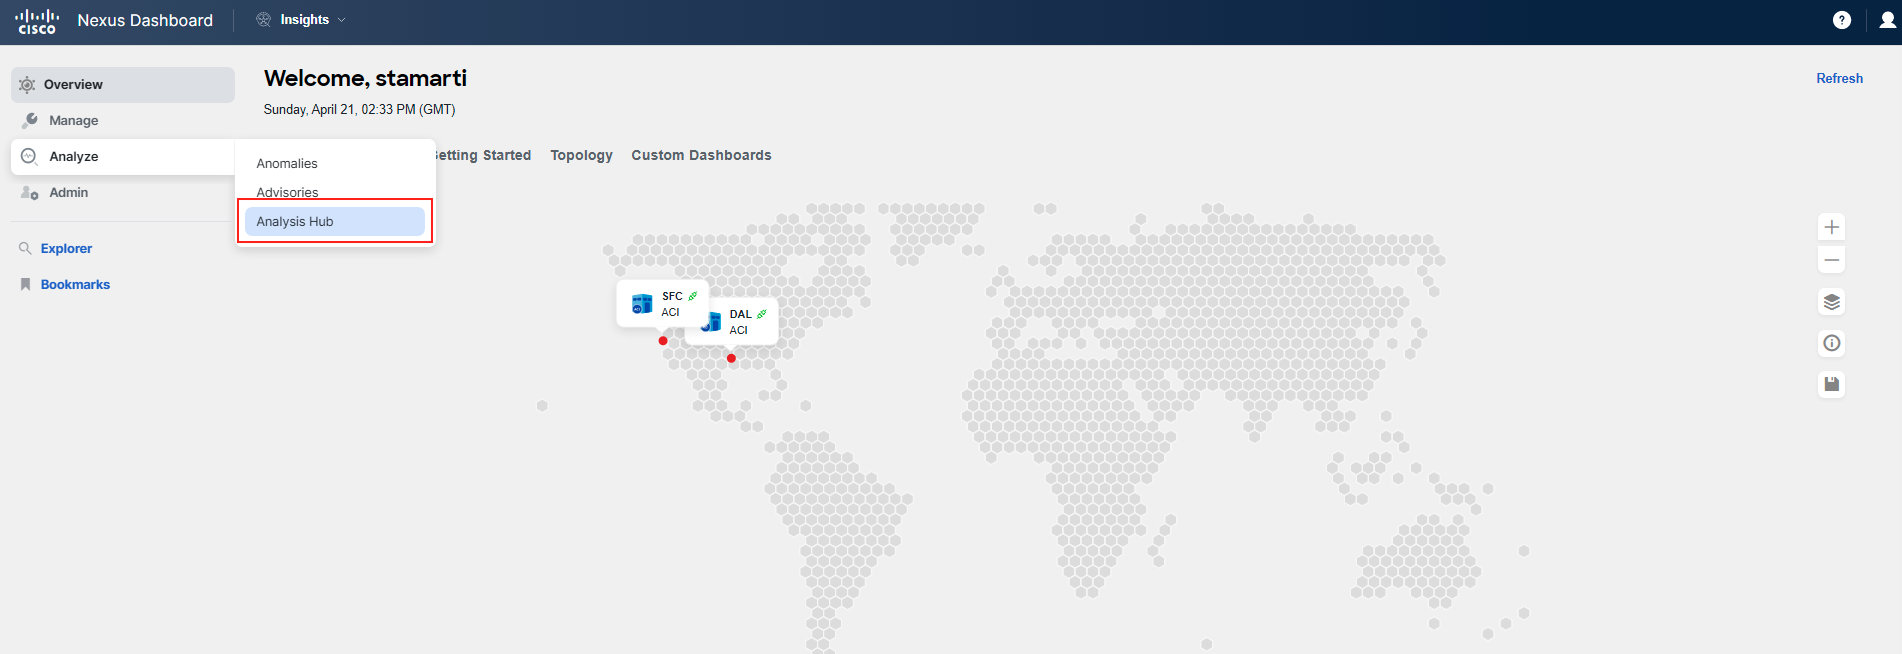
To audit the state of your network, you navigate to the Compliance dashboard in Nexus Dashboard Insights.
You access the Nexus Dashboard Insights UI and start by going to Analyze Hub > Compliance.
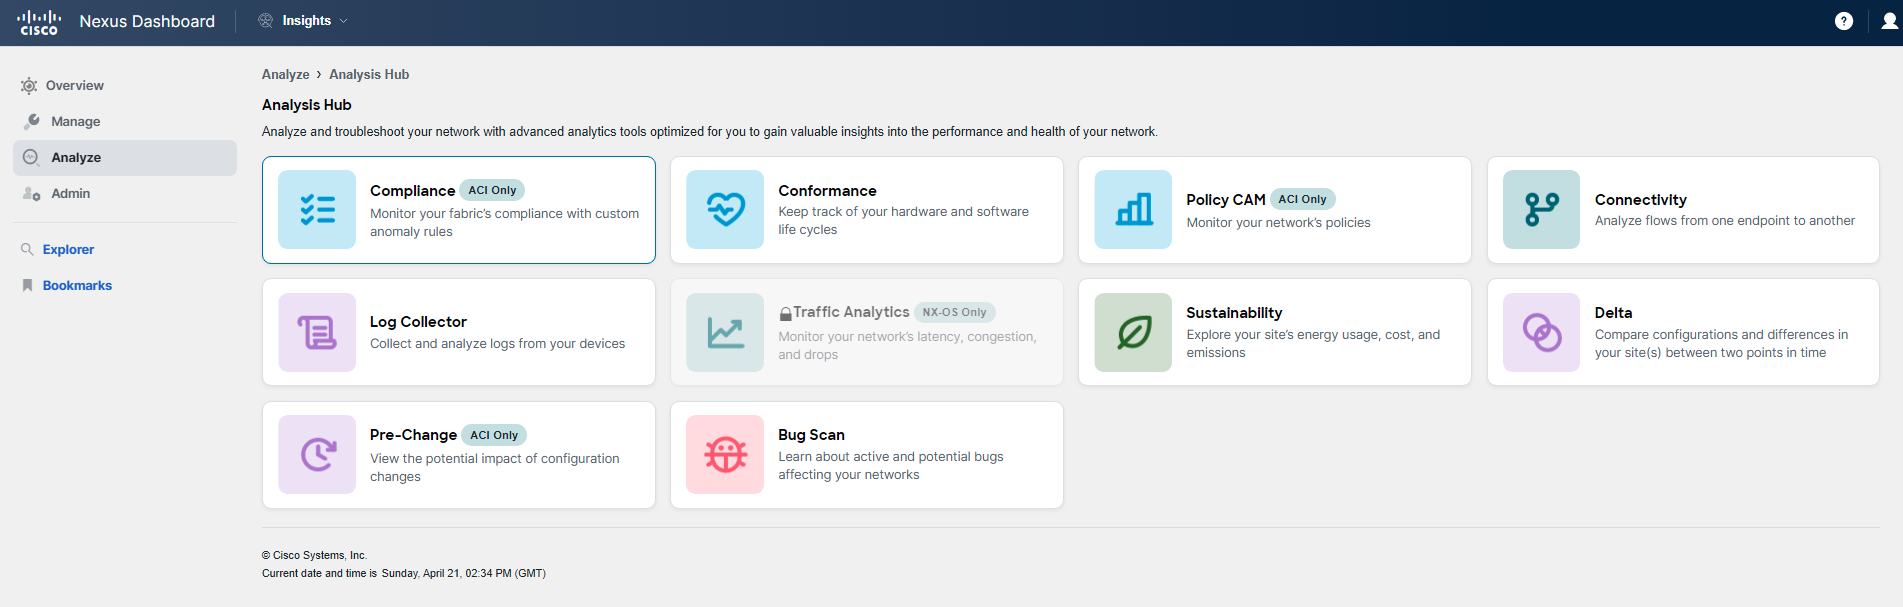
Step 2
Now you're in the main Compliance view. You have the option to switch between sites (including online and offline) and select the desired date/time window. Depending on your selections, the Compliance summary will reflect the state at the chosen time, on the selected date, or for the specified site. You also have the capability to Re-run the analysis if necessary.
Let's scroll down to perform your daily morning routine check (task 1).
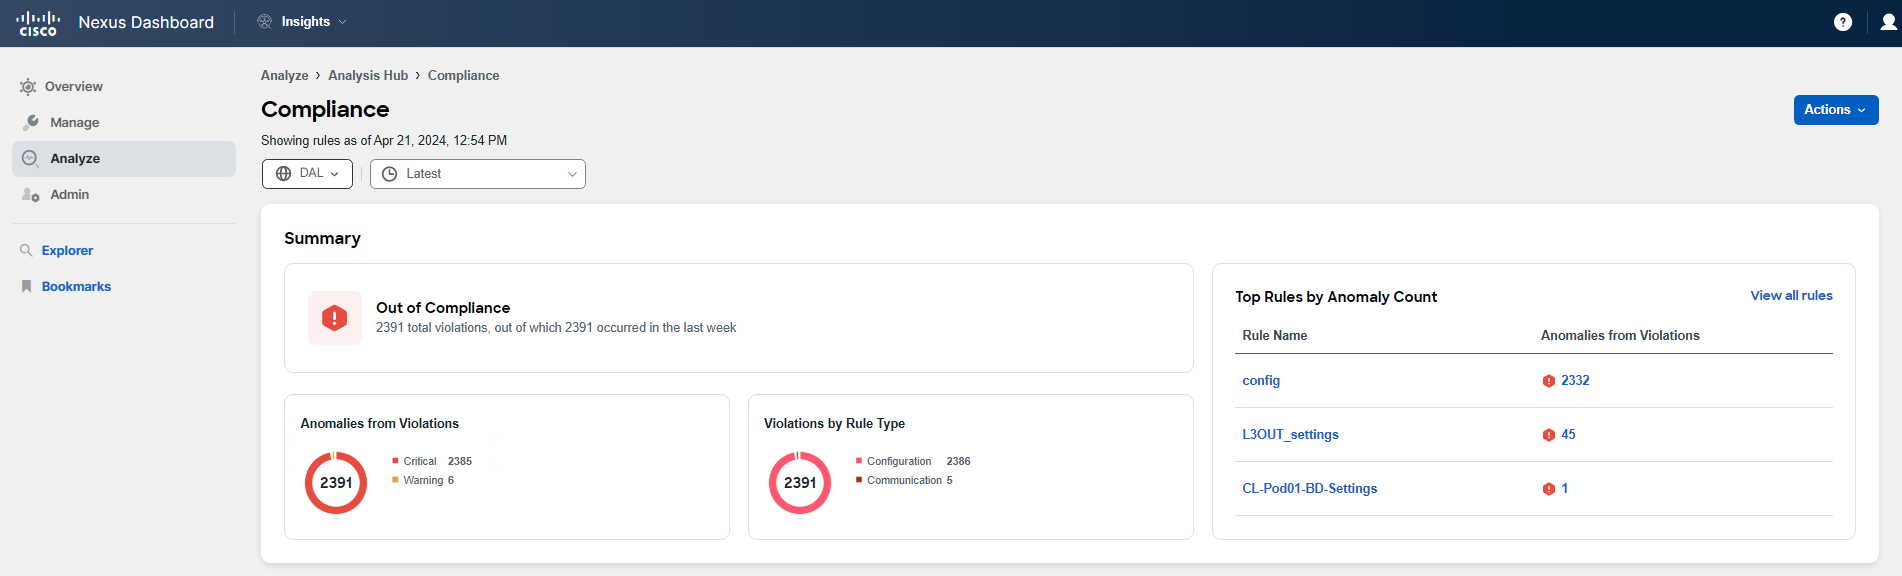
Step 3
In the Compliance summary, you'll see a dashboard that presents the state across various resources, as well as a list of compliance rule violations sorted by severity. Scroll down to the Compliance Rules section to review the current status of the ACI fabric in relation to the defined golden rules.
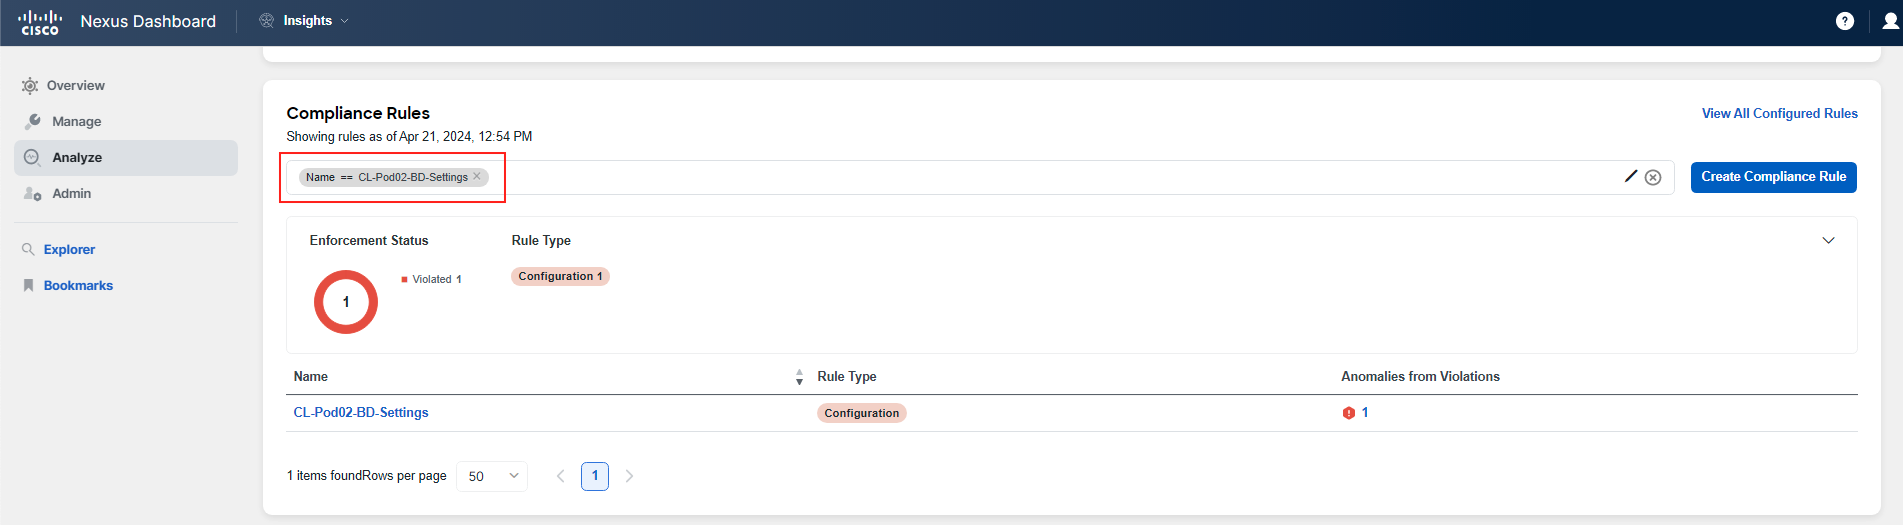
Note
Please be aware that as this is a shared environment, you will encounter rules set by other participants. For this reason, it is recommended to use the filter pane to isolate the rules that are relevant to you. Filter by the name of the rule as shown in the screenshots provided. All POD IDs have two digits, such as Pod02 or Pod20. Filter using the POD ID that has been assigned to you.
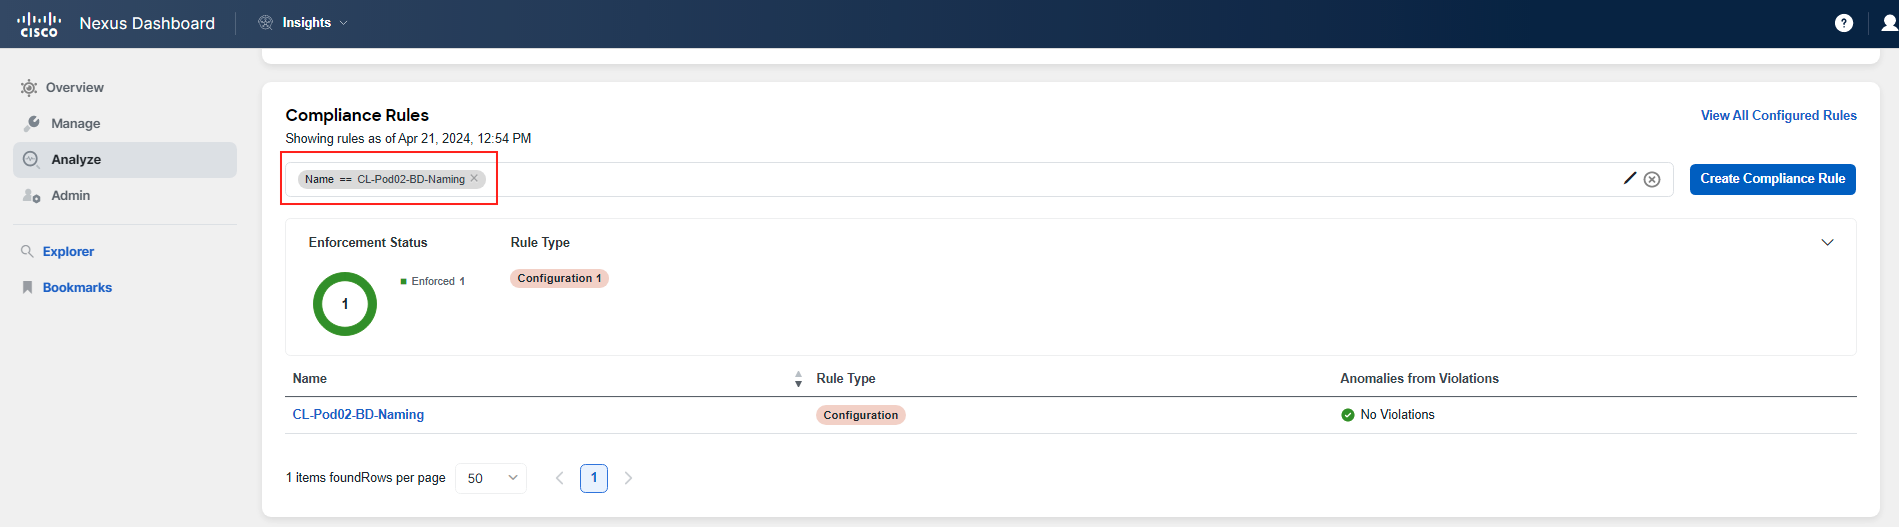
Step 4
You have reviewed the rules and their states for your pod.
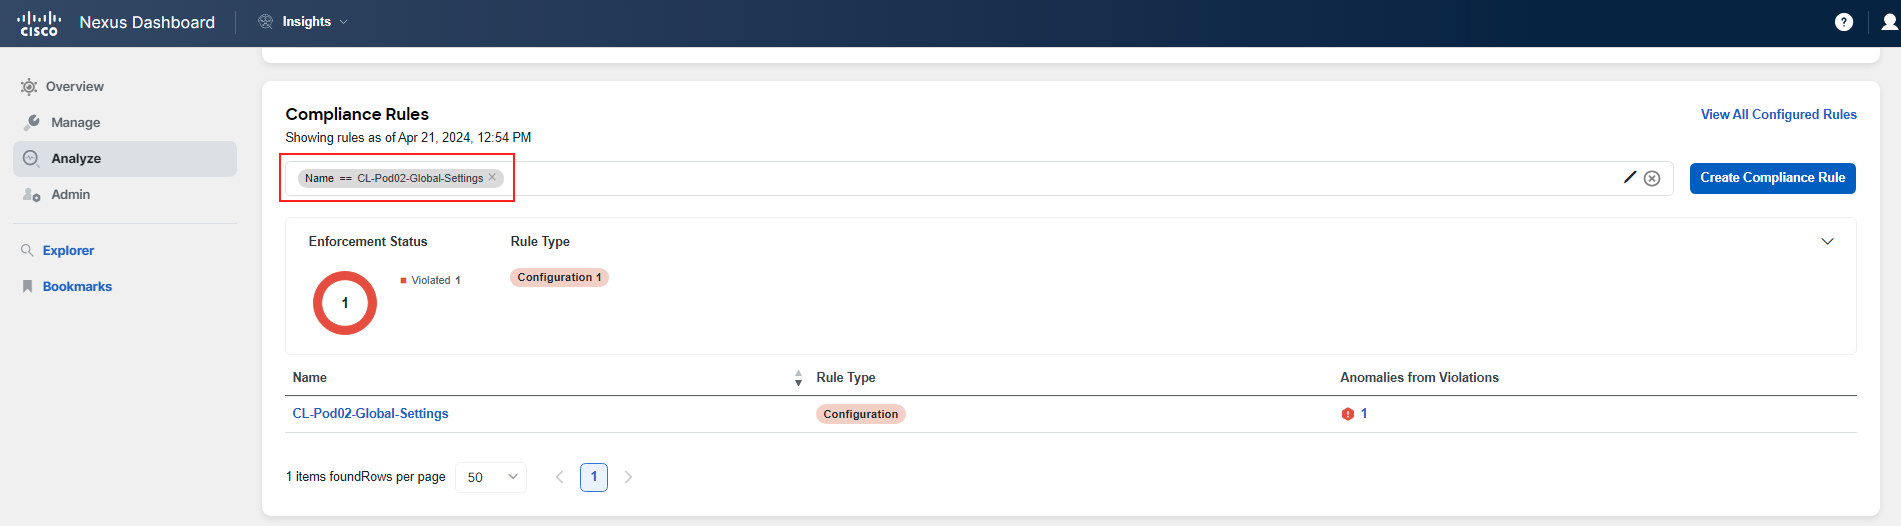
There can be three states: Not verified, Enforced, and Violated. In this section, you can also see the number of violations associated with each rule, ranging from No Violations to numbers greater than 1.
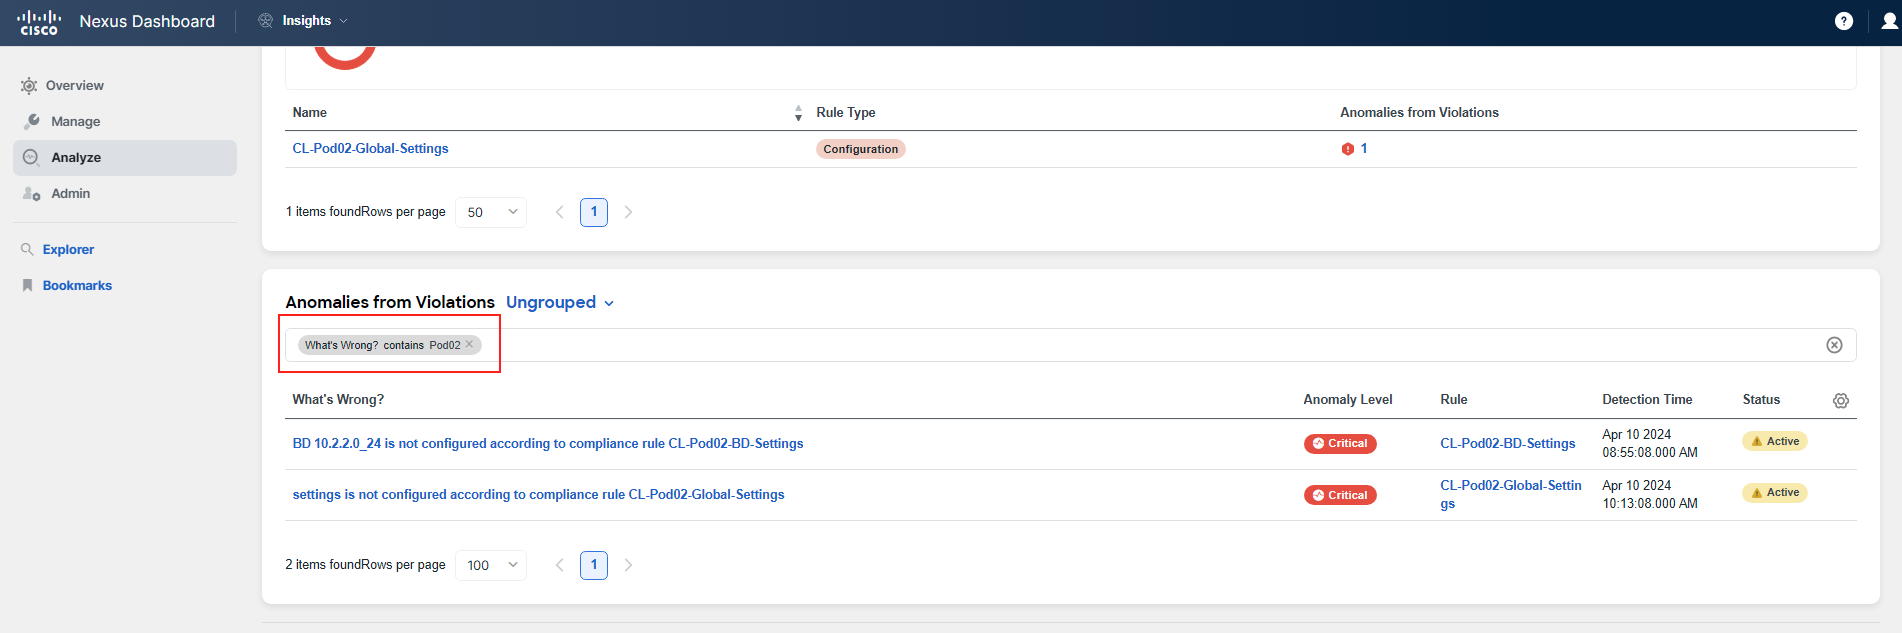
Now let's focus on those rules that are being violated. Scroll down to the section titled Anomalies from Violations.
Note
Since this is a shared environment, you will encounter rules set by other participants. It is therefore recommended to use the filter pane to display only the rules that are relevant to you. You will need to change the view to Ungrouped. Then, create a filter that includes your PodID. All PodIDs have two digits, such as Pod02 or Pod20.
You will notice there are 2 violations in the system for the rules CL-PodID-Global-Settings and CL-PodID-BD-Settings. You will see 2 findings associated with these rules.
Step 5
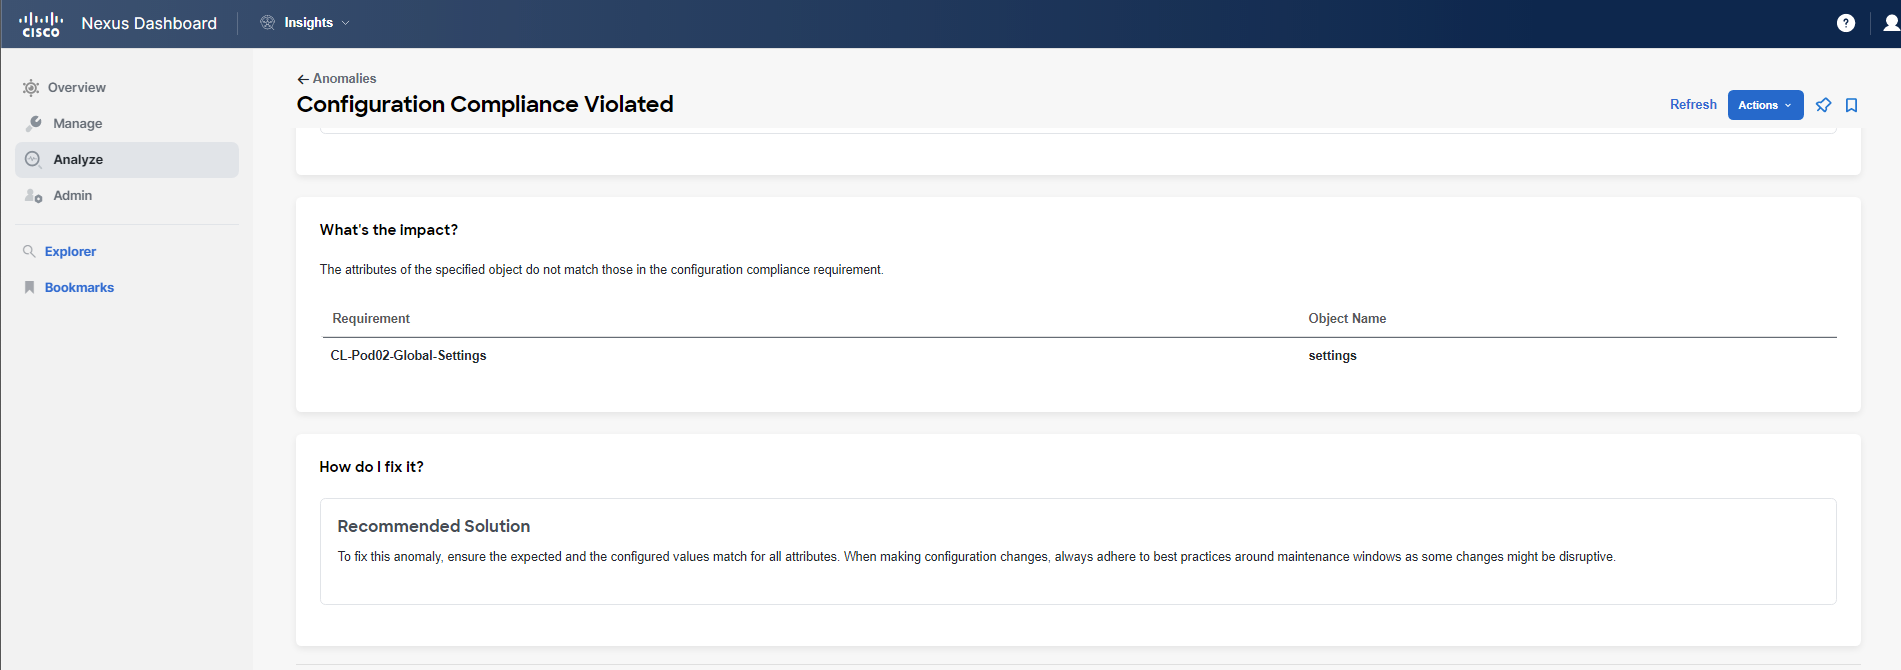
Click on the finding related to the Global Settings rule under the What's Wrong? section. The associated anomaly will be displayed, and you can see that this is a critical level violation. You can now analyze the anomaly view, which provides answers to four main questions: "What's wrong?", "What triggered this anomaly?", "What's the impact?", and "How do I fix it?".

Step 6
Upon investigation, you find that two global settings do not align with your defined rule, which serves as your golden configuration template. To verify this discrepancy, you can log in to the APIC and check the configuration under System Settings. However, since this is a shared environment, you will not take any steps to remediate this violation. Under normal circumstances, you would want to delve into when, who, and why this change occurred using various tools such as the specific object-level audit log in APIC, Delta Analysis in Nexus Dashboard Insights (which is covered in a different use case), or your organization's internal tools. It's possible that this change reflects a new standard, in which case the compliance rule would need to be updated accordingly. You can now click on the back arrow in the top left corner of the screen to return to the Compliance Analysis.
Step 7
Next, you will investigate the anomaly related to the BD Settings rule. If it's not already filtered, please repeat the procedure from Step 4.
By clicking on the text related to the BD Settings rule under the What's Wrong? section, the detailed view of the anomaly will be displayed. In this view, you can analyze the specifics of the violation, which provides answers to the four main questions: "What's wrong?", "What triggered this anomaly?", "What's the impact?", and "How do I fix it?".
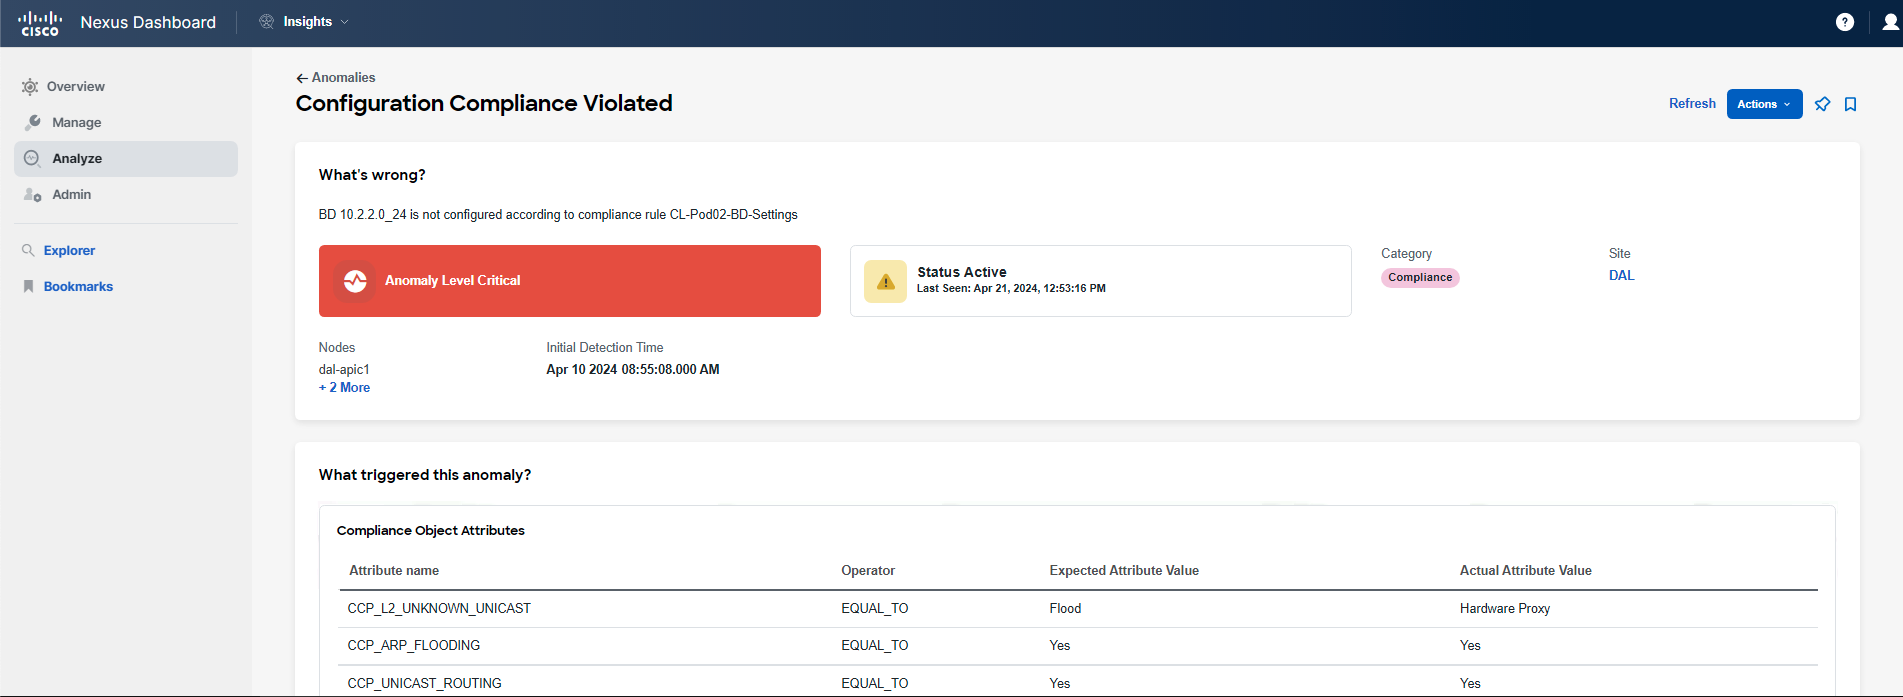
Info
This is an ideal opportunity to create a pin on your dashboard, allowing you to easily return and check the status at a later time. You can pin it to your Custom Dashboard named according to your POD ID by clicking on the pin icon in the top right corner.
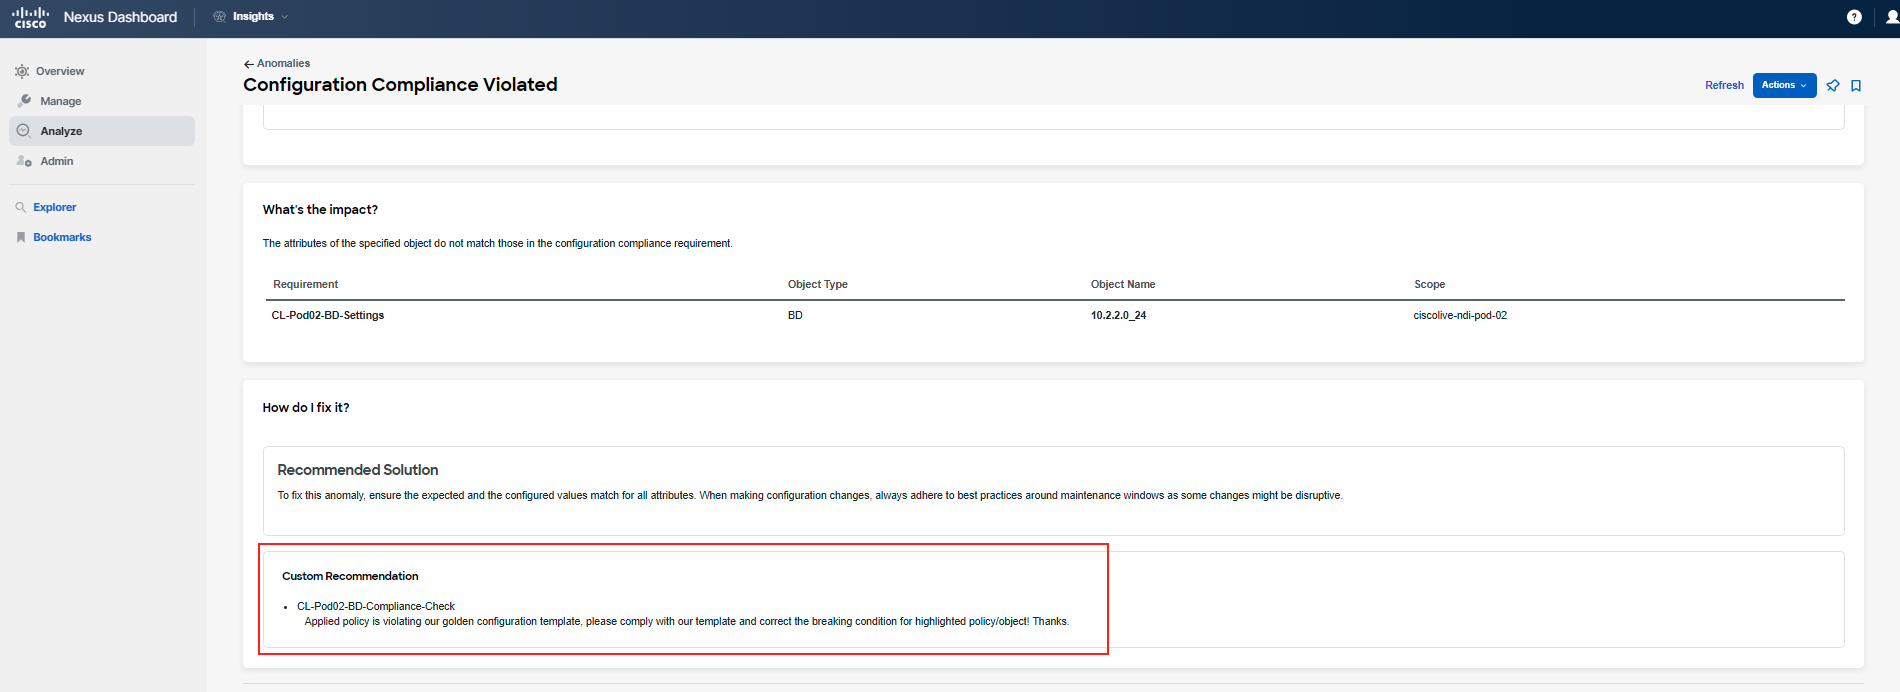
The Custom Recommendation message can appear on an anomaly when a Compliance rule is matched within an Anomaly rule. This feature has been made possible with the latest Nexus Dashboard (ND) release, ND 3.1. Anomaly rules enable you to manage anomalies by acknowledging them or by providing a custom message, as shown in this example. Consequently, if an anomaly is triggered due to a Compliance rule, this message will be attached to the raised anomaly. This functionality empowers you to include messages that can help clarify the situation and potentially expedite resolution times.
Now, let's examine how this specific anomaly rule was set up. Navigate to Manage > Rules > Anomaly Rules and apply a filter with Name contains PodID, where ID corresponds to your pod number in a two-digit format.
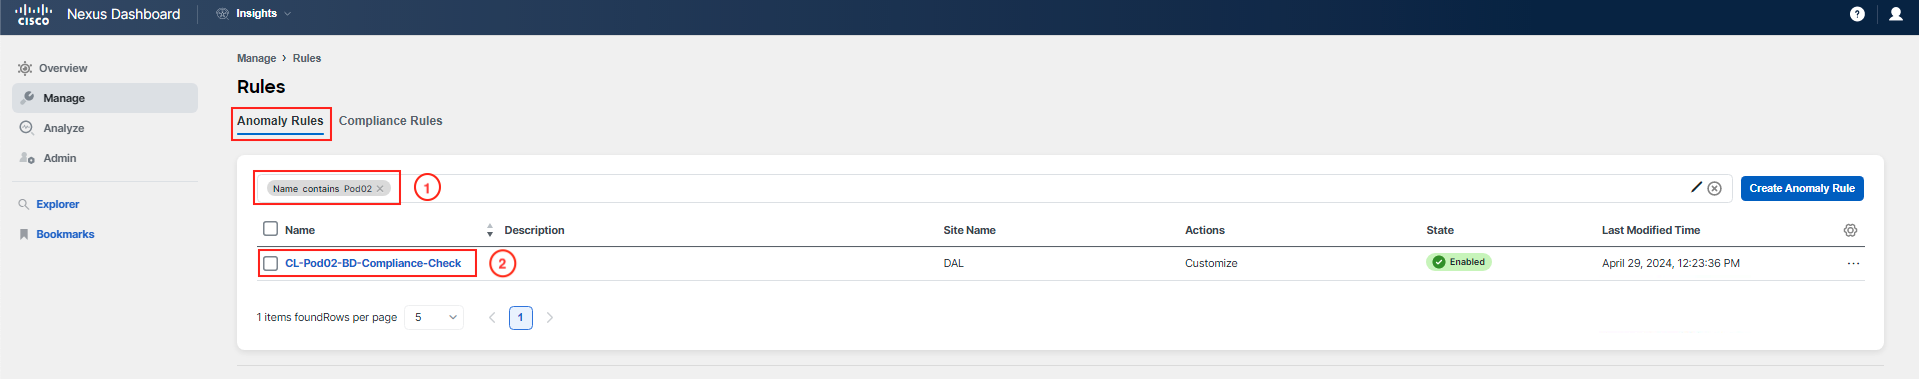
Click on the rule that you have just filtered to review its main setup. This will give you insight into the criteria and conditions that have been configured for this particular anomaly rule.
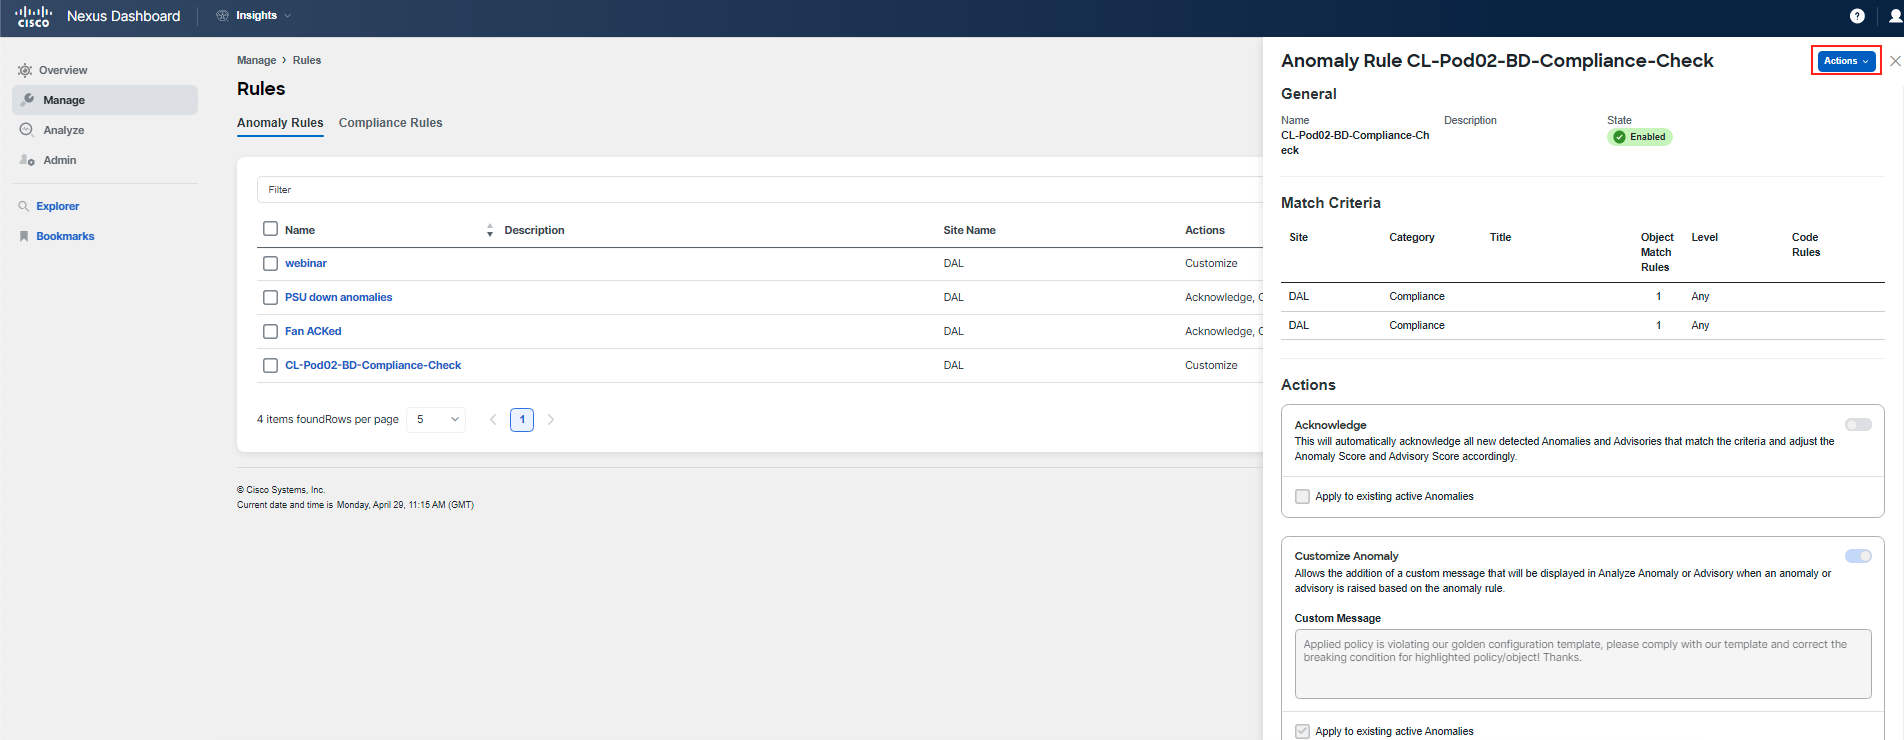
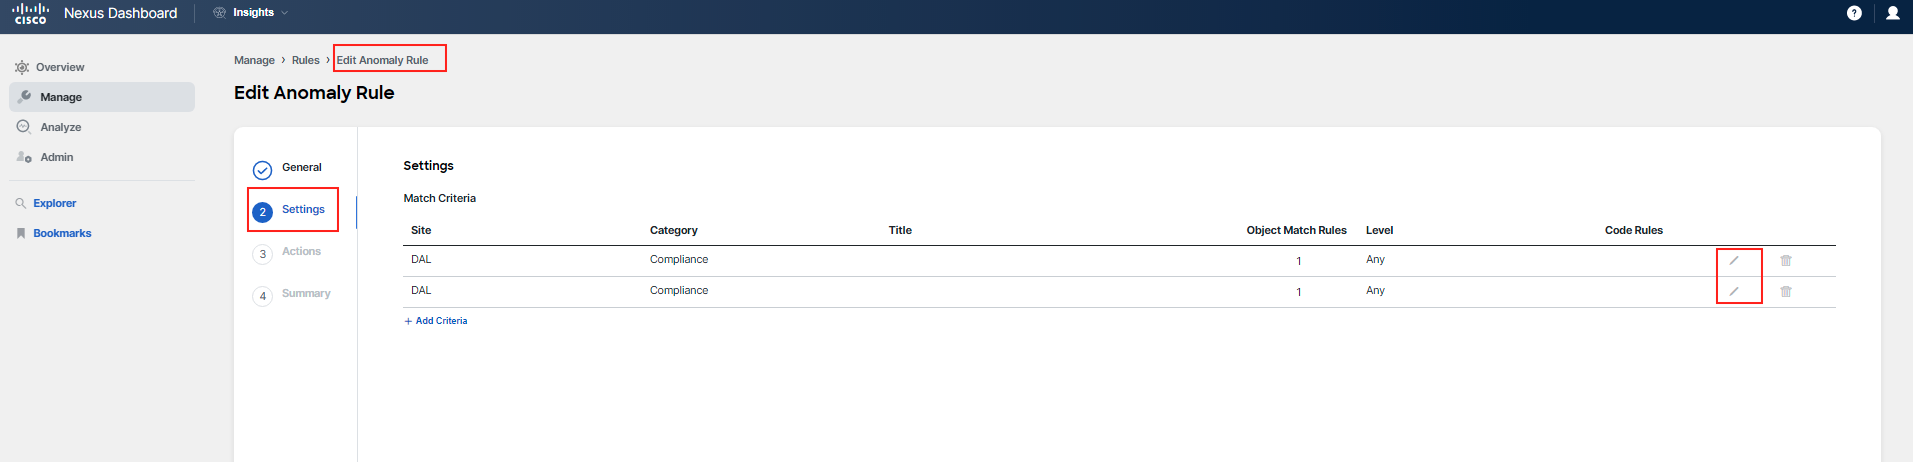
In order to see details of the matching logic, you will have to click on the Actions button and then click Edit. Go to Step 2 Settings of the rule and click on the pencil icon for each matching criteria.
To delve into the specifics of the matching logic for the rule, you'll need to access the rule's editing interface. Click on the Actions button associated with the rule and then select Edit. This will take you through the rule configuration steps, but do not change anything.
Once you are in the editing mode, proceed to Step 2 Settings of the rule configuration. Here, you'll see the matching criteria that have been established for the rule. To examine the details of each criterion, click on the pencil icon next to them to bring up the configuration details. This will allow you to see the conditions that must be met for the anomaly rule to be triggered.
Warning
Again, do not change anything.
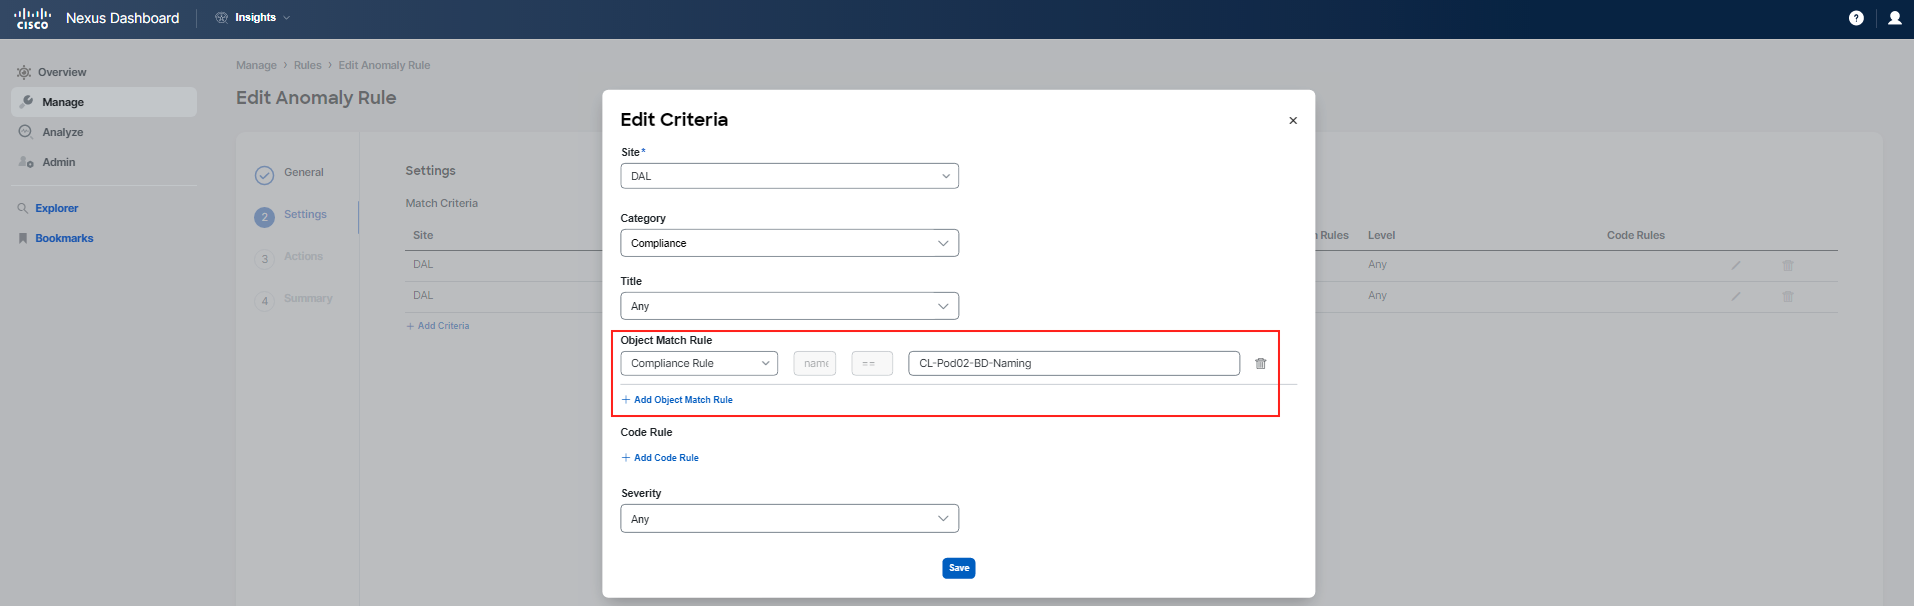
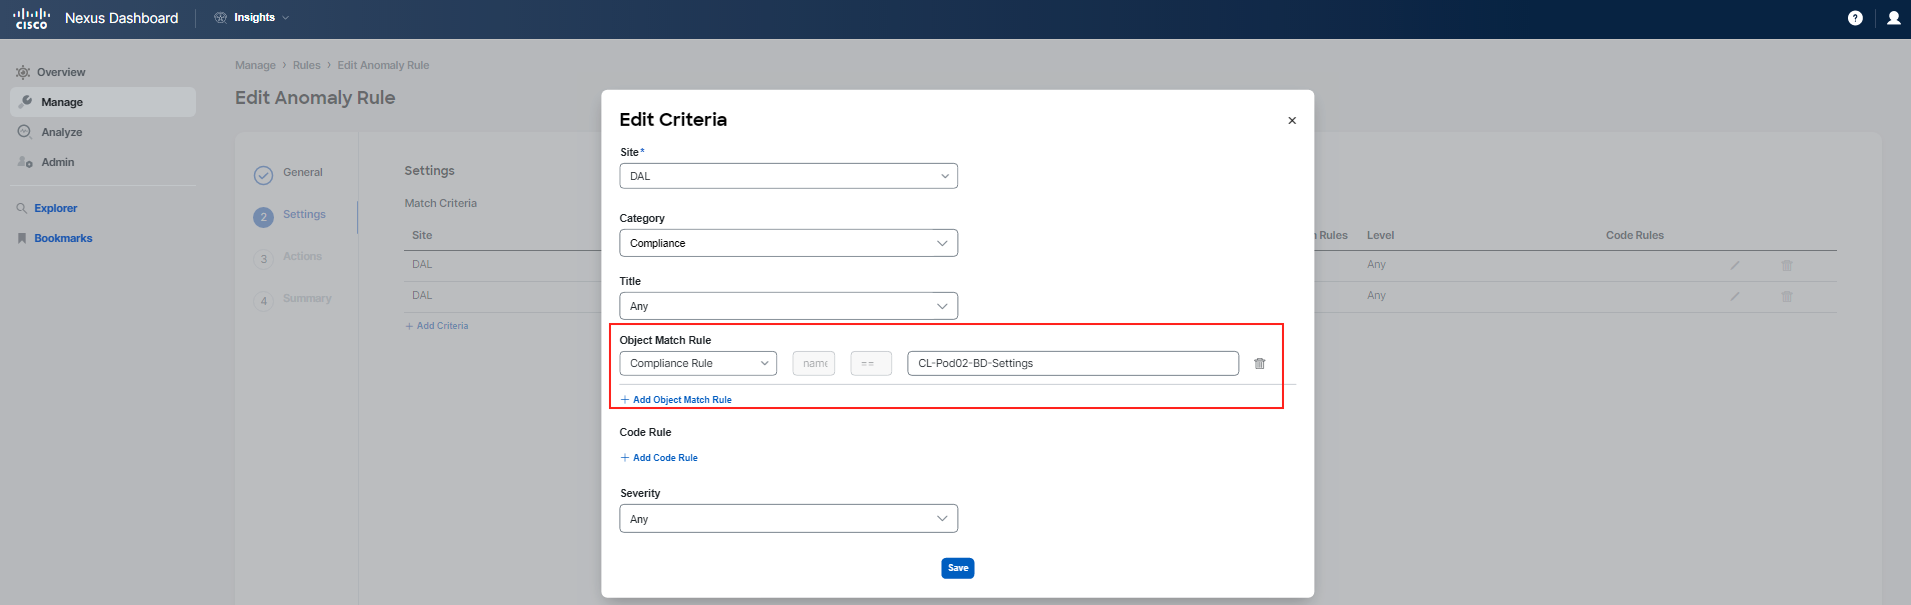
Alternatively, you may just review next 3 screen-shots.
Once you have completed your review, click on the Cancel button to exit the rule configuration without making any changes.
The rule you have just reviewed is designed to apply your custom recommendation message to each anomaly that is raised and matches either by the compliance rule related to "BD-Naming" or "BD-Settings" in your specific pod.
Step 8
As you have determined, one of the Bridge Domains (BDs) in your pod has been configured with incorrect L2 Unknown Unicast settings, which is triggering an anomaly in Nexus Dashboard. To verify the current configuration of this BD, you will need to navigate to the APIC and examine its settings. While there, it might be beneficial to review the configurations of other BDs as well.
Note
Our suggestion: In your production environment, if you were conducting a similar investigation, you might also utilize the Delta Analysis feature to determine what changes were made, when they were made, and who made them. However, you will not perform a delta analysis within this use case. This feature is covered in more detail in another part of this lab.
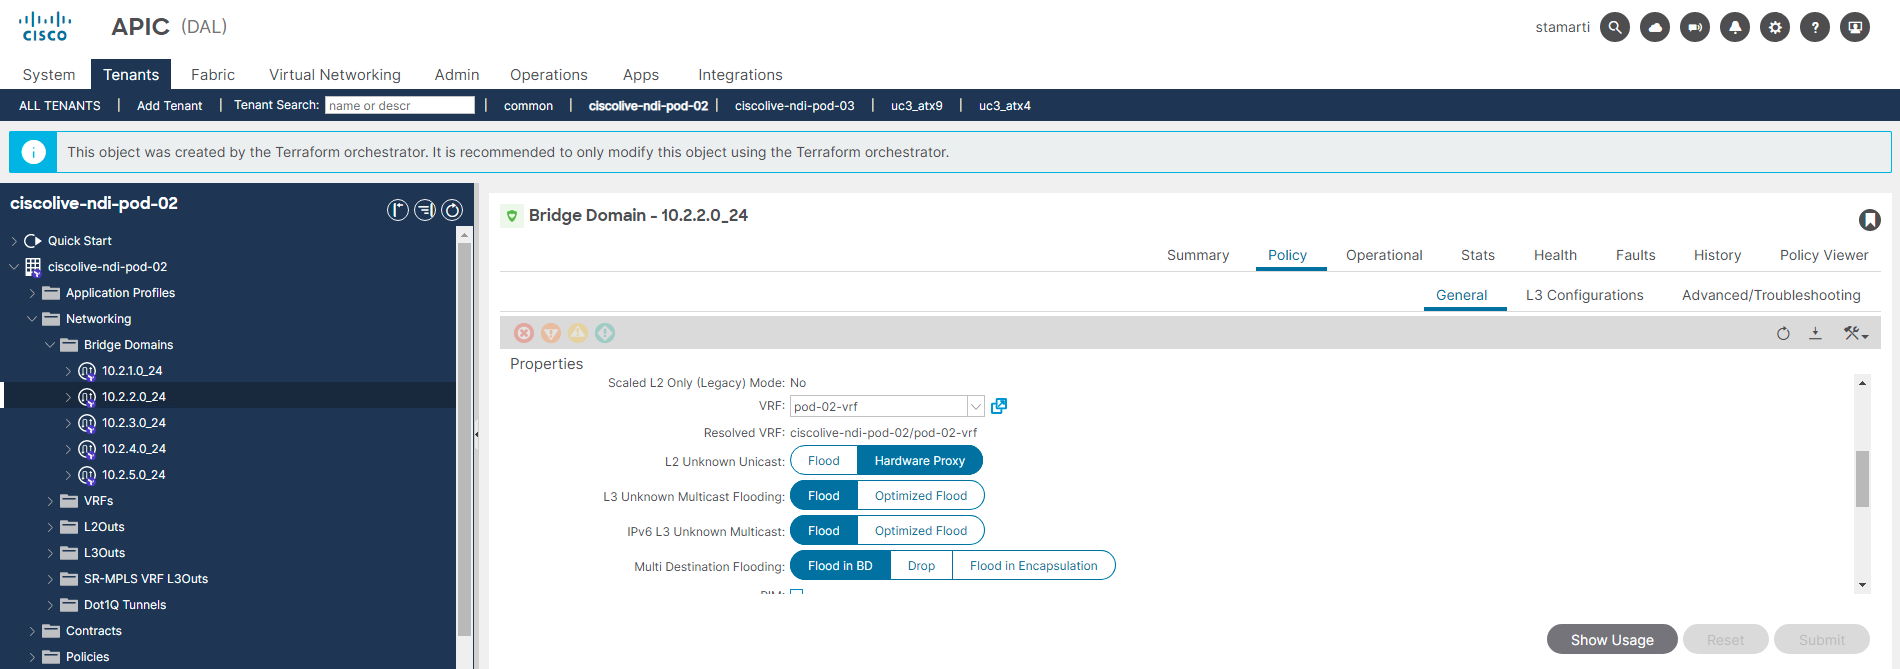
Go ahead and remediate the BD level configuration to expected value of "Flood".
Step 9
Warning
The following step is for informational purposes only. In this lab setting, a background script is utilized to trigger an instant Assurance Analysis to create a snapshot of the ACI fabric. In a production environment, you would typically initiate the assurance analysis for your site manually at this point. There is a separate chapter at the end of this guide that describes how to perform this action, which we recommend you review after completing this lab.
Step 10
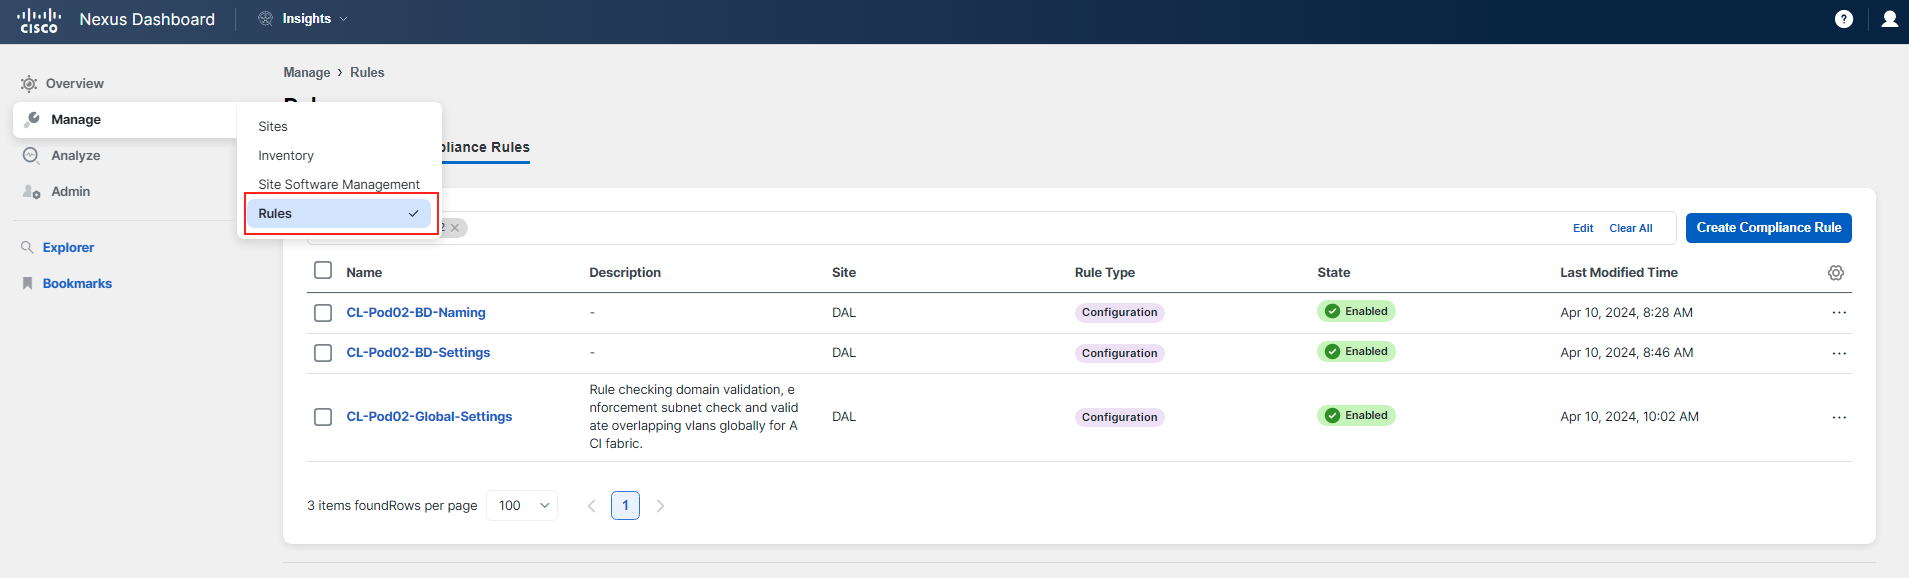
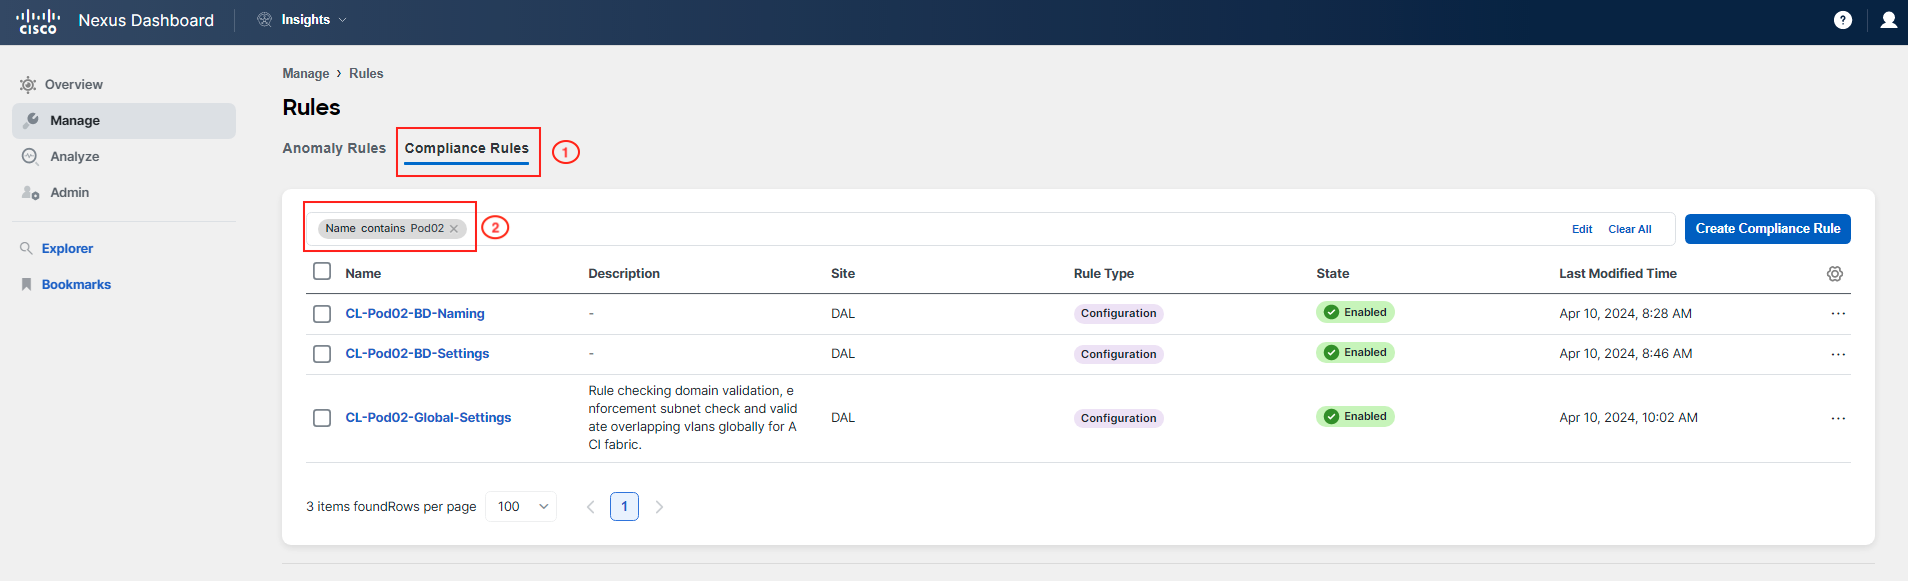
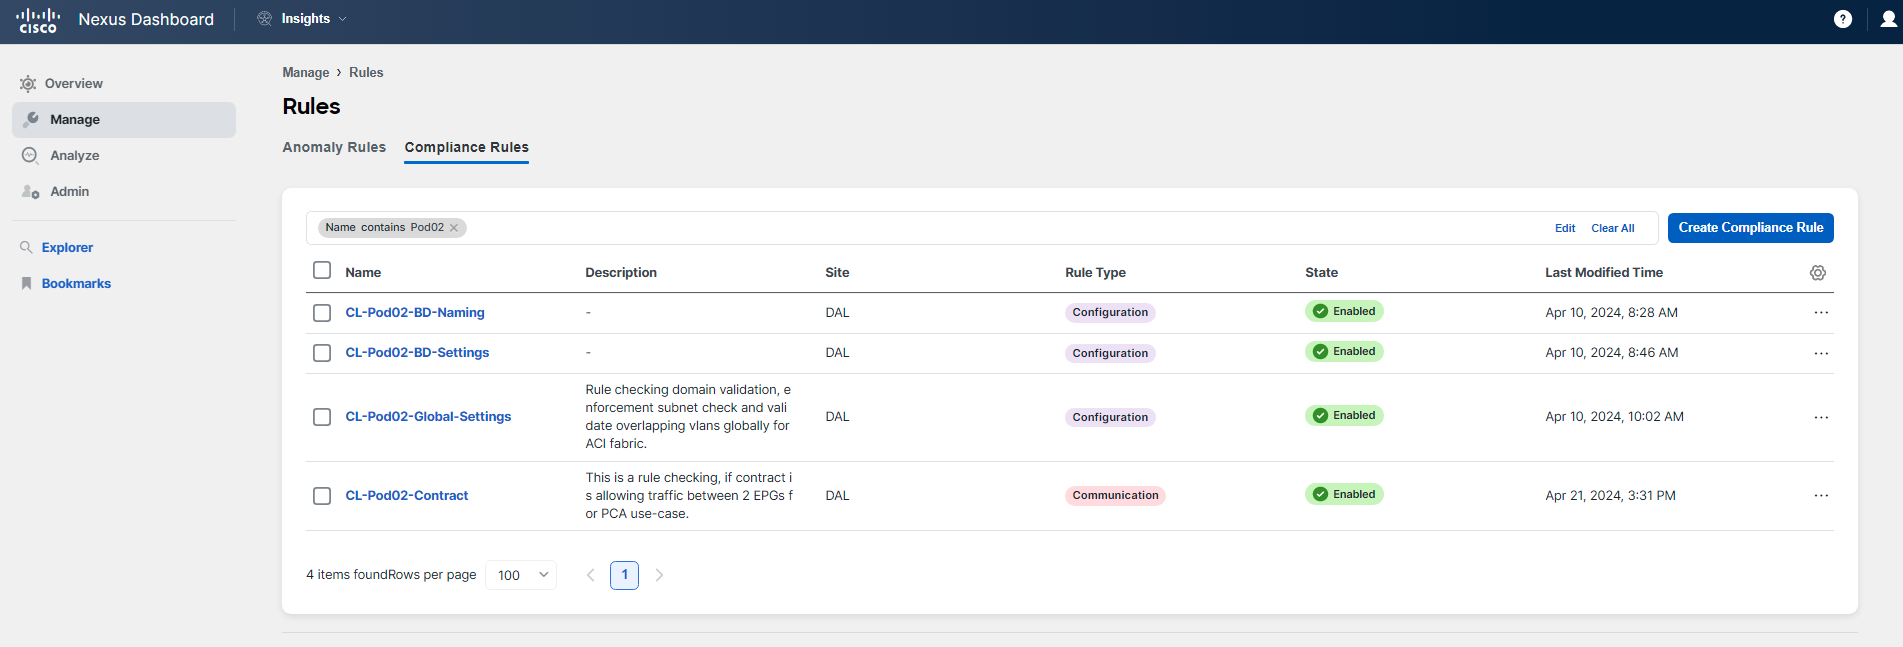
While the assurance analysis is being prepared based on the background script trigger, let's examine the rules that are currently in the state of Enforced. There is one enforced rule named in the format CL-PodID-BD-Naming. You can return to Analyze Hub > Compliance to confirm that this rule is enforced or refer back to one of the previous screenshots that displays it. To understand what this rule is enforcing, proceed to Manage > Rules > Compliance Rules.
Note
As before, you will see all the rules from all participants in this shared environment. To focus on the rules that are relevant to you, use the filter pane as you have done previously. Apply a filter for Name contains PodID. Be sure to filter by the name that includes your two-digit PodID, such as Pod02 or Pod20.
Step 11
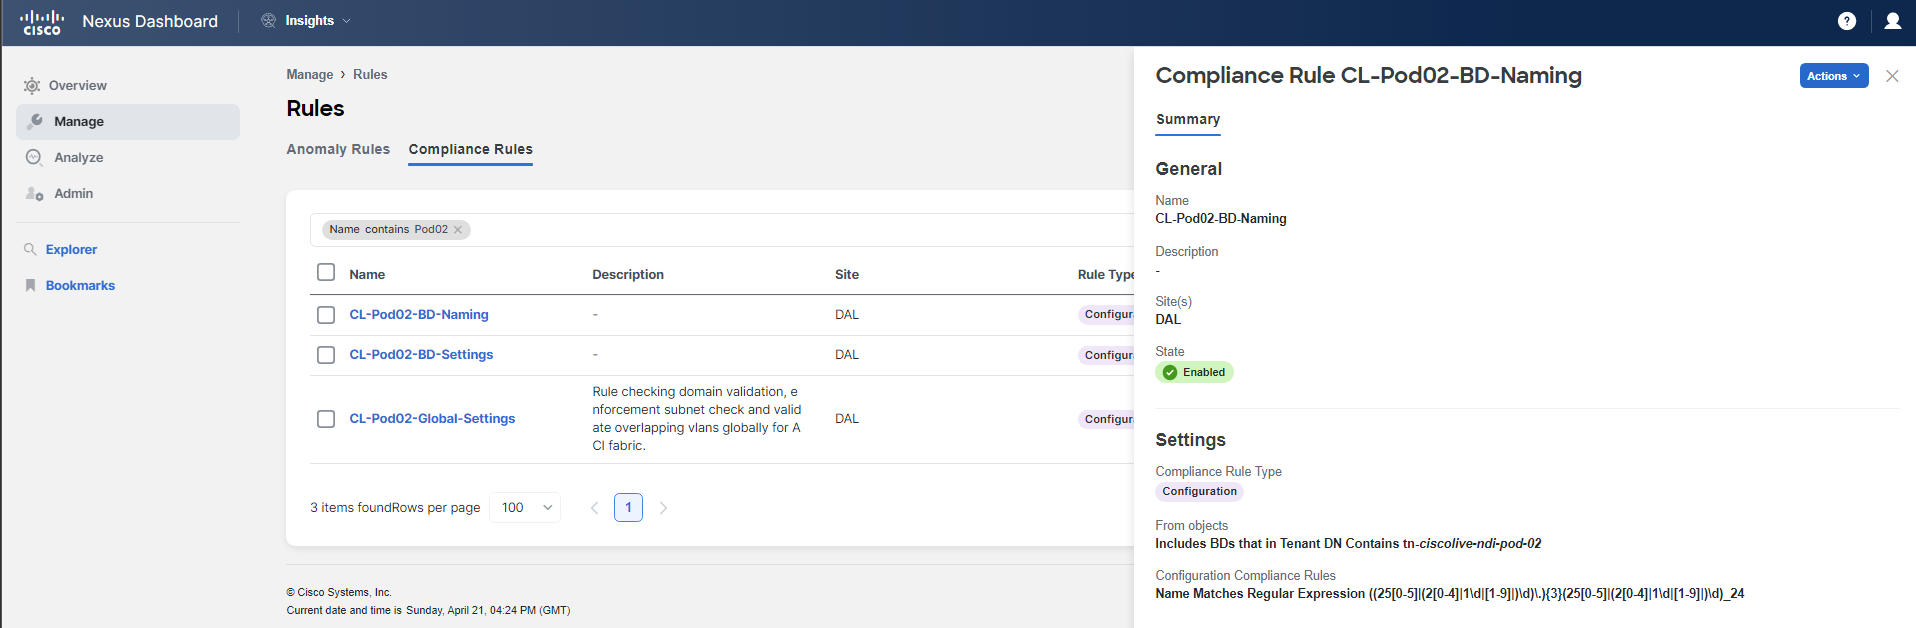
Click on the rule CL-PodID-BD-Naming. You will see how the rule is configured. Note specifically Settings part which gives information on how the rule is set up and what kind of check it performs.
Click on the rule named CL-PodID-BD-Naming to view its configuration. Pay particular attention to the Settings section, which provides detailed information about how the rule is set up, including the specific checks it performs. This will help you understand the criteria the rule uses to enforce the correct naming conventions for Bridge Domains within your ACI fabric, ensuring compliance with your organization's standards.
Extra task
Should you find yourself with additional time after completing the main activities of this lab, consider tackling this extra task. You have the opportunity to experiment with the CL-PodID-BD-Naming rule by configuring new Bridge Domains (BDs) in your Pod in a way that would violate the rule. Keep in mind that each time you make a configuration change (create, edit, delete), you must wait for the assurance analysis to complete a new data collection cycle to reflect the updated state of your environment. There is a script running in the background to trigger constant analysis, but it may take some time for the changes to be analyzed. This task is intended only for those who have completed all use-cases and their main steps.
Step 12
You can examine other rules in a similar manner. Pay special attention to the CL-PodID-Global-Settings rule that was mentioned earlier. You'll notice that this rule is defined using a template rather than a configuration through the UI. To learn more about how this rule was set up, click on Actions > Edit in the top right corner of the rule's summary. Proceed to Step 2 Settings and click on the eye symbol to view the template and understand its configuration.
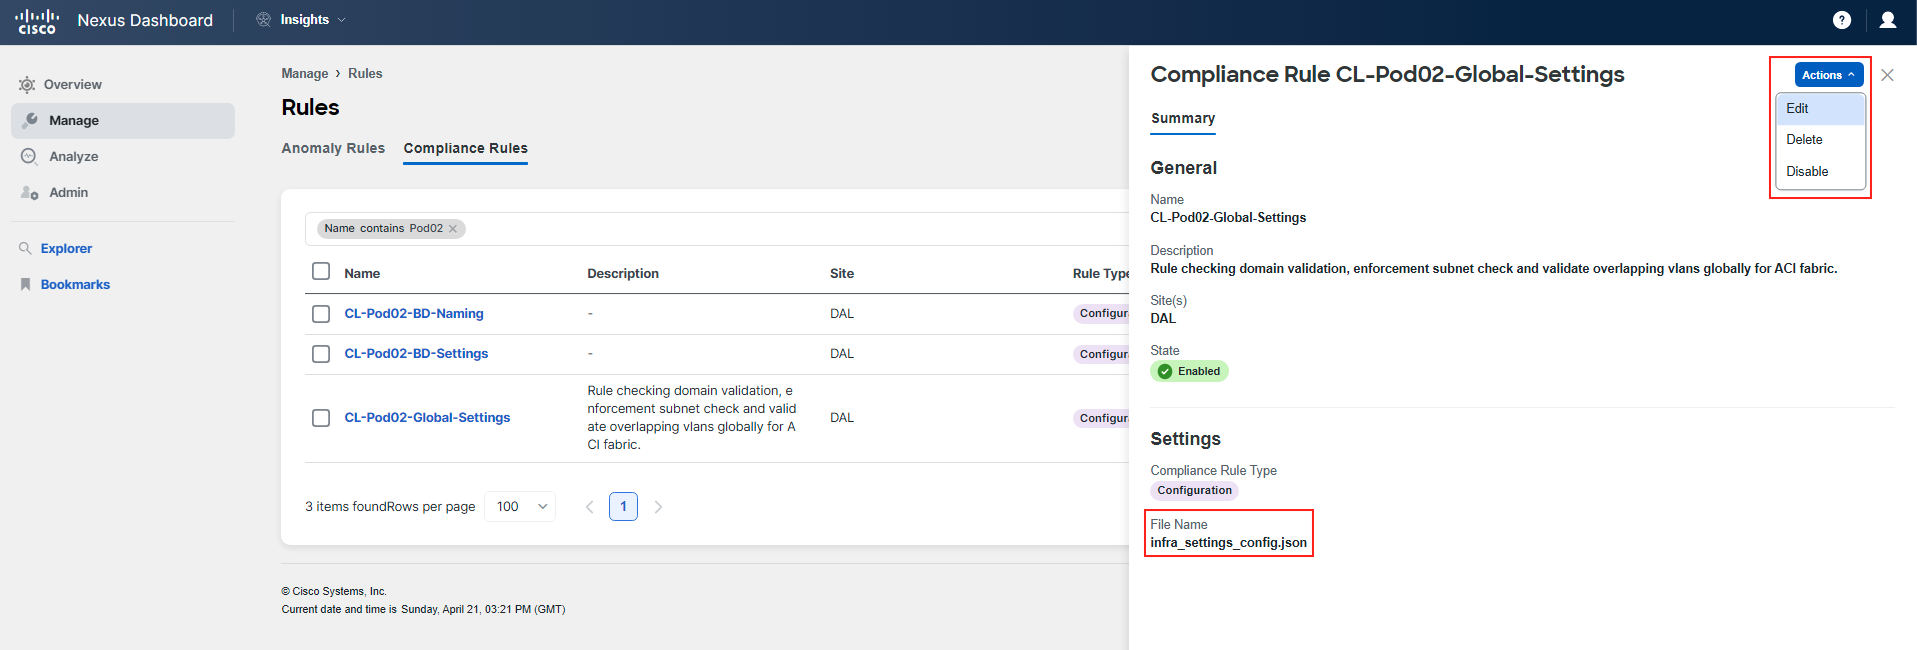
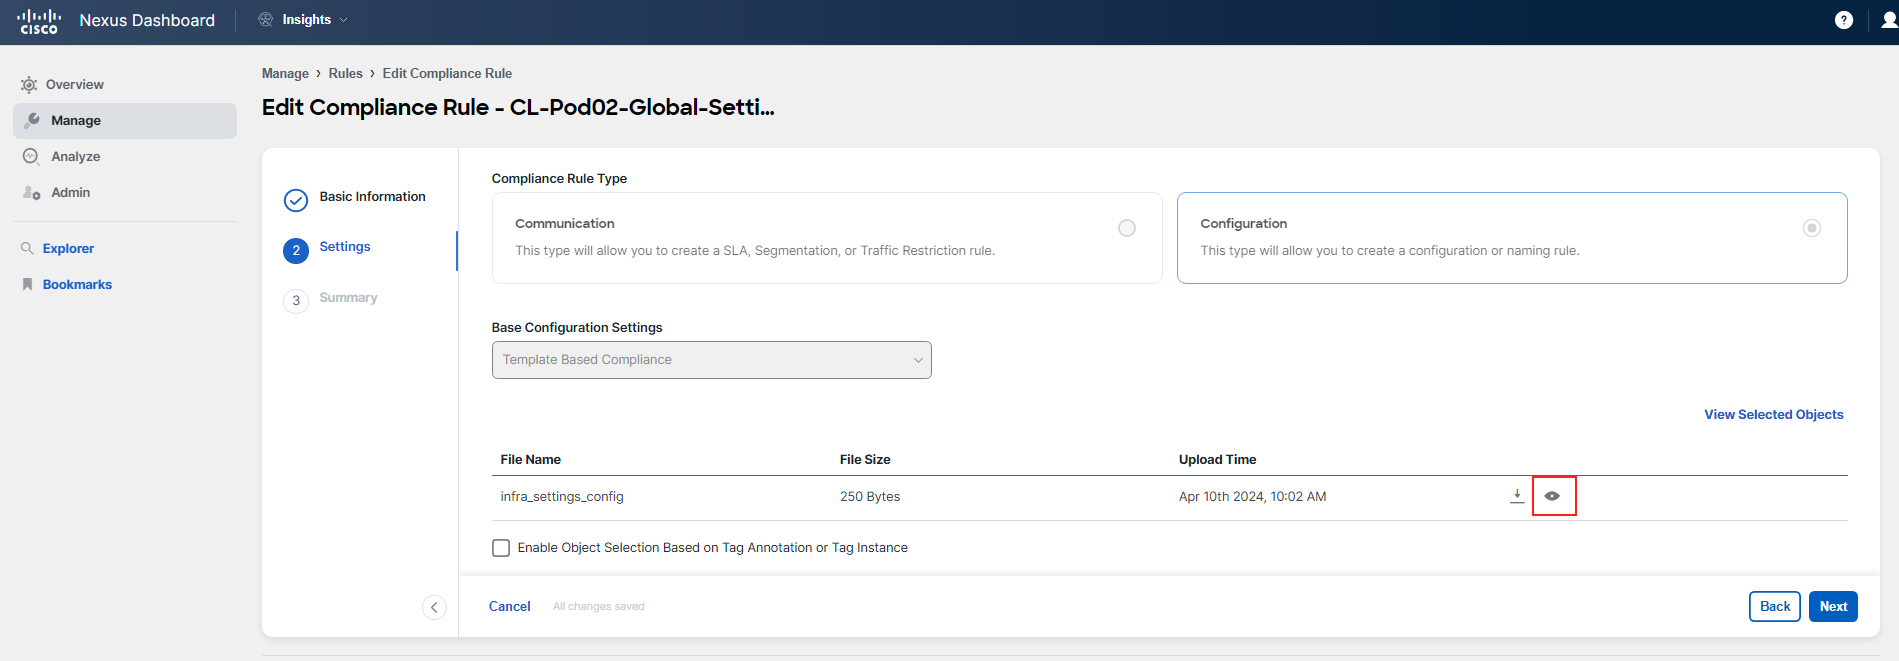
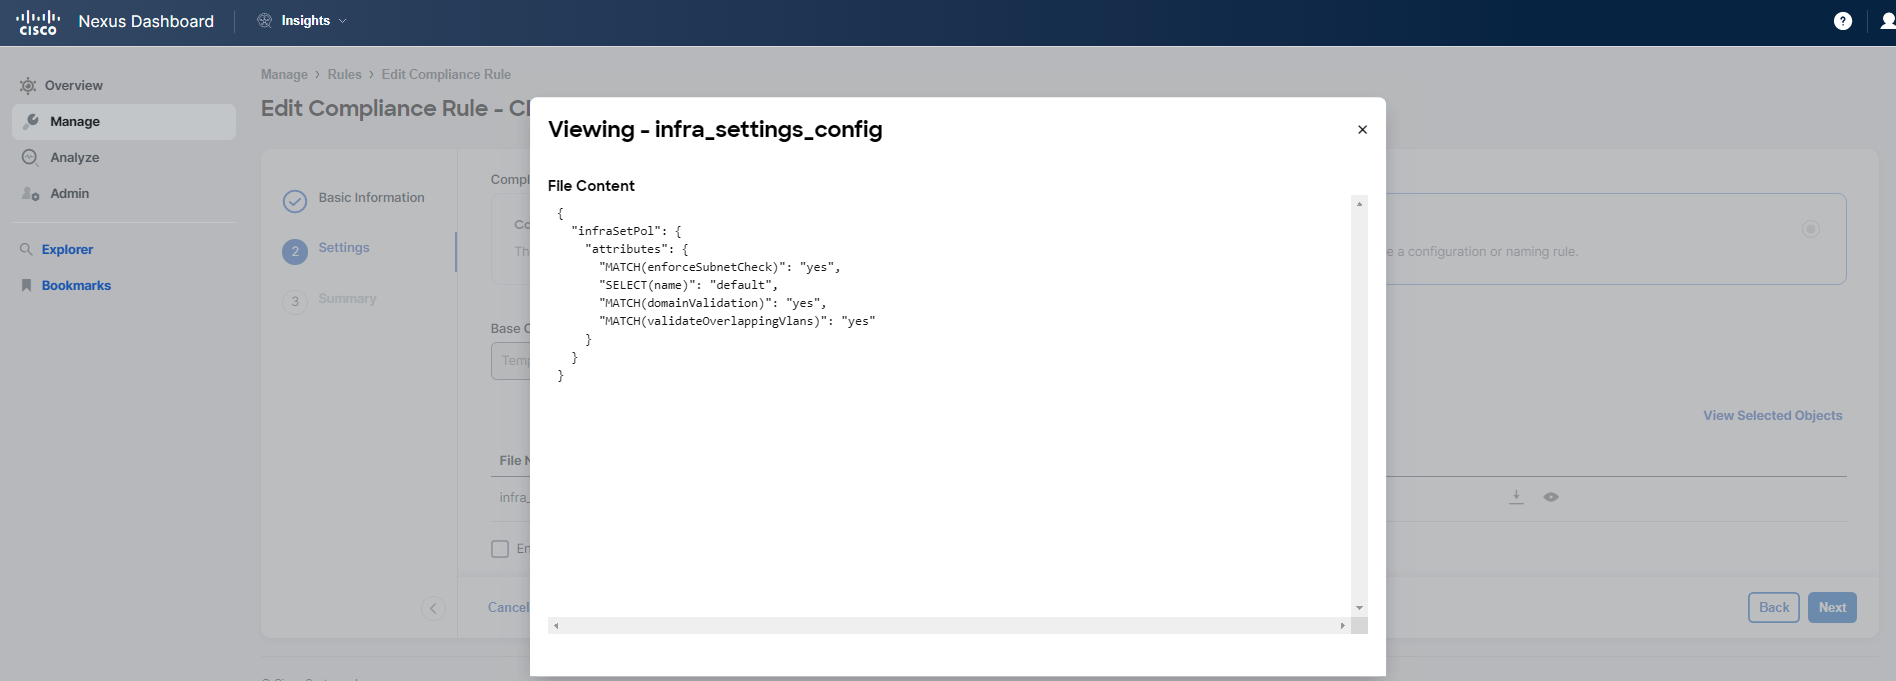
It is possible to define the rules using json templates, which give you possibility to reference many managed objects of Cisco ACI and their configured attributes.
You may refer to Nexus Dashboard Insights documentation to learn more how to define json template based rules.
Hint
Remember that you can also utilize ACI's Object Store to obtain detailed object-level information. This can be accessed via the APIC's UI by clicking on the gear icon and selecting "Object Store Browser," or by navigating directly to "APIC_IP/visore.html".
Step 13
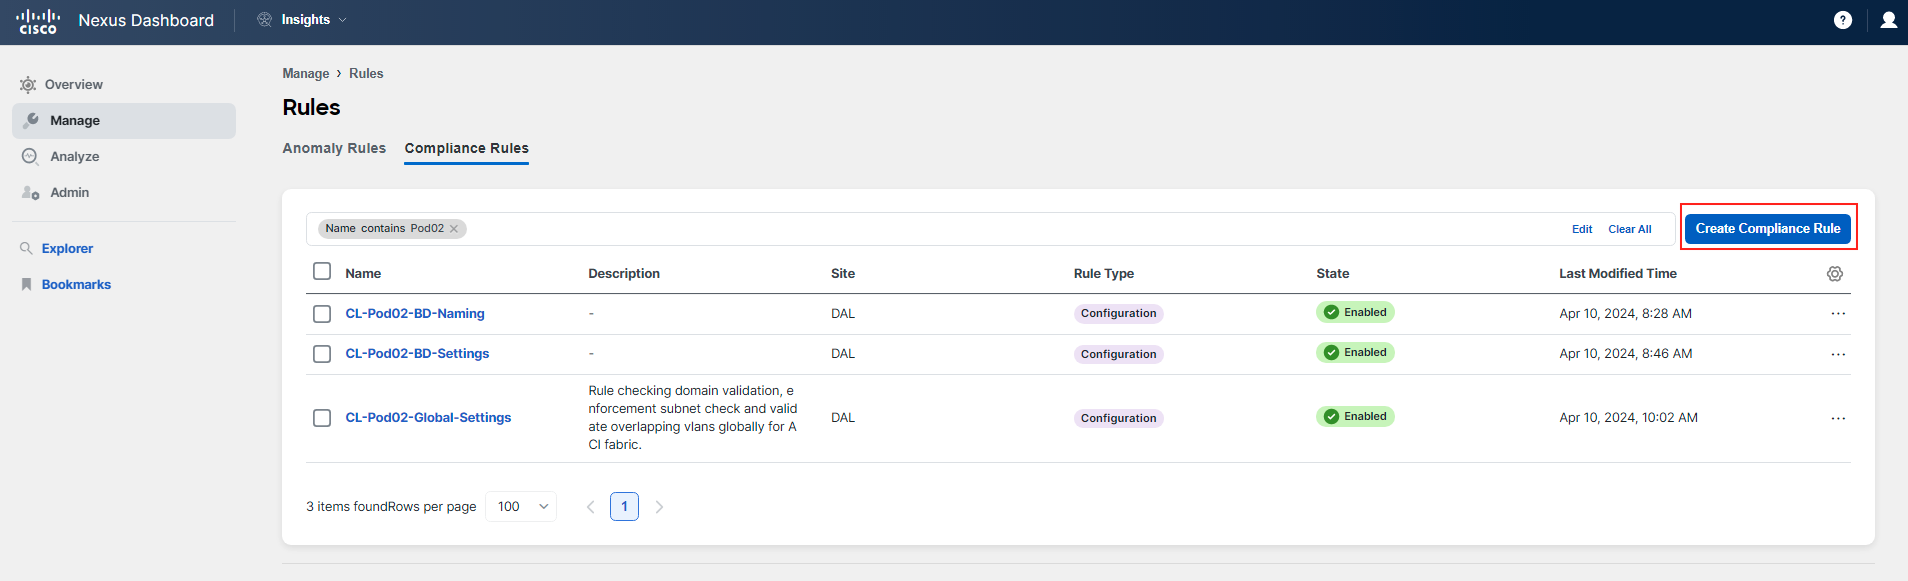
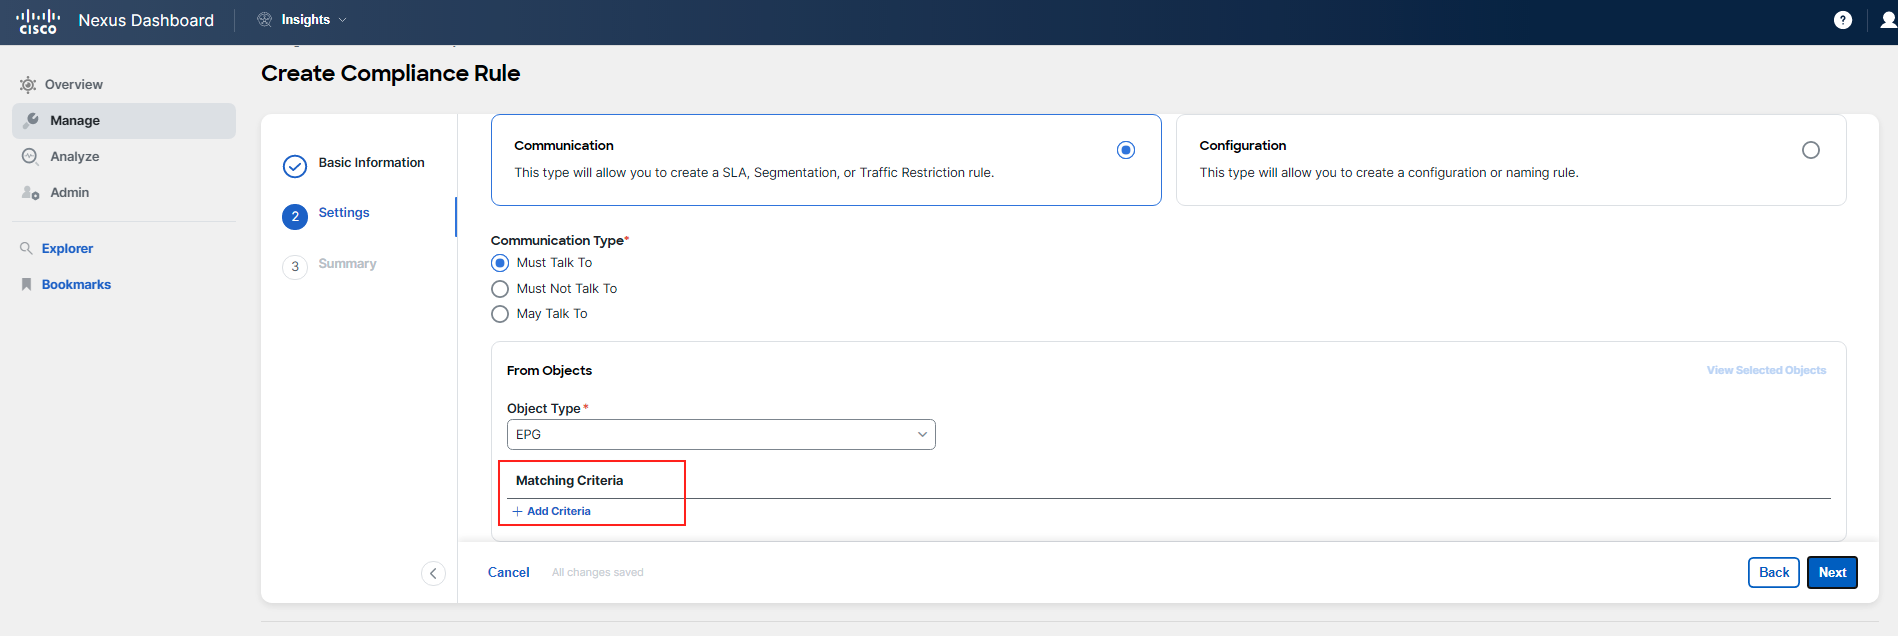
Now, you will create a new compliance rule. Return to Nexus Dashboard Insights, exit the rule edit view, and click on the Create Compliance Rule button located in the top right corner.
You will set up a rule that will be utilized in the Pre-Change and Post-Change Analysis use-case. This rule will verify whether two Endpoint Groups (EPGs) are allowed to communicate with each other. In the Pre-Change and Post-Change Analysis use-case, you will be managing a change that includes adding a new EPG and its associated policies. Before you deploy the actual configuration, you will employ Pre-Change Analysis to simulate this change. The rule you're about to configure will help you determine if the EPGs, which should be able to communicate, will indeed be able to do so after the change.
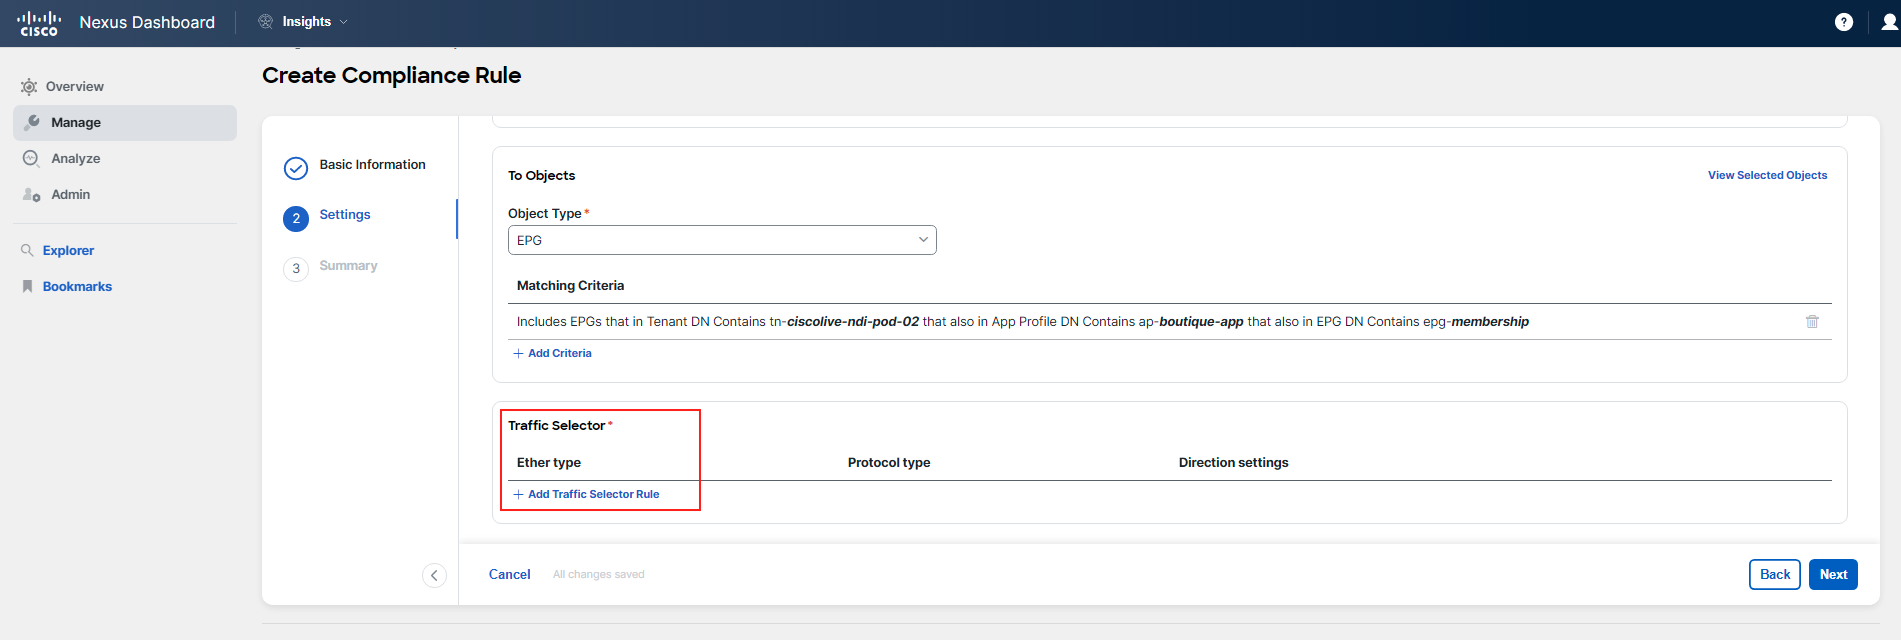
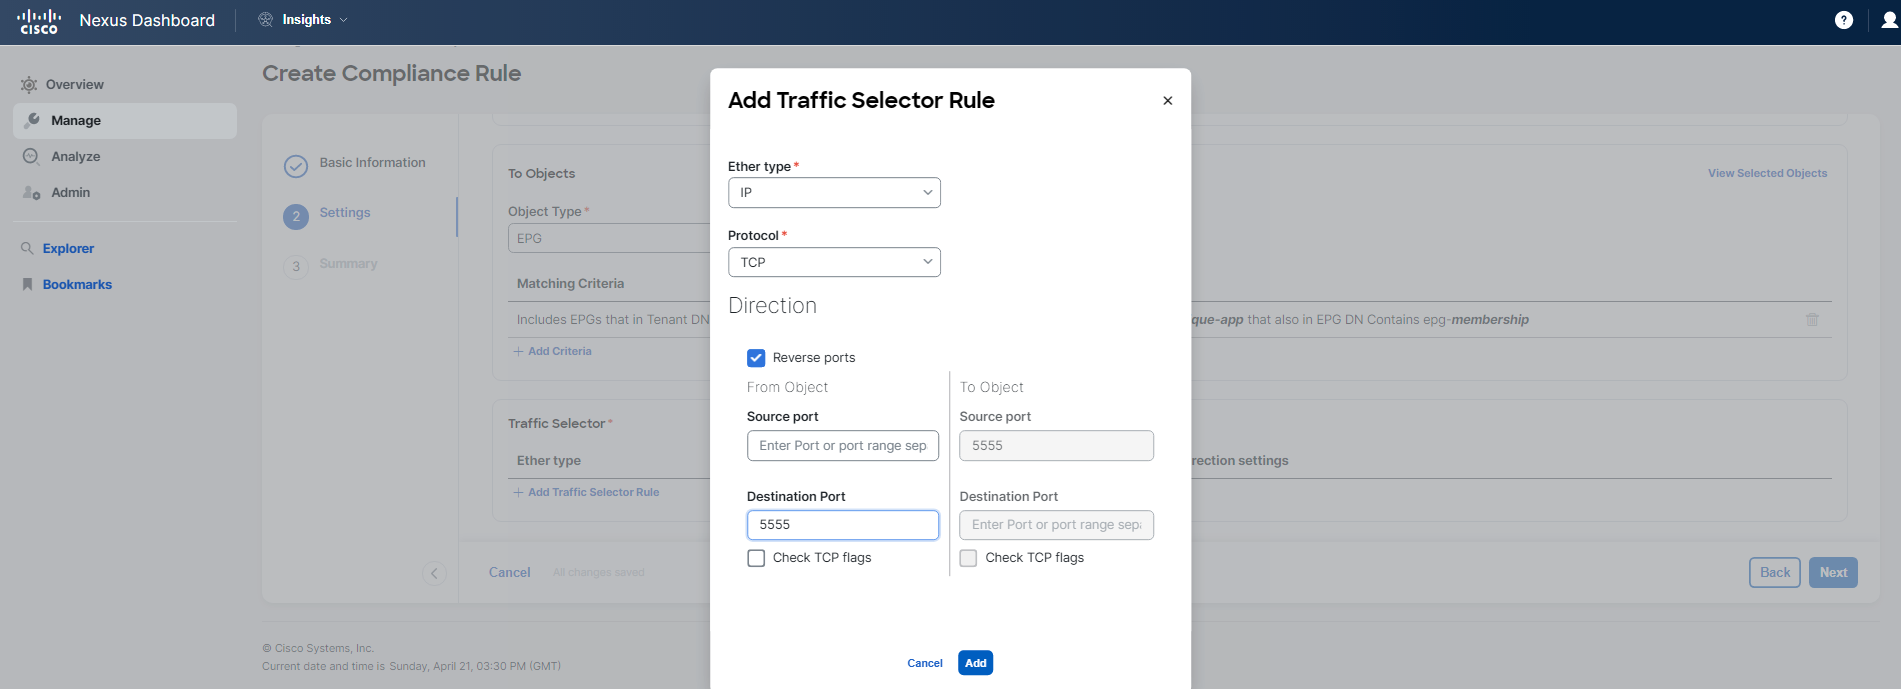
Steps to configure the rule: 1. Select the communication type for the rule. 2. Define the "from" and "to" objects, specifically targeting the EPGs in question. 3. Choose the traffic selector for a specific service, setting the protocol to TCP and the destination port to 5555.
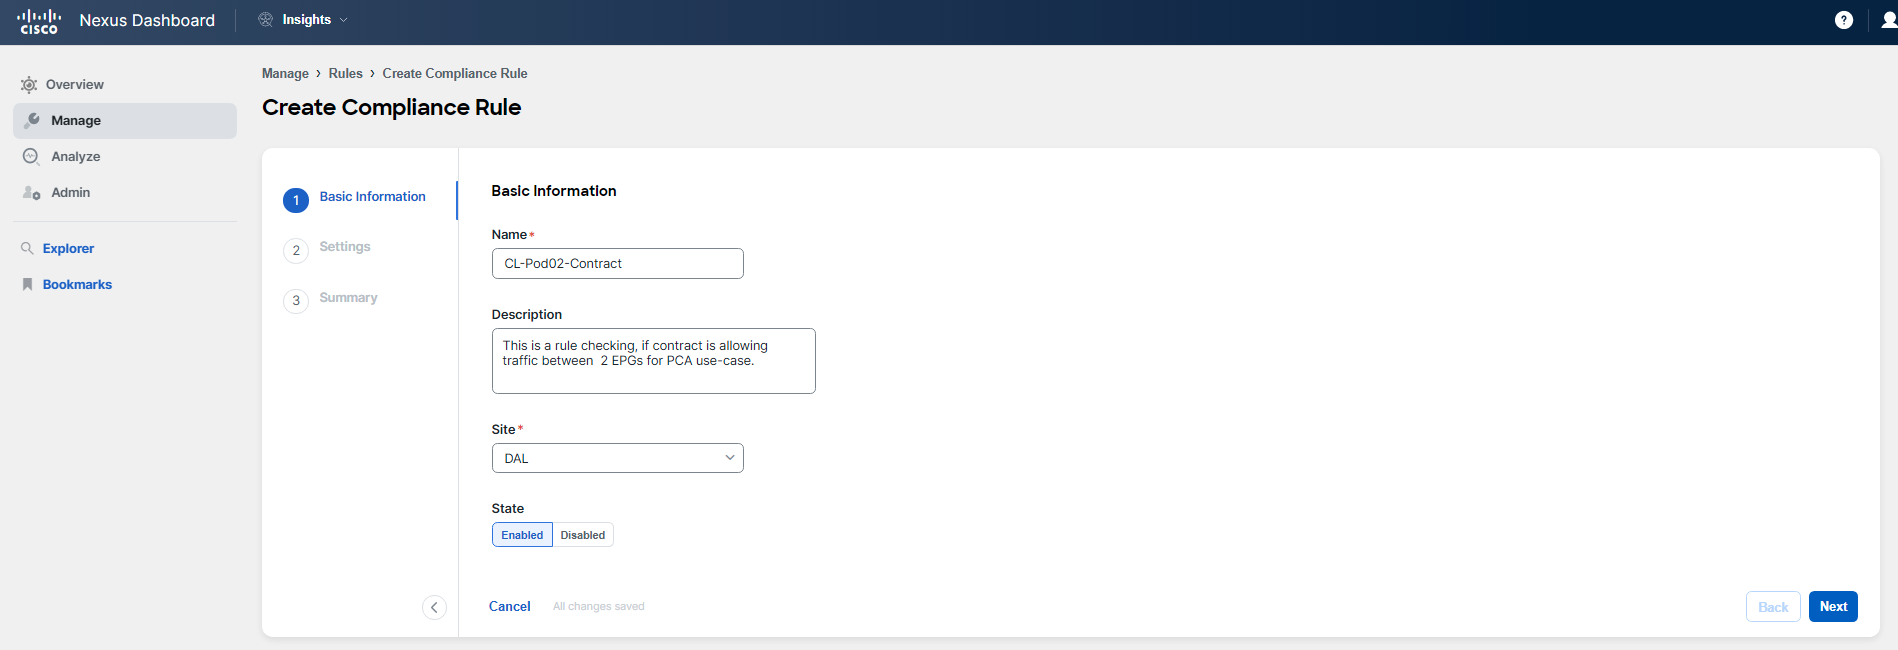
To begin creating the rule:
- Enter the name of the rule, for example, CL-PodID-Contract, ensuring you replace "PodID" with your actual two-digit Pod ID (such as Pod02 or Pod20).
- Provide a brief description of the rule's purpose.
- Select the DAL site from the available options.
- Click "Next" to proceed to the next step.
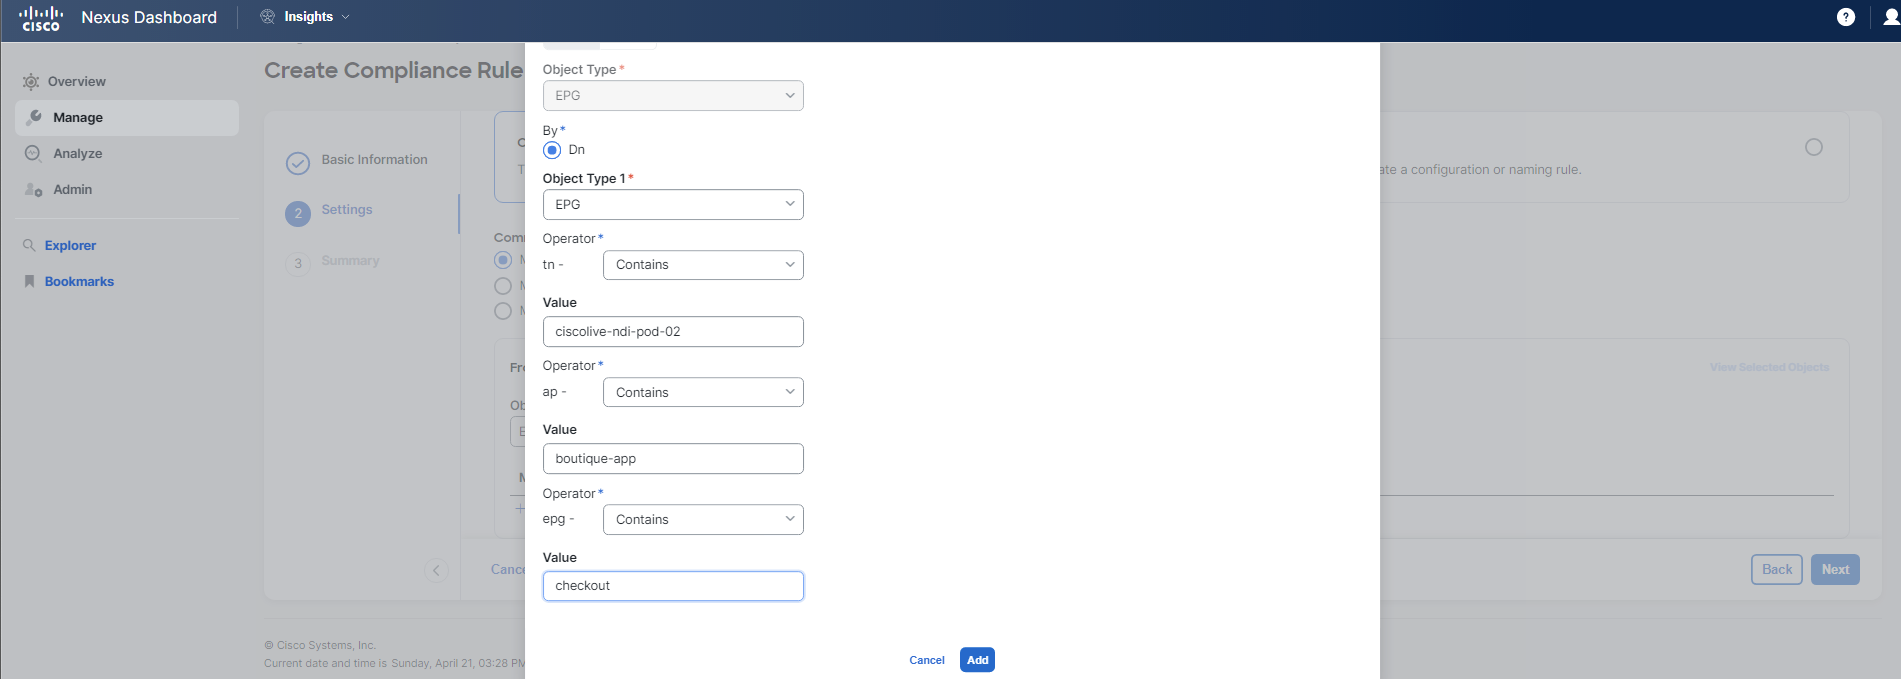
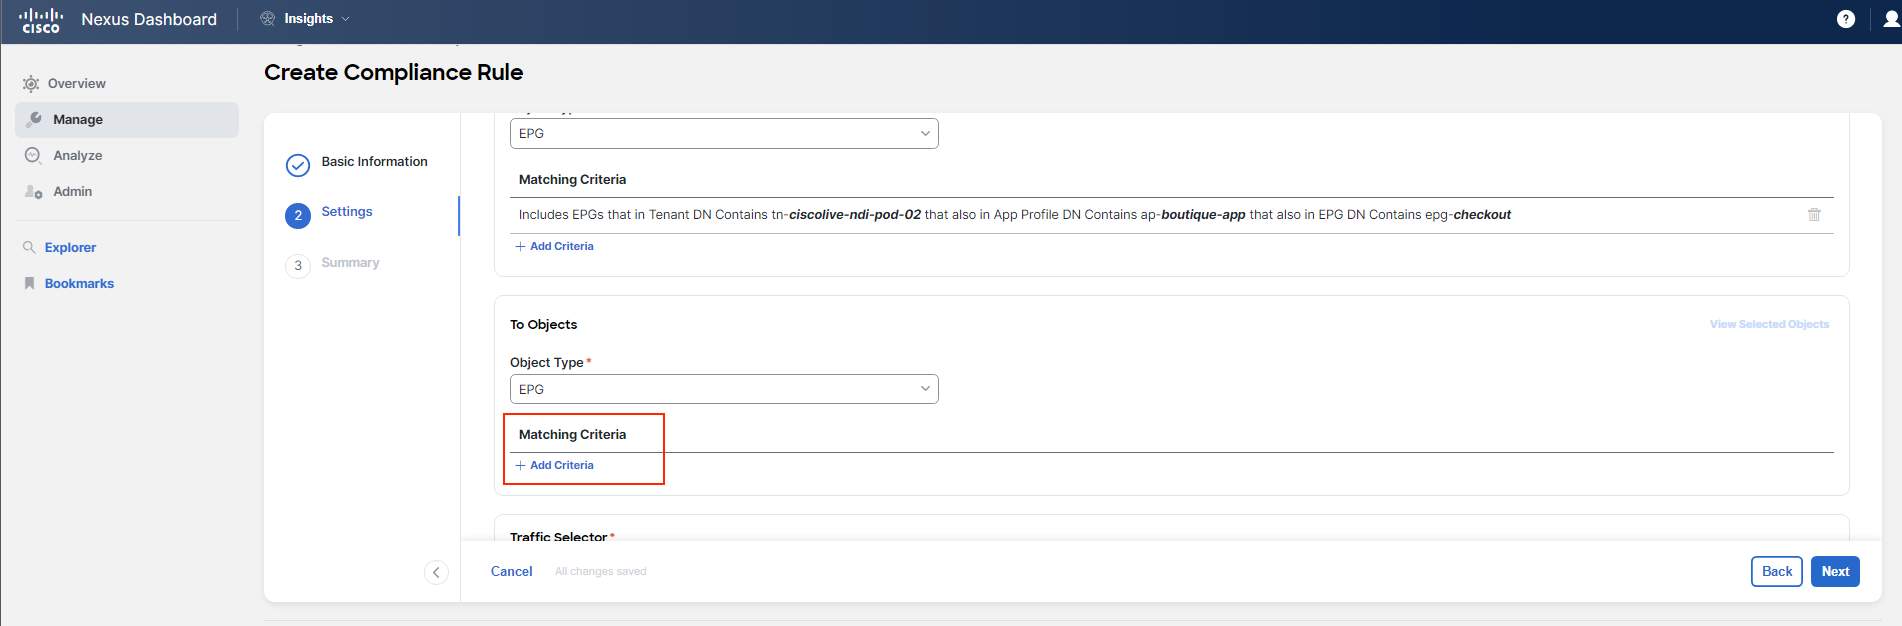
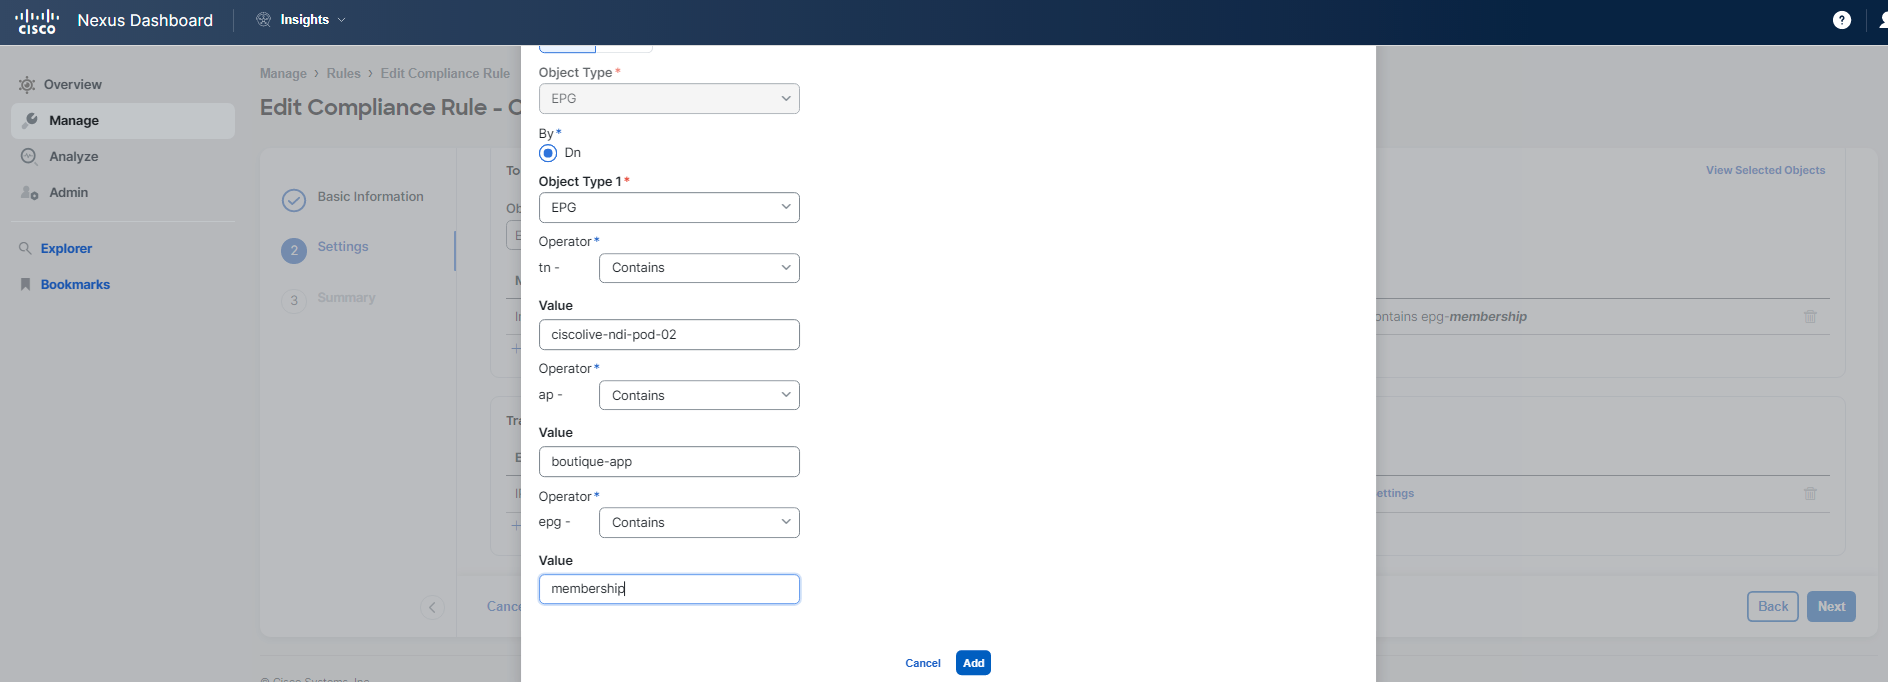
For Step 2 Settings of the rule configuration process, you should follow the guidelines and examples provided in the screenshots below. Pay close attention to the details to avoid any typos or mistakes.
Note
Remember to use a name that includes your specific POD ID, and ensure that all Pod IDs are in a two-digit format.
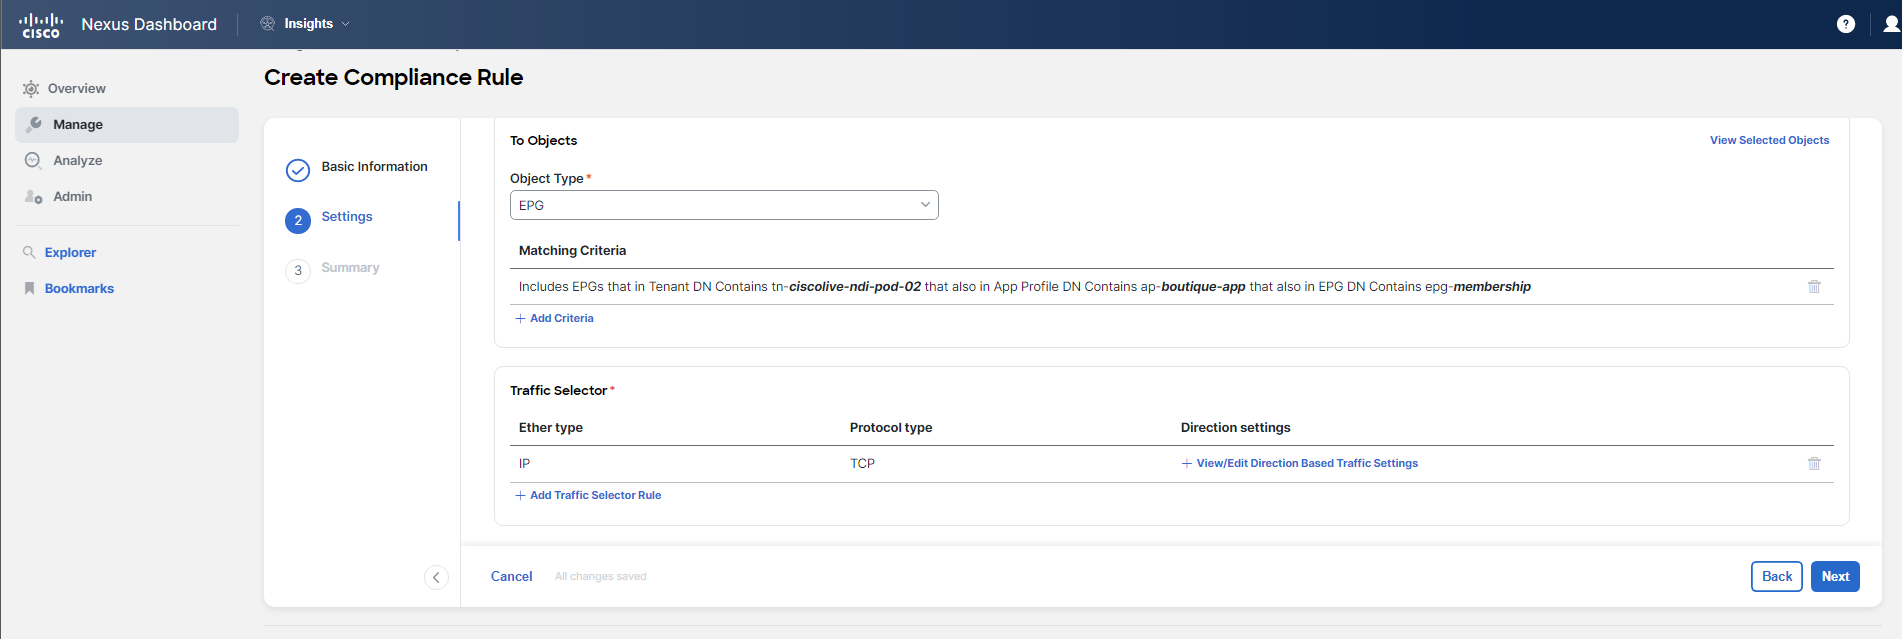
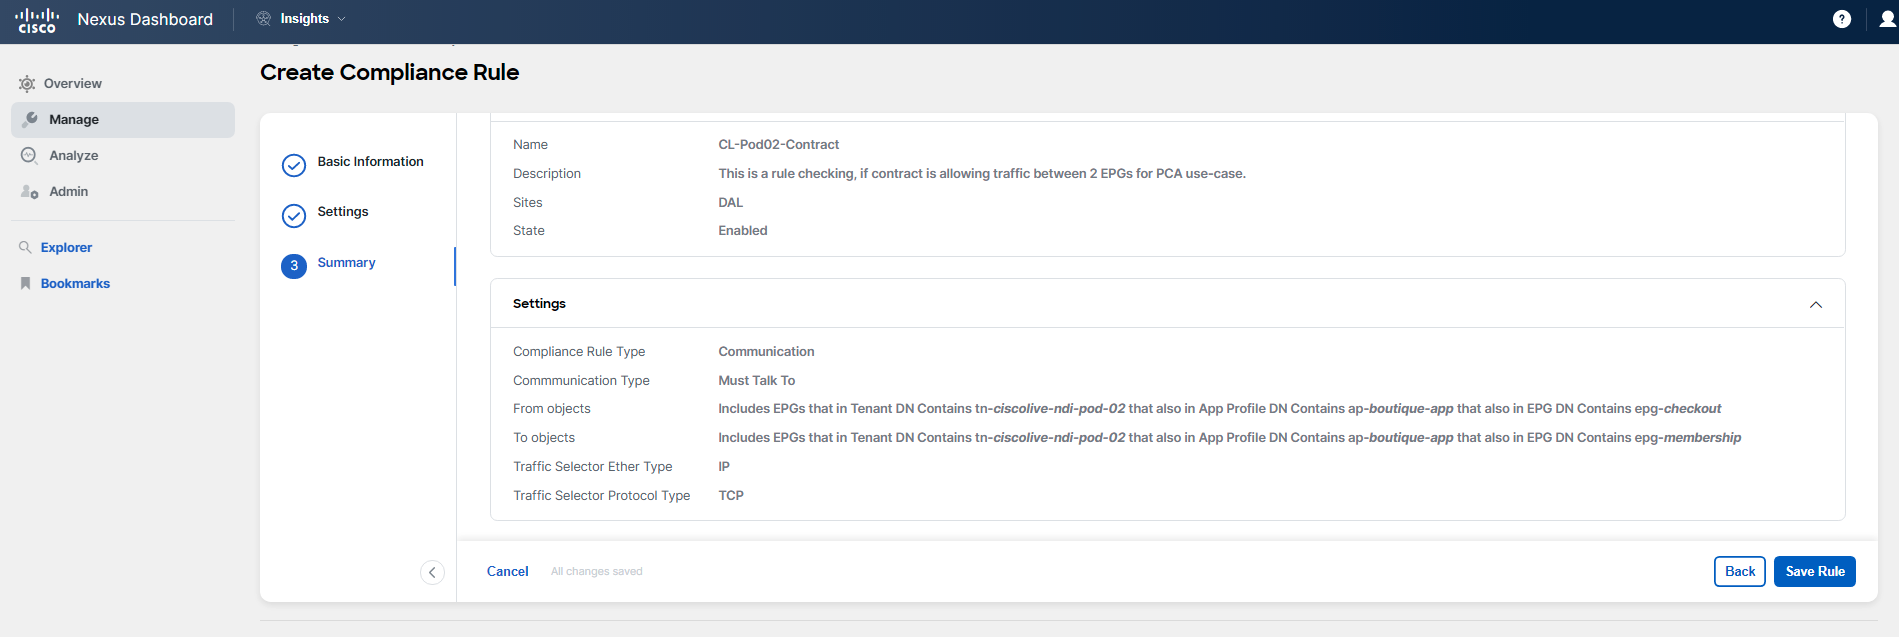
You have completed the setup of your new rule, which will be referenced in the upcoming use-case: Pre-Change and Post-Change Analysis. Keep in mind that this rule references an object that does not exist yet.
Step 14
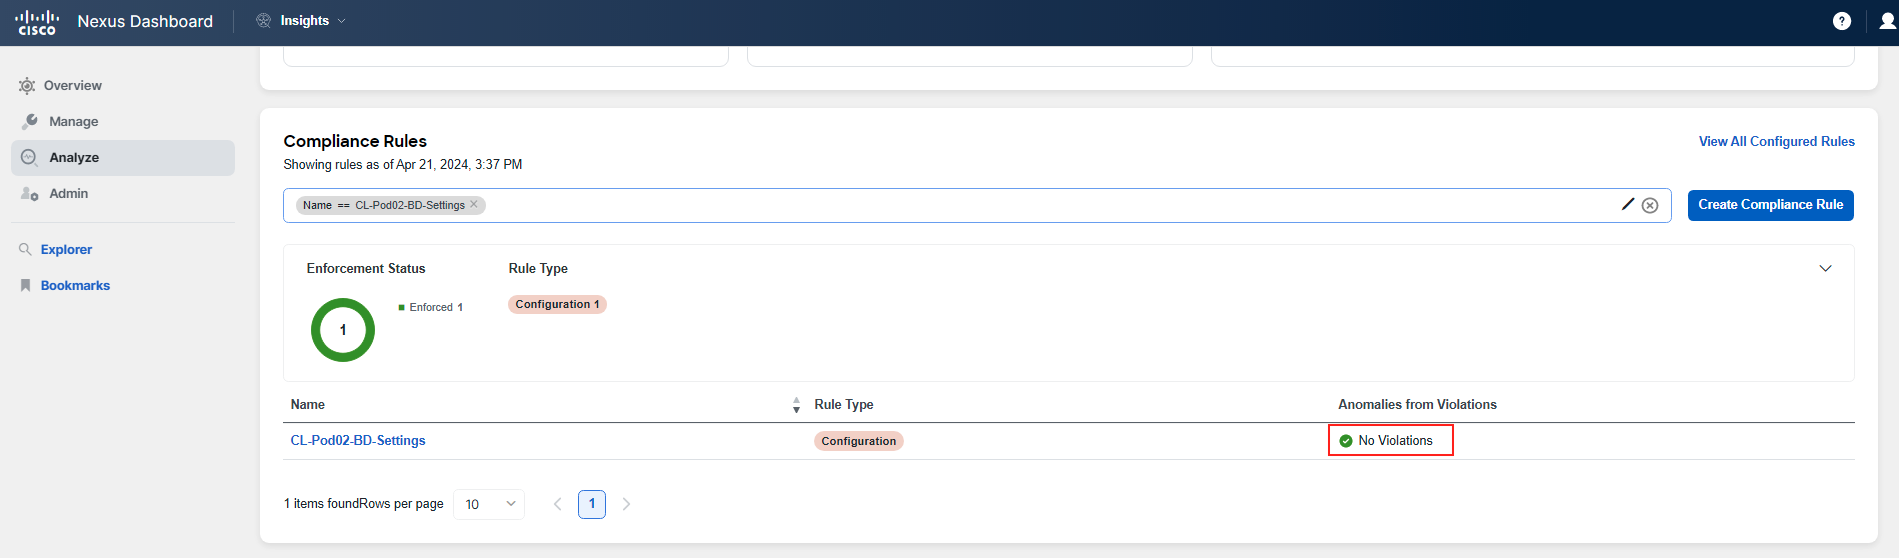
Before concluding this use-case, let's check the status of the rule that previously indicated incorrect Bridge Domain (BD) settings, which you have now corrected in the APIC. To do this:
- Navigate to Analysis Hub > Compliance.
- Scroll down to the Compliance Rules section.
- Look for the rule CL-PodID-BD-Settings. It should now be listed as Enforced or with No Violations.
Note
The updated status is dependent on the assurance analysis completing the collection and generating a new snapshot. If the rule does not yet show as enforced, it may not have been updated in the system yet. In this case, you can either review the screenshot below to see what the enforced state would look like or check back in a few minutes after next in line assurance analysis is done.
Through this use-case, you've discovered how Nexus Dashboard Insights can be an invaluable tool in ensuring that your network meets business requirements and adheres to your defined golden configuration template consistently.
You are now ready to move on to the next use-case.