Use-Case 7 - Pre-Change & Post-Change Check
Pre-Change and Post-Change Analysis
In this use case, you will discover how Nexus Dashboard Insights allows administrators to proactively ensure that maintenance window changes are correct and that no errors will be introduced. This includes not only configuration errors but also routing issues, compliance violations, and more. This is known as Pre-Change Validation.
Nexus Dashboard Insights simulates the proposed changes on top of the current infrastructure state model and calculates whether any new anomalies will be raised due to these changes. If that is the case, the administrator can go back and review the change before applying it to the infrastructure.
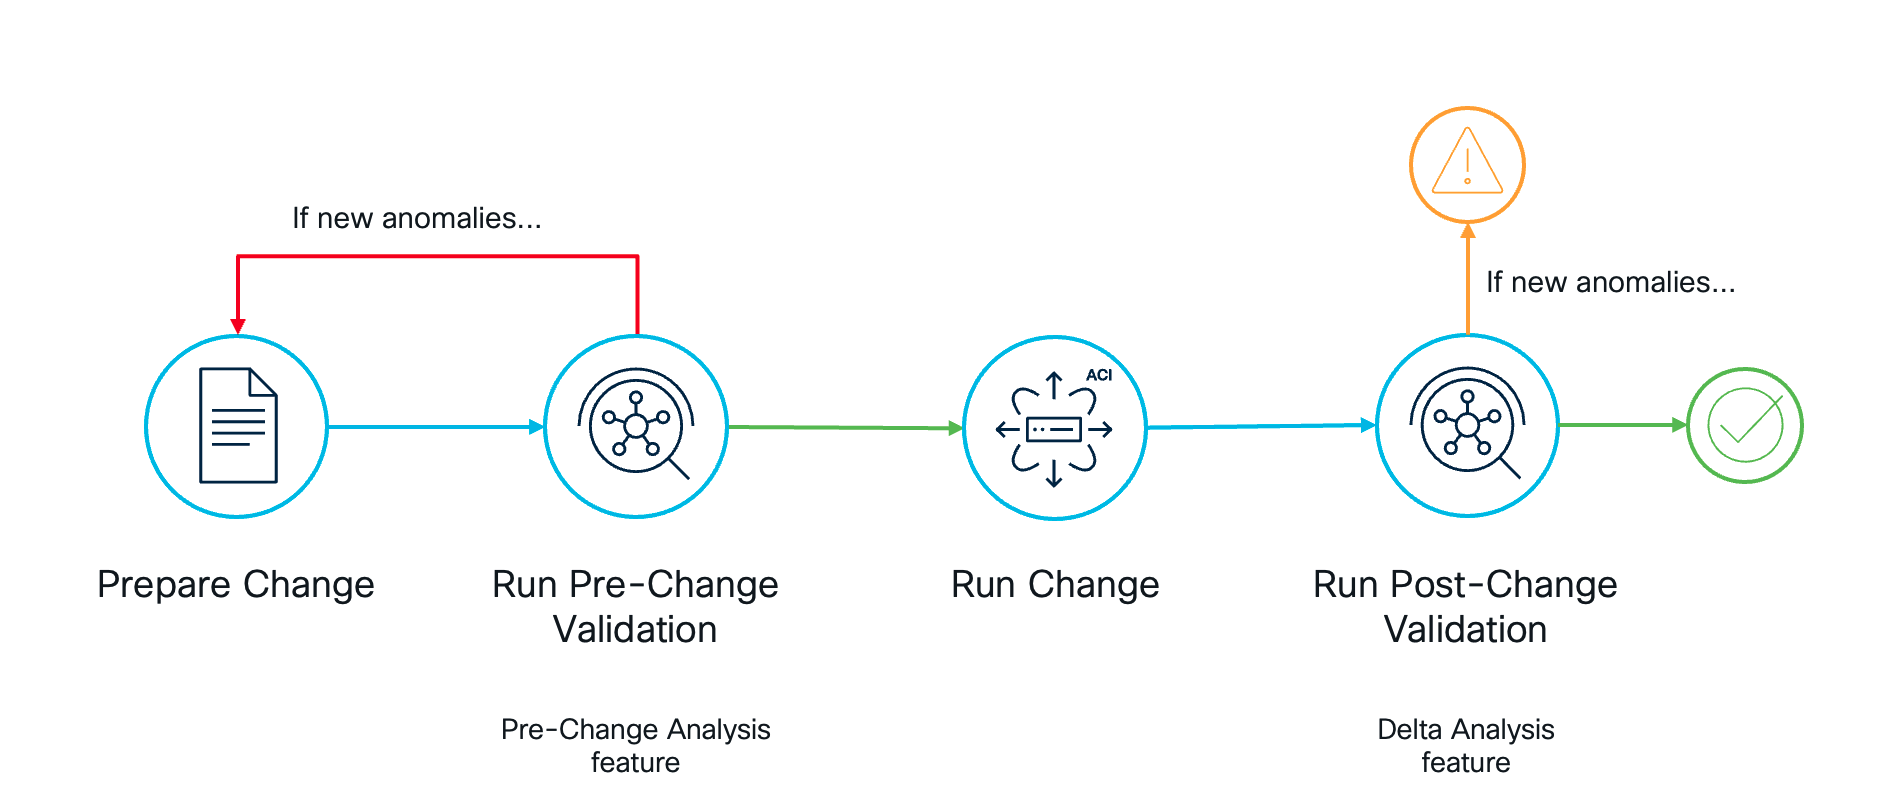
Additionally, Nexus Dashboard Insights can help verify if changes introduced any errors after being applied, as part of the Post-Change Validation process that organizations have in place. In this case, Nexus Dashboard Insights compares the anomalies present in the system before and after the change and determines if there are new anomalies that have been raised after the changes. This helps administrators to quickly determine if the change has been successful or not.
In this use case, you will use the workflow above to enhance the change management process in your organization.
Scenario
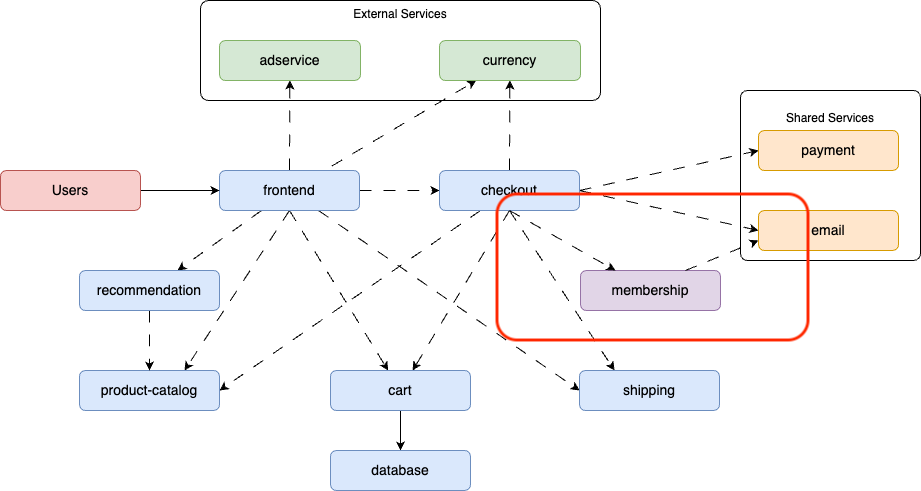
The online marketplace business unit is going to launch a new membership program that will provide benefits to regular clients based on how much they purchase in our online boutique. For that, the application team has requested a new network segment for this new membership service. Here are some details about this service:
- The Membership service exposes port 5555.
- The Membership service is consumed by the checkout service.
- The Membership service consumes the shared email service.
One of the administrators from your team has prepared the configuration for Cisco ACI in the company's lab environment and has provided you with the XML/JSON file to be applied during the upcoming change window.
Before the upcoming change window, you decide that it's better to leverage Nexus Dashboard Insights to verify if the change is correct. After the change is applied, you will also use Nexus Dashboard Insights to verify if everything is alright.
Extra task
Optionally, you can verify the change yourself without using Nexus Dashboard Insights to experience how much effort Nexus Dashboard Insights can save you, and then compare the results.
Solution
Info
Due to time constraints and limitations with the number of concurrent Pre-Change Analysis jobs that can be running in Nexus Dashboard Insights, we have executed the Pre-Change Analysis in advance on your behalf. In this section, you will learn how to navigate through the results provided by the analysis. If you have time at the end of the lab, go to the "How-To" section to learn how the Pre-Change Analysis is configured.
Step 1
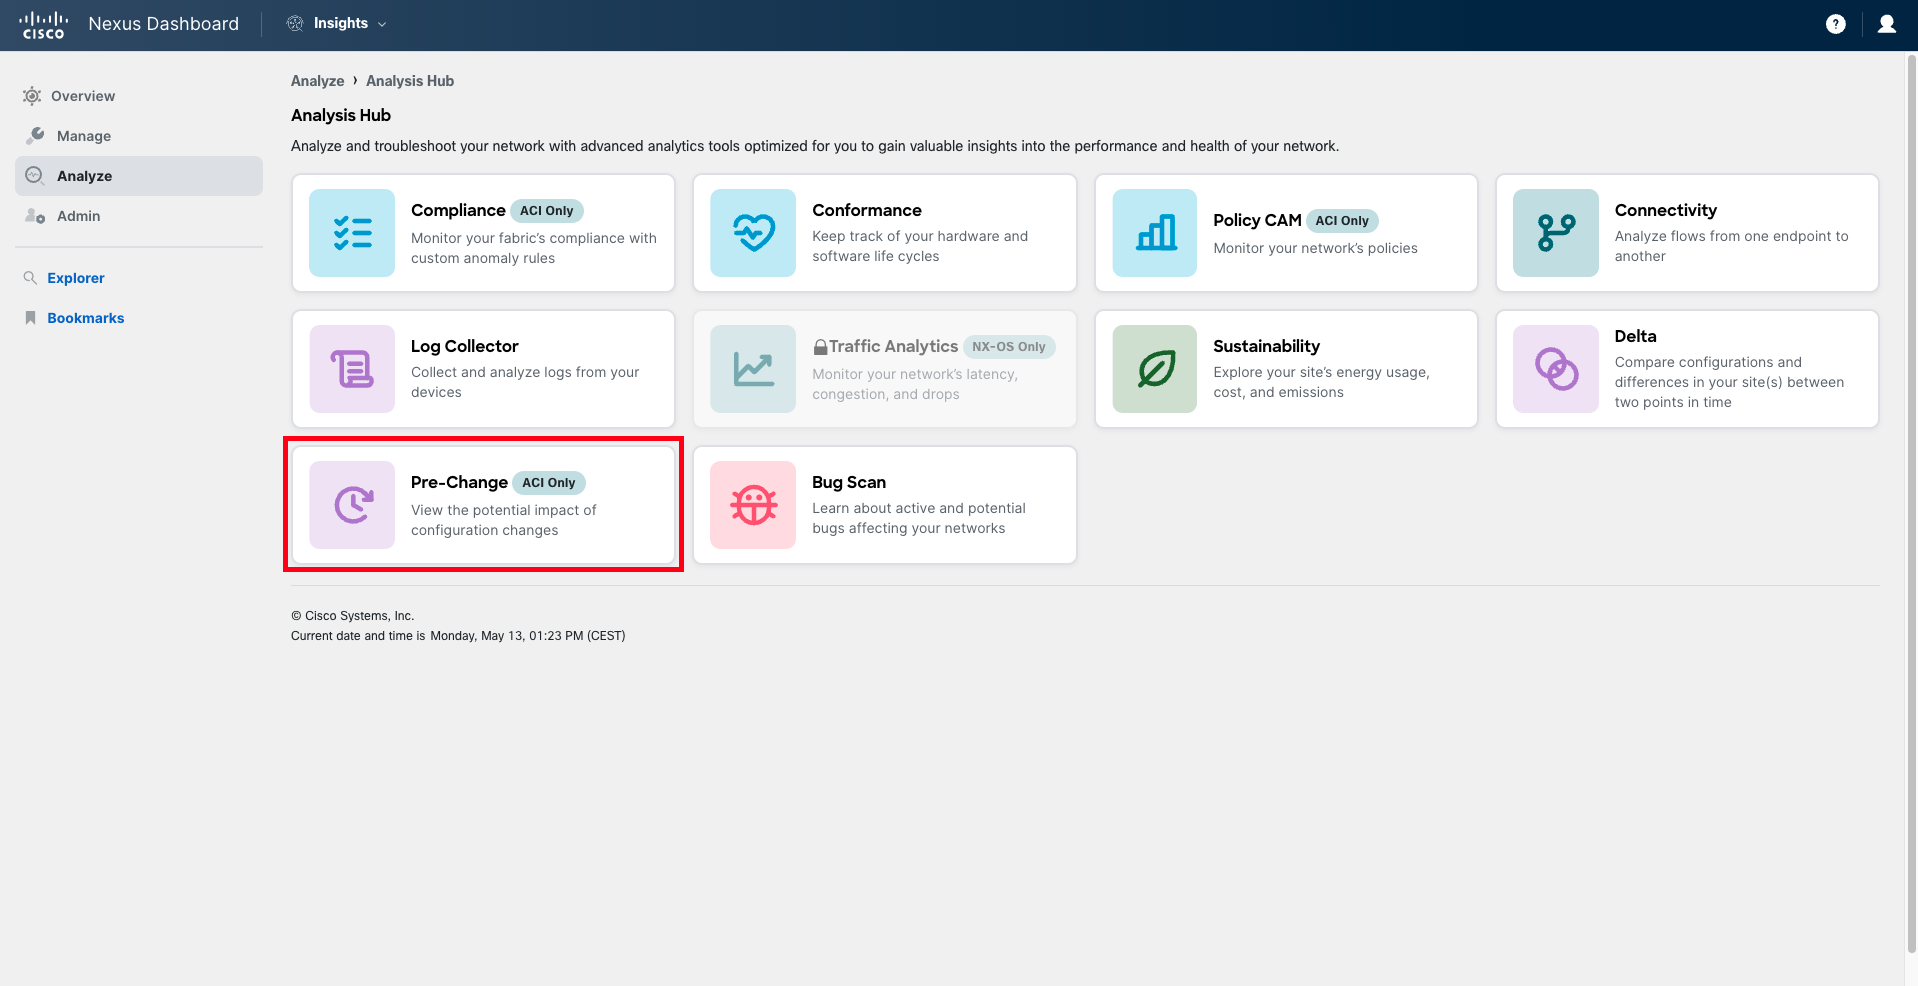
Navigate to Analyze > Analysis Hub > Pre-Change.
Step 2
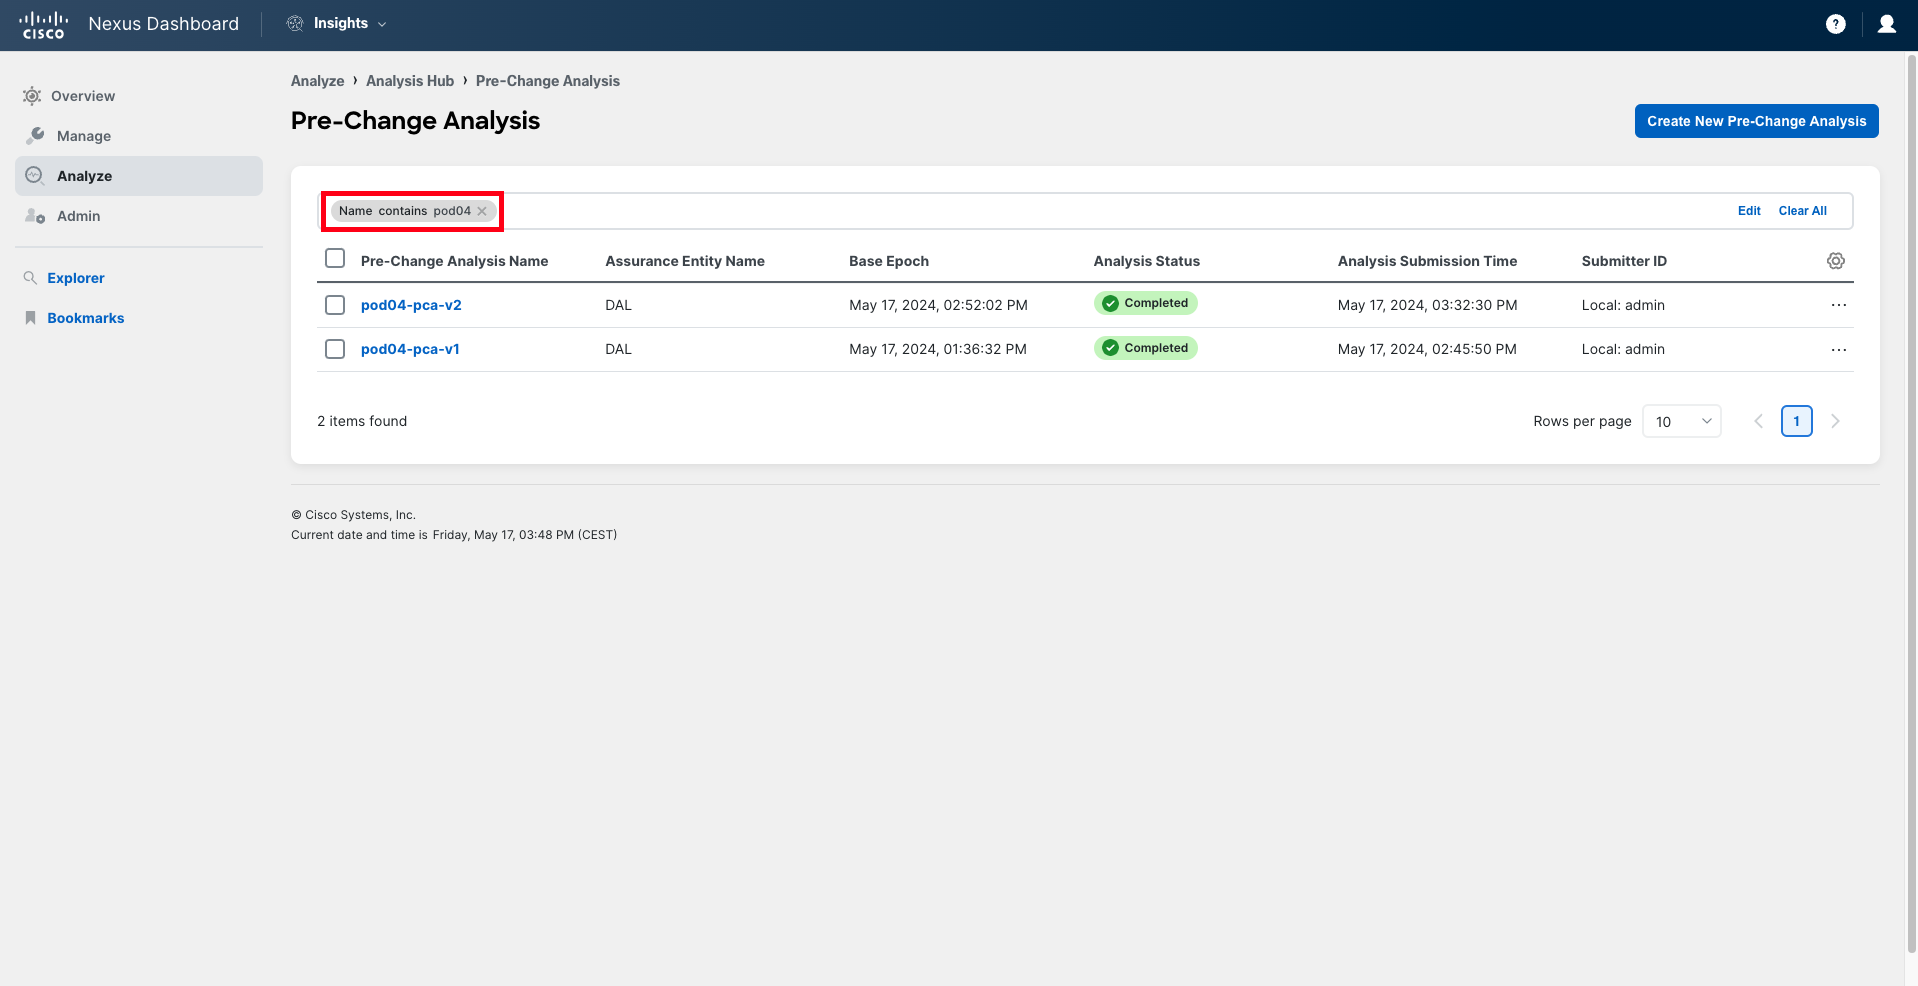
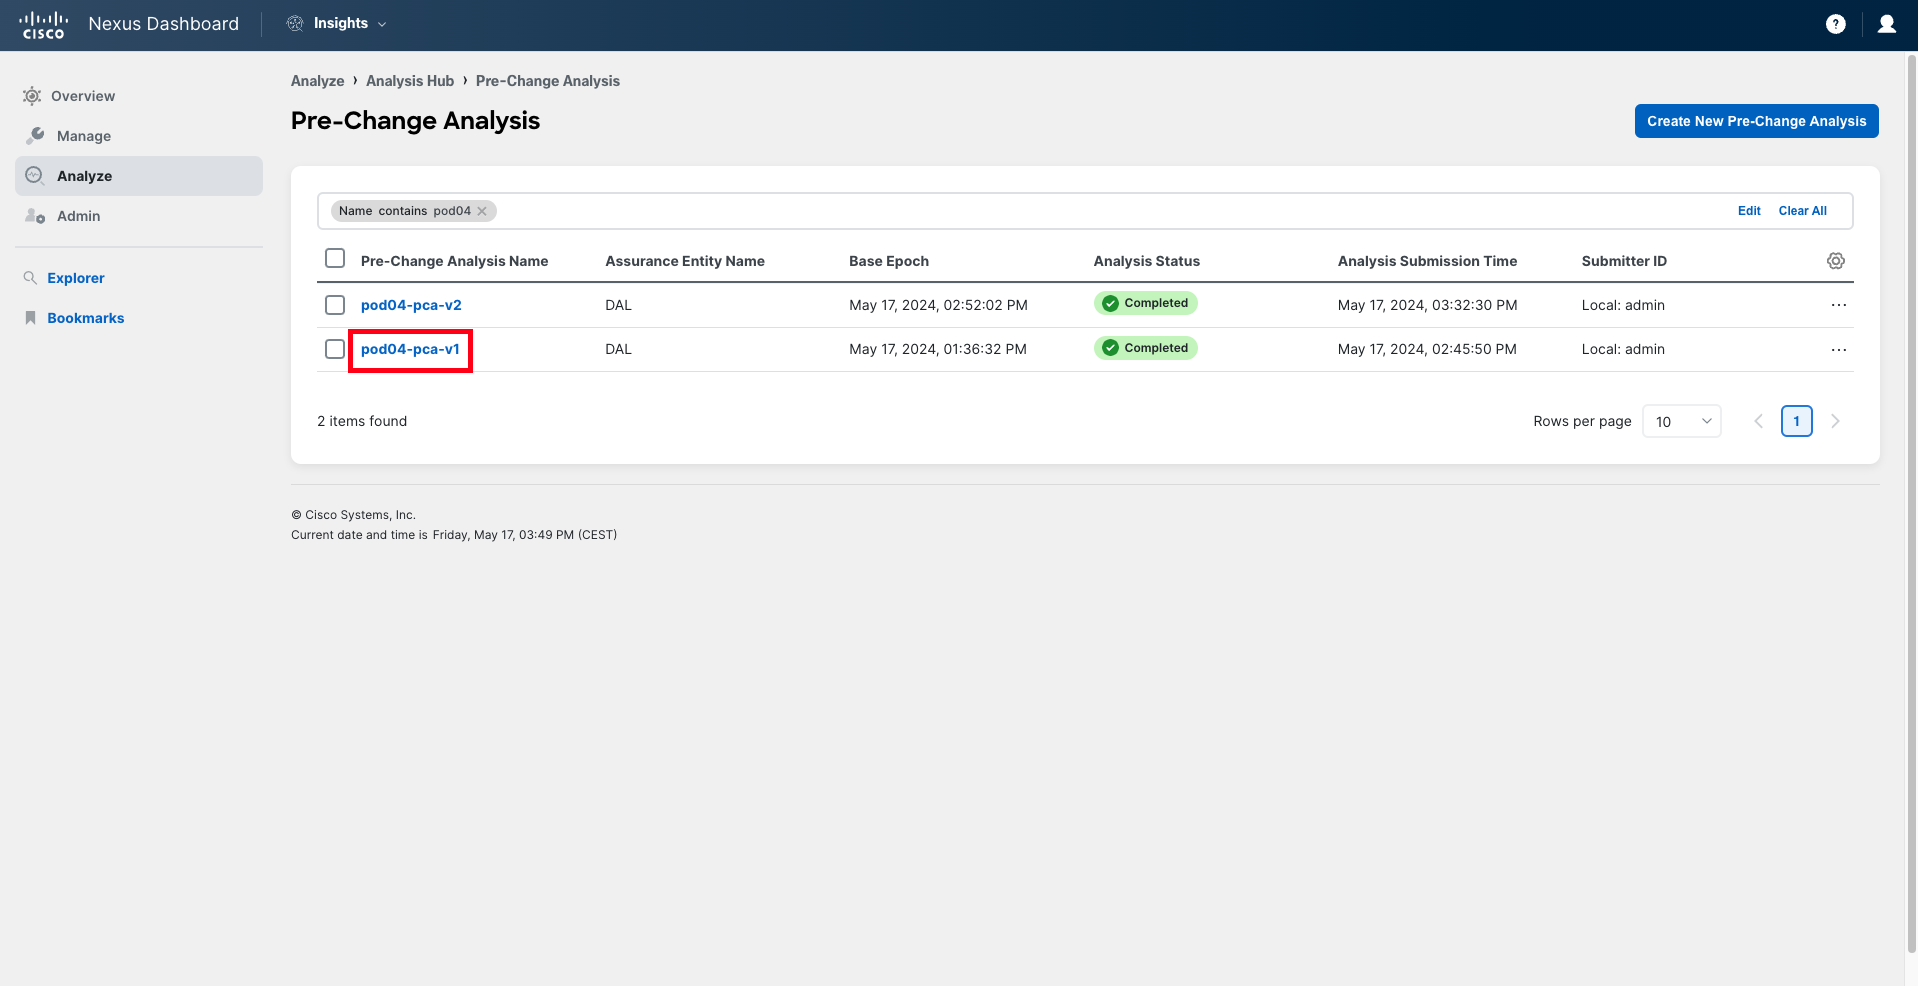
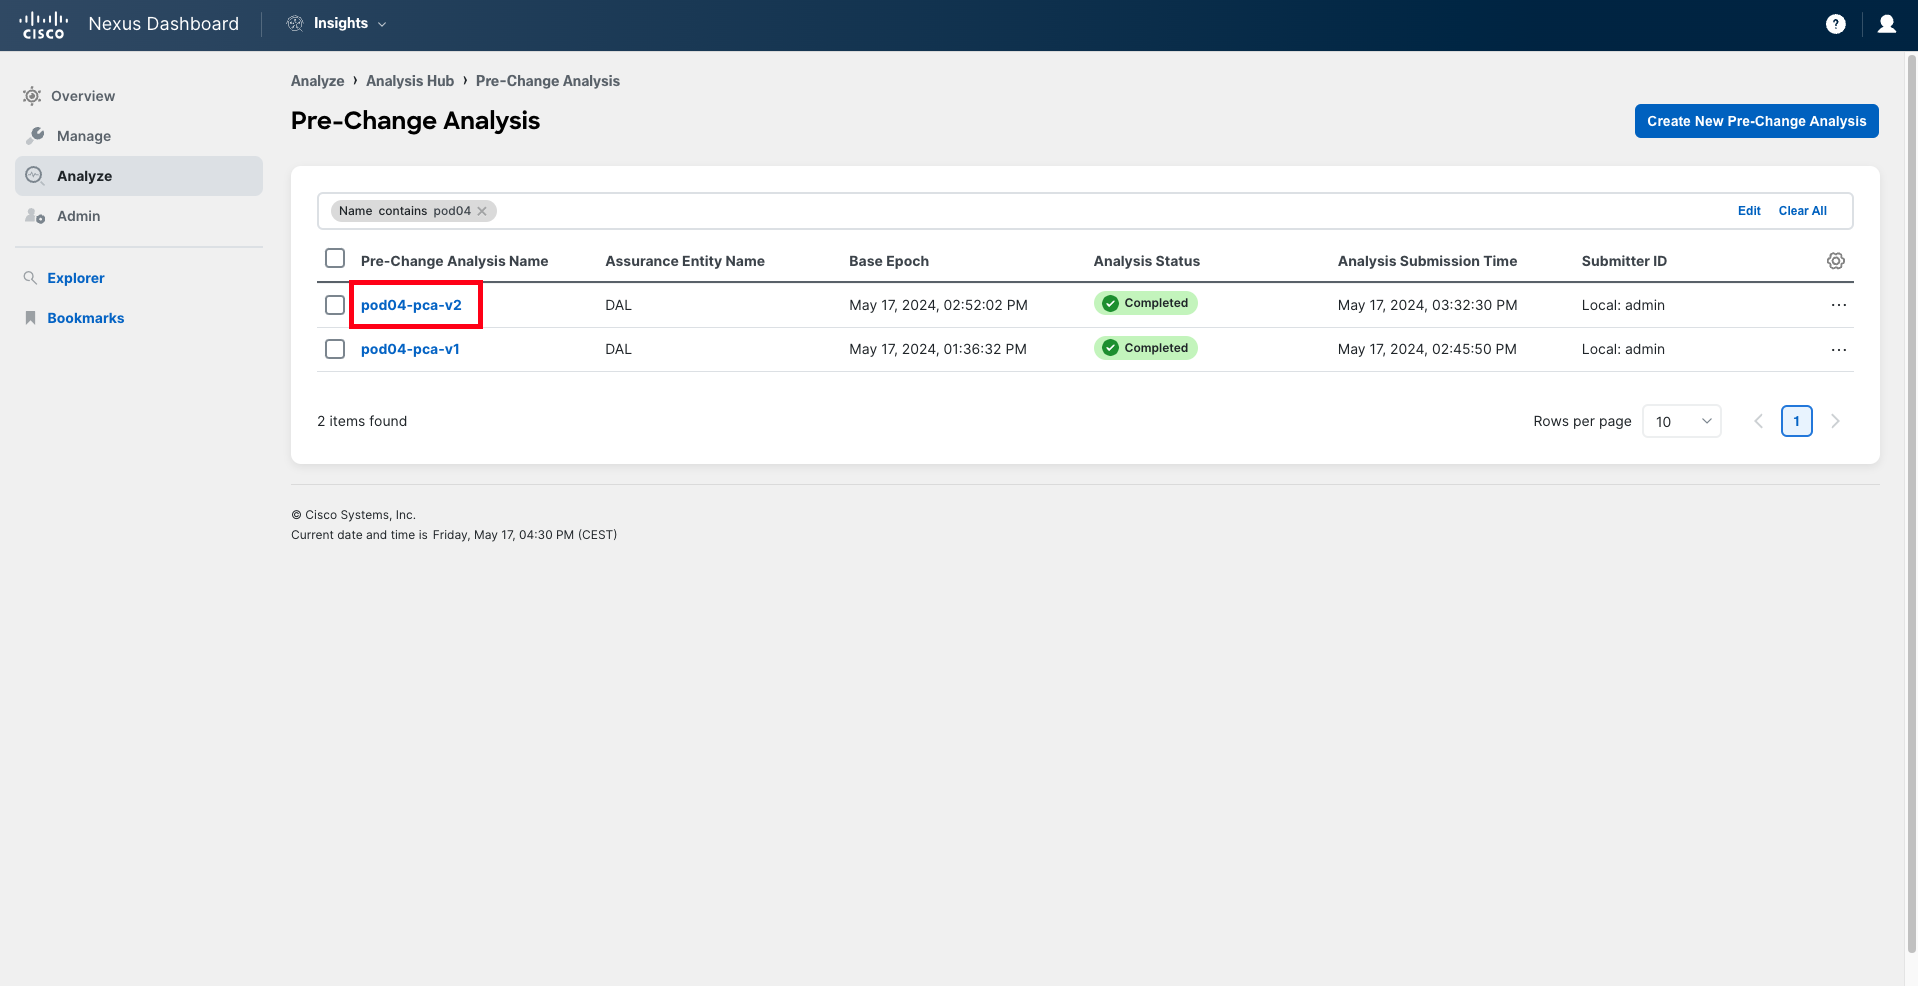
The list of Pre-Change Analysis jobs that have been recently run in the system is presented to you. You can quickly filter this view to find the Pre-Change Analysis for your pod. Filter using the filter bar, typing "Name contains podXX", where XX represents your pod ID in two-digit format (for example, pod04).
Step 3
After applying the filter, you will find two jobs in the list. Start by reviewing the job that ends with "v1". This is the analysis that you have done initially, after you received the configuration from your peer.
Click on the analysis name to open it.
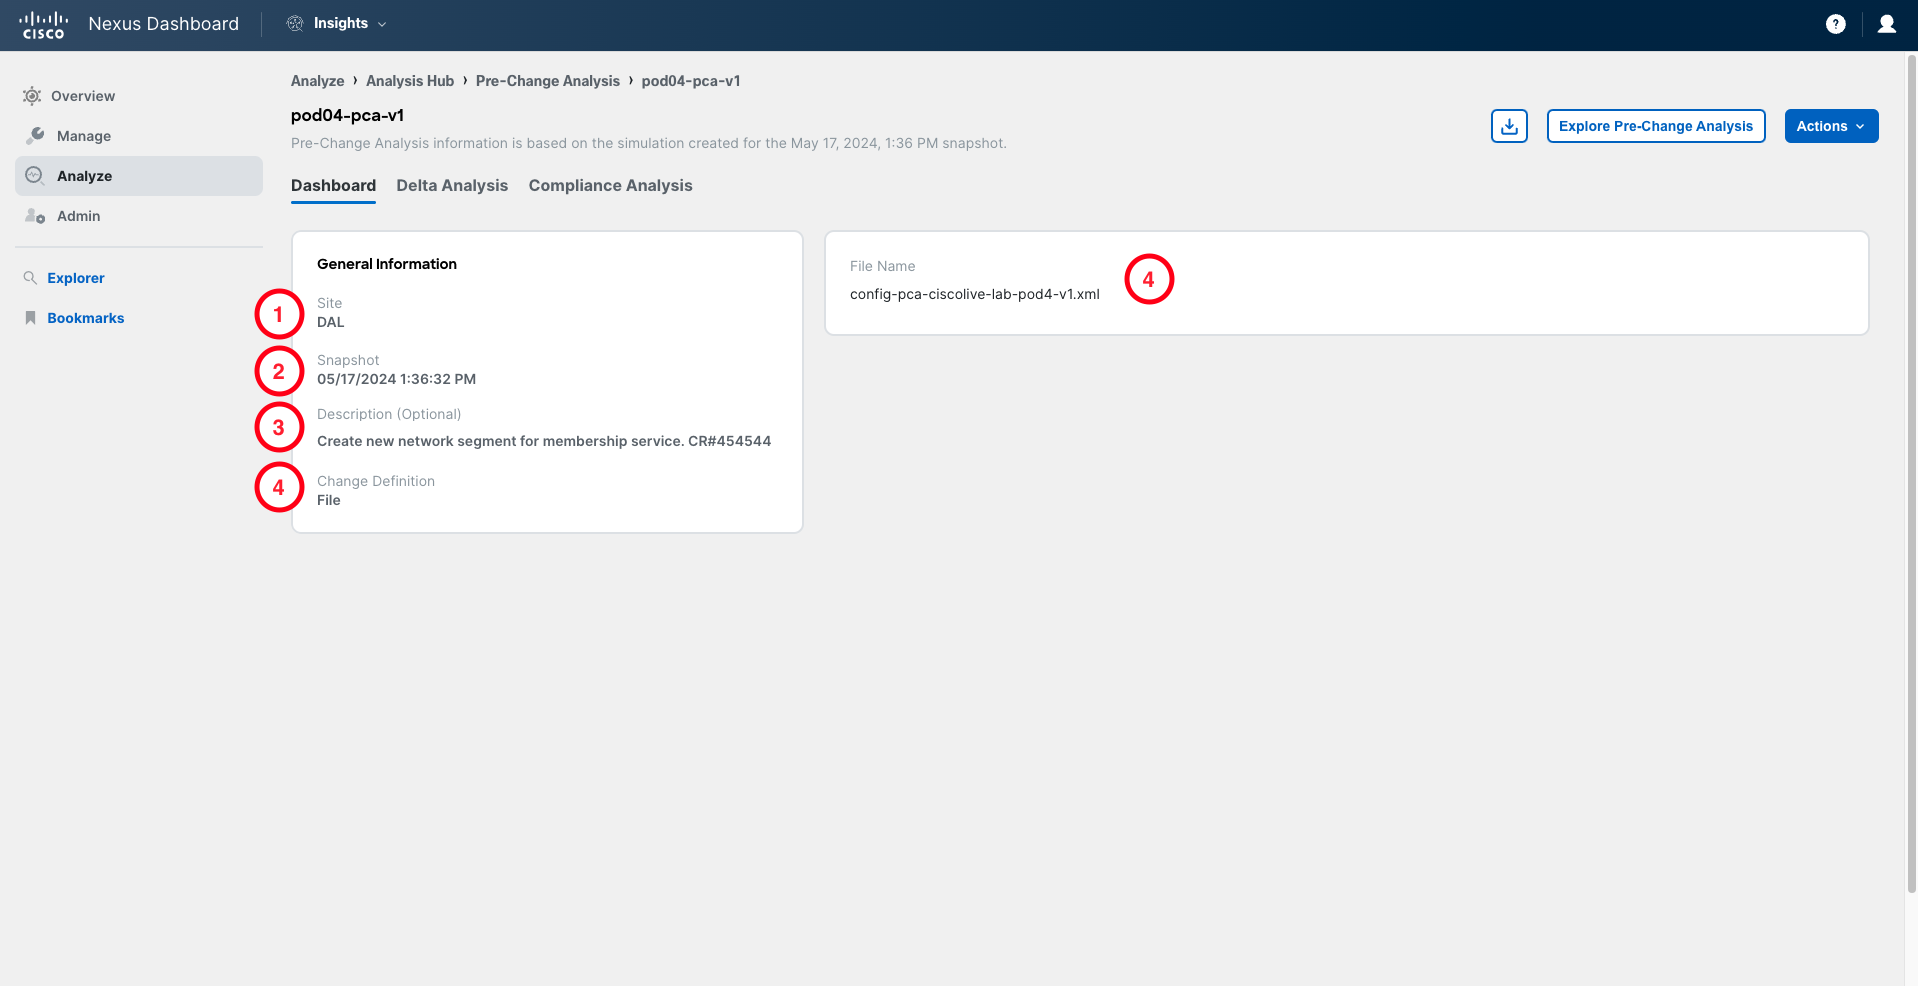
The first information you encounter after opening the analysis informs you about the settings used to create the Pre-Change analysis job:
- The site where the analysis has been performed (DAL = Dallas).
- The baseline snapshot, which is the baseline status of the fabric on which the simulation of potential anomalies will be done.
- The description of the job. It is always good practice to include a reference to the change request ID from your ITSM tool in the description.
- How the change details are specified. In this case, we have used a file in XML format that contains the details of the change. This XML file is what you have received from the administrator on your team who prepared the change. The XML file is a regular XML configuration file, just like the one you can post to APIC to apply some changes. The name of the file used is also specified on the dashboard.
Step 4
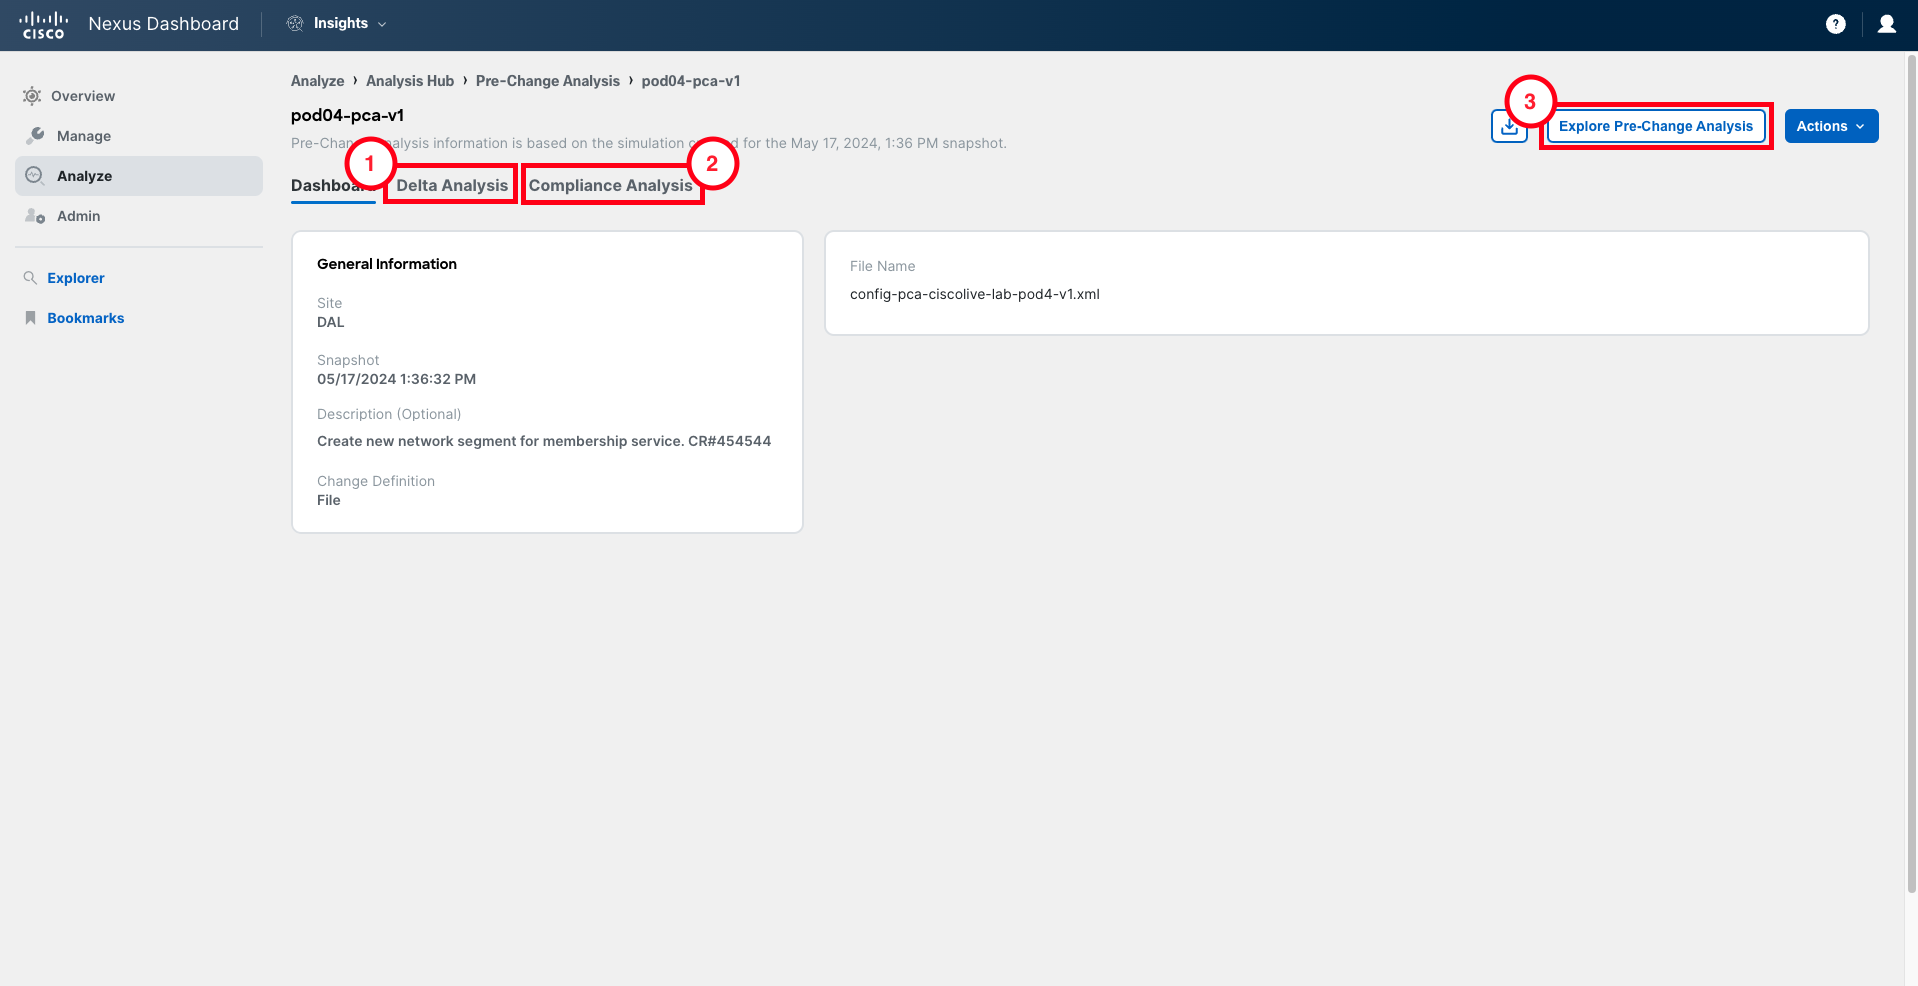
There are three main sections in the Pre-Change Analysis results:
- Delta Analysis: It shows the delta analysis between the status of the infrastructure before the change (baseline snapshot) and the status after the change (baseline snapshot + changes).
- Compliance Analysis: It displays the projected compliance status of the site after the changes are applied.
- Explore: It allows administrators to run Explore queries against the simulated model (baseline snapshot + changes).
Explore the results displayed in these three sections.
Step 5
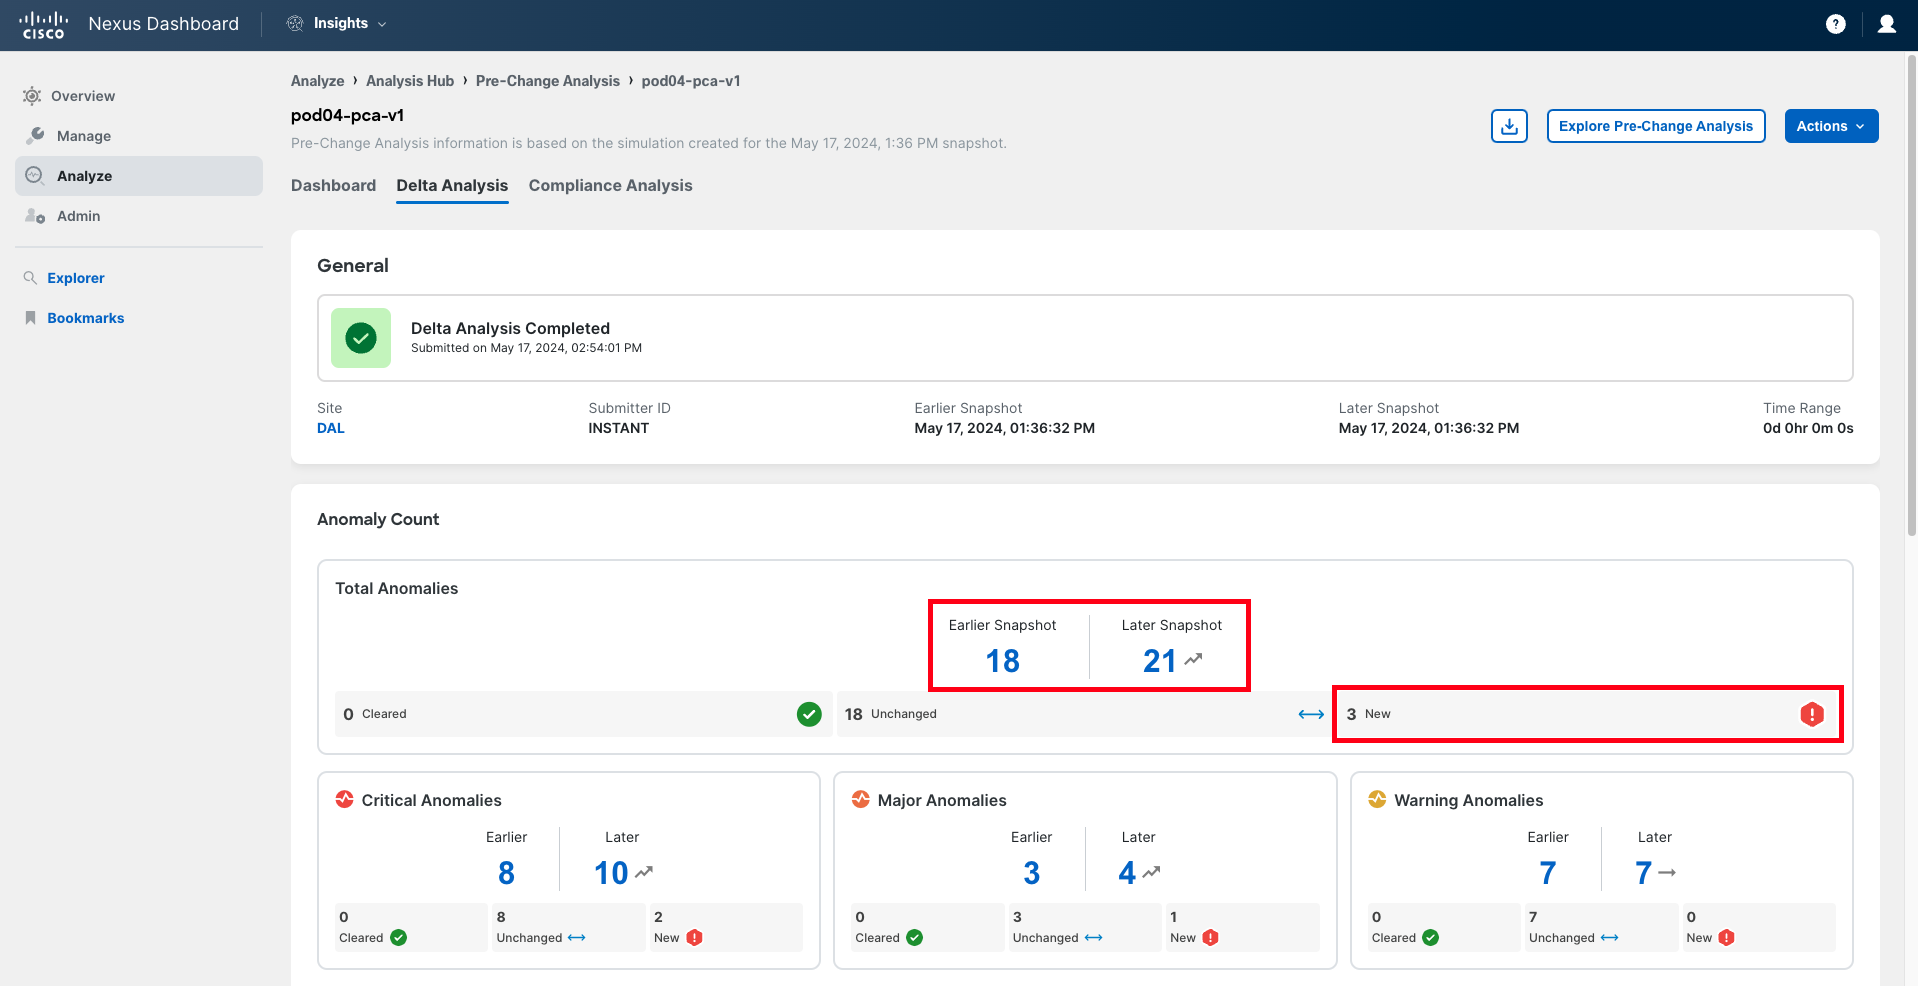
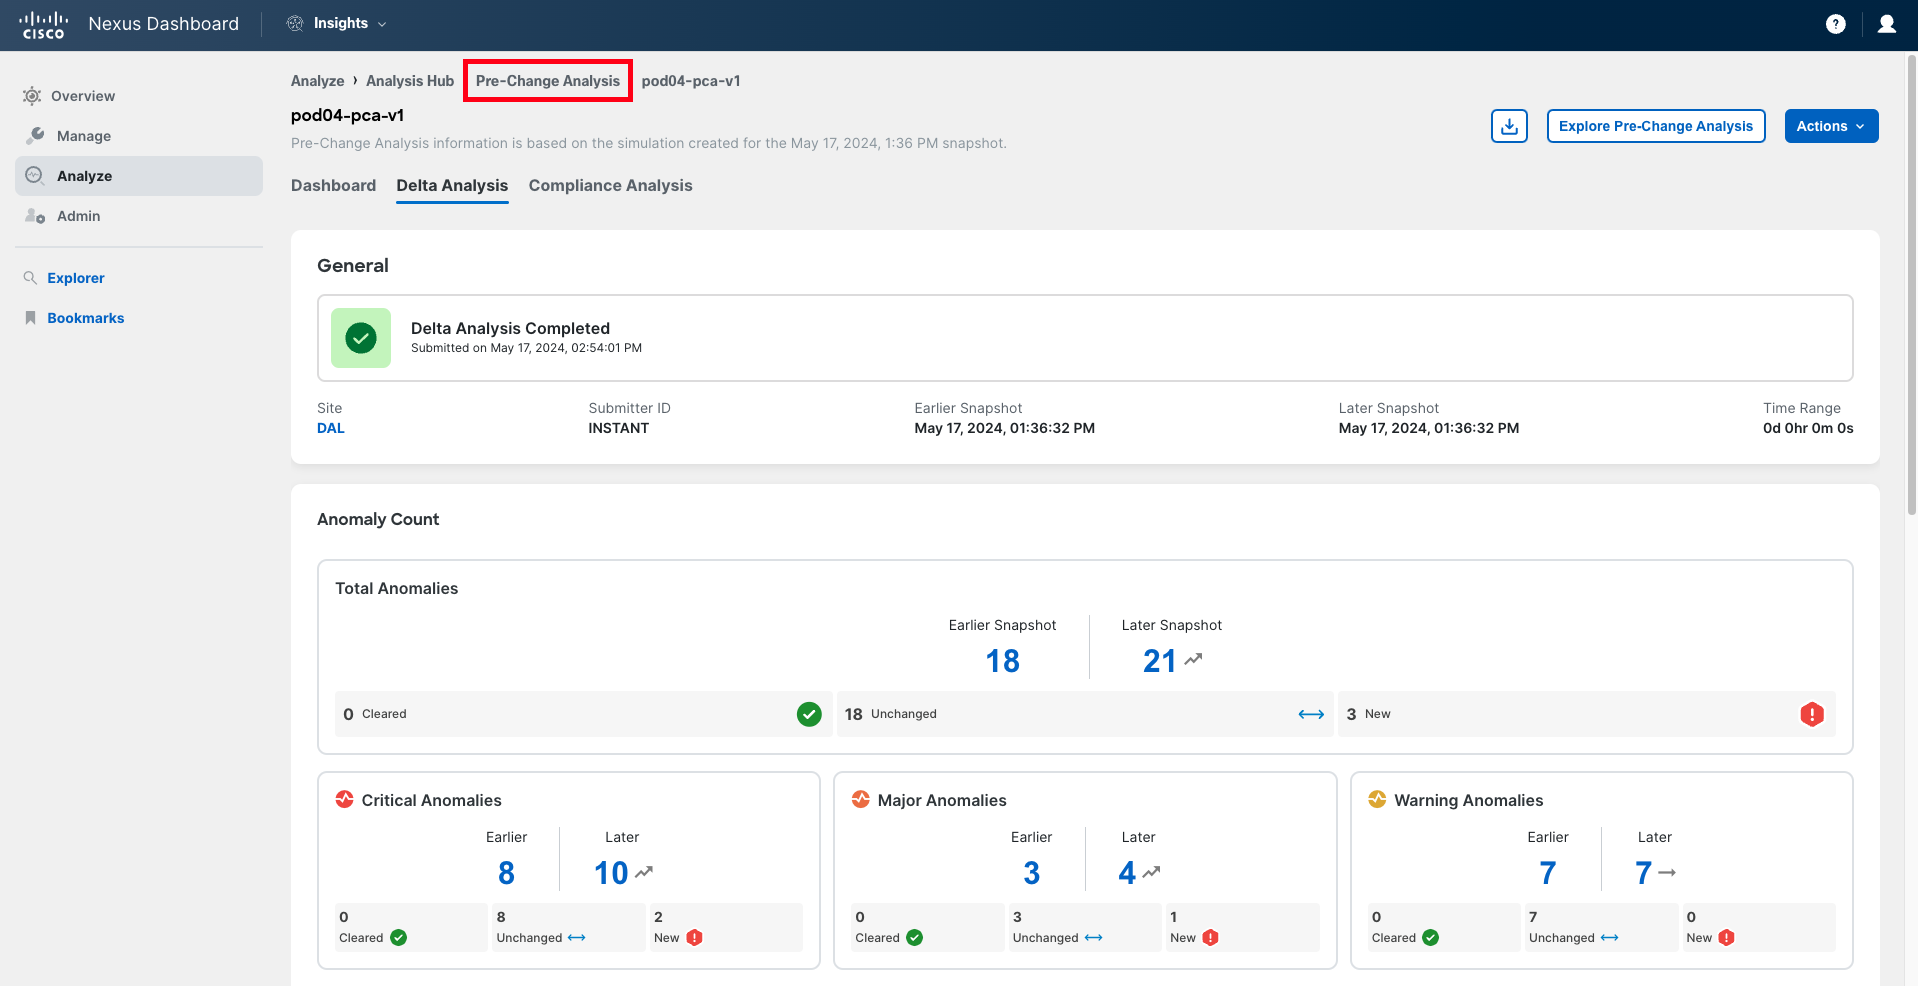
Navigate to Delta Analysis.
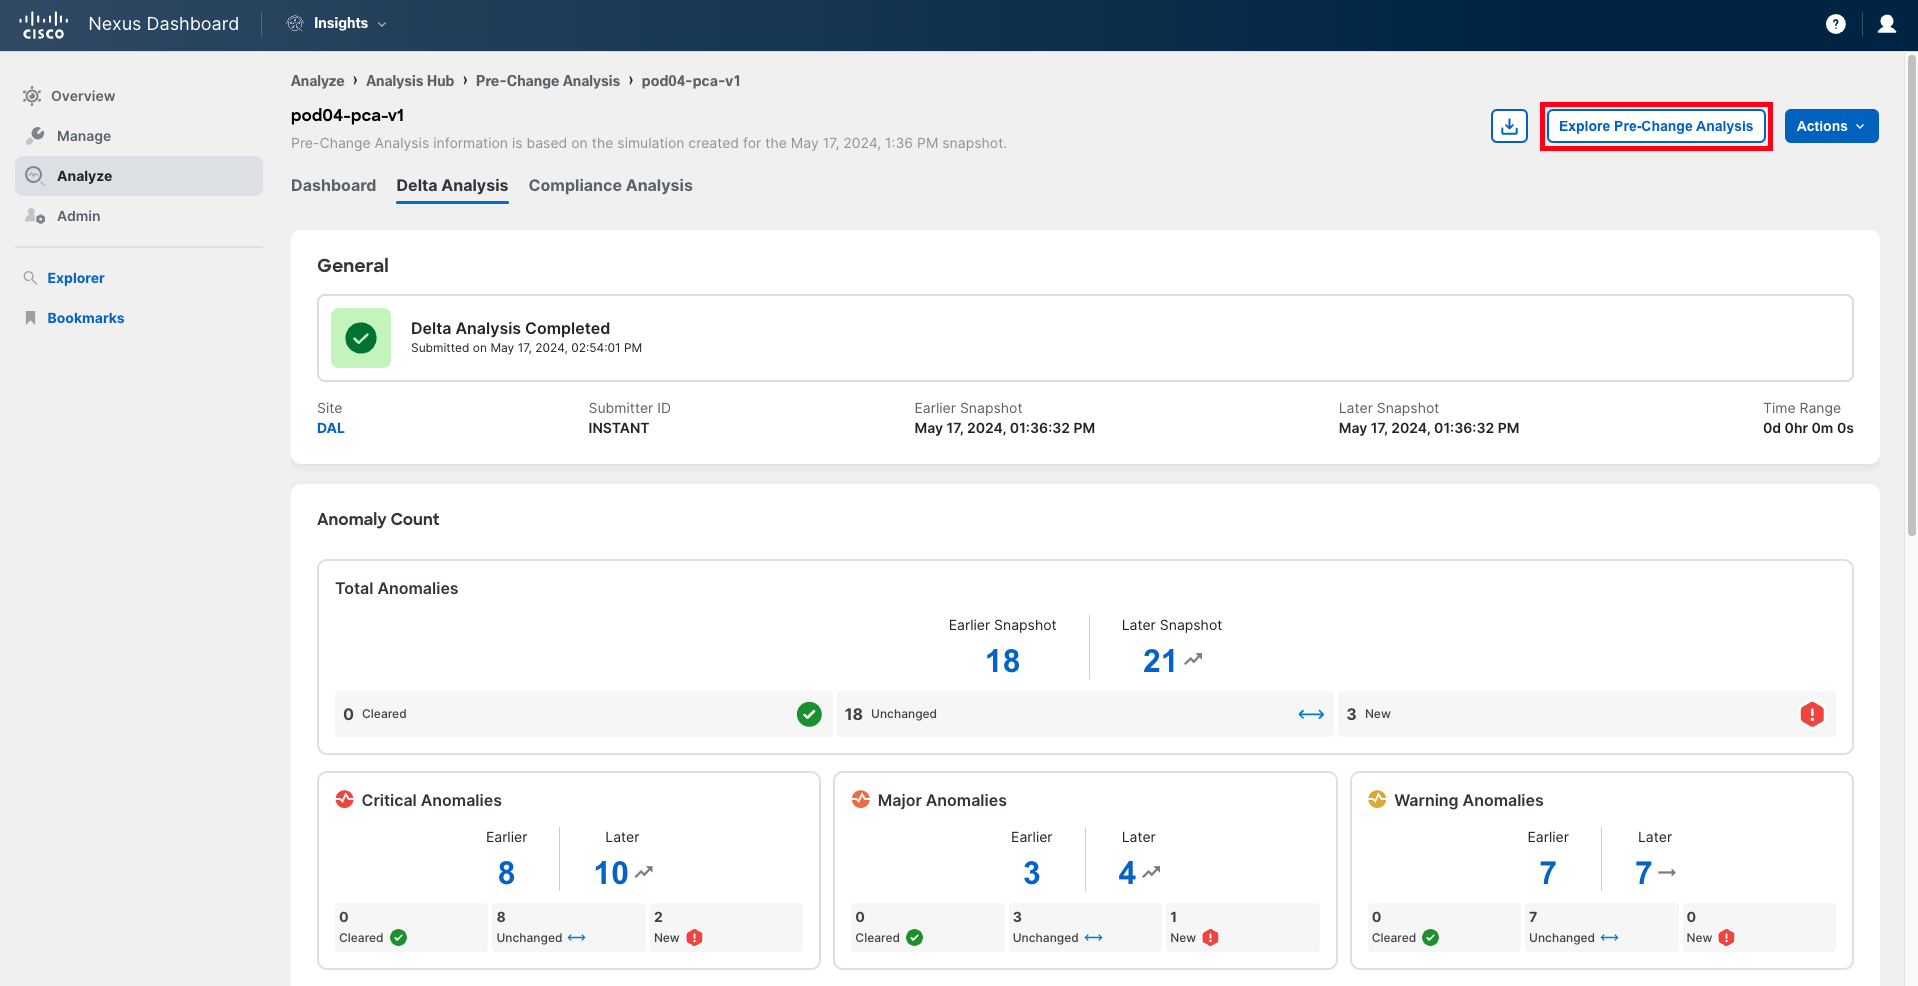
In the Anomaly Count panel, you can see the evolution of the number of anomalies, comparing the situation of the fabric before the change (in the baseline snapshot, also known as the earlier snapshot) and the situation the fabric will be in if the changes are applied. You will notice the number of anomalies has increased, which is not a good sign.
In the bottom right corner of each drawer, you can find the number of new anomalies being triggered, either globally or by severity. This number should be zero for all severities. In this case, it is not.
Click on the New number of total anomalies to analyze further.
Step 6
The focus has moved to the section All Anomalies, where the list of anomalies can be explored in more detail. Note that the filter is set to display only the new anomalies and group them by anomaly title.
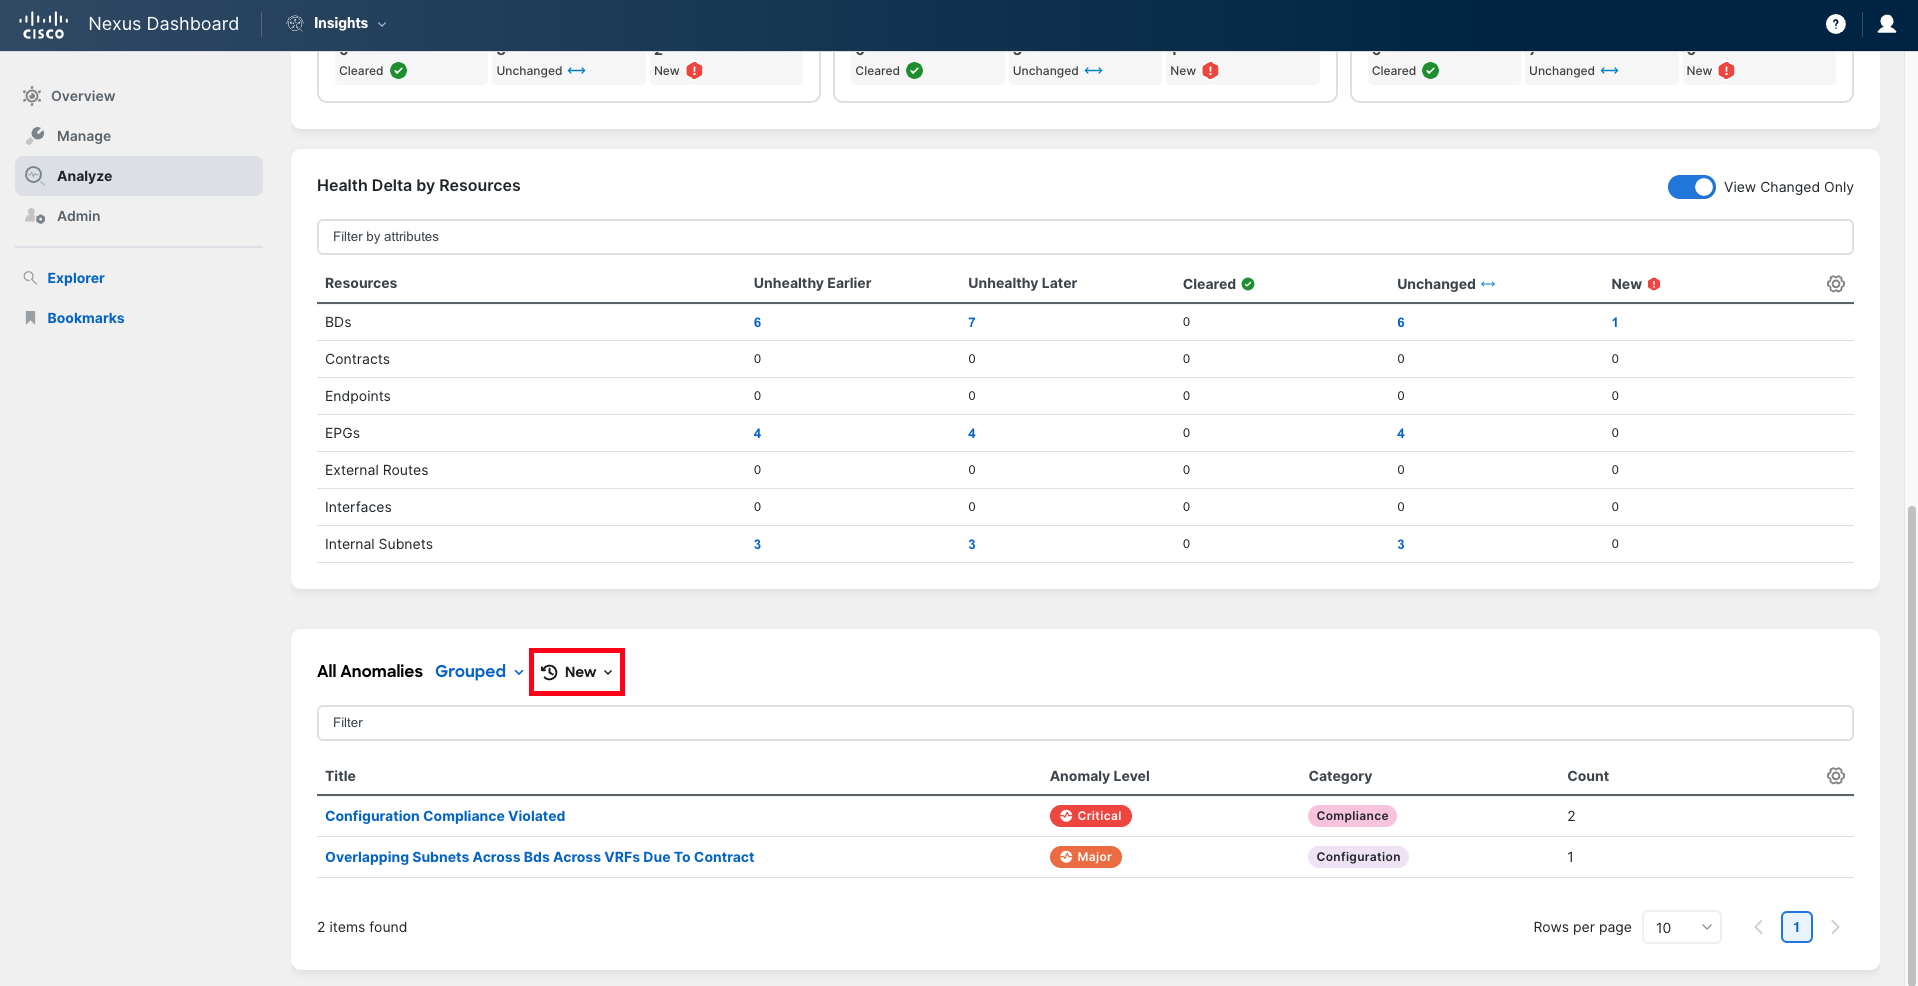
Explore the anomalies being raised.
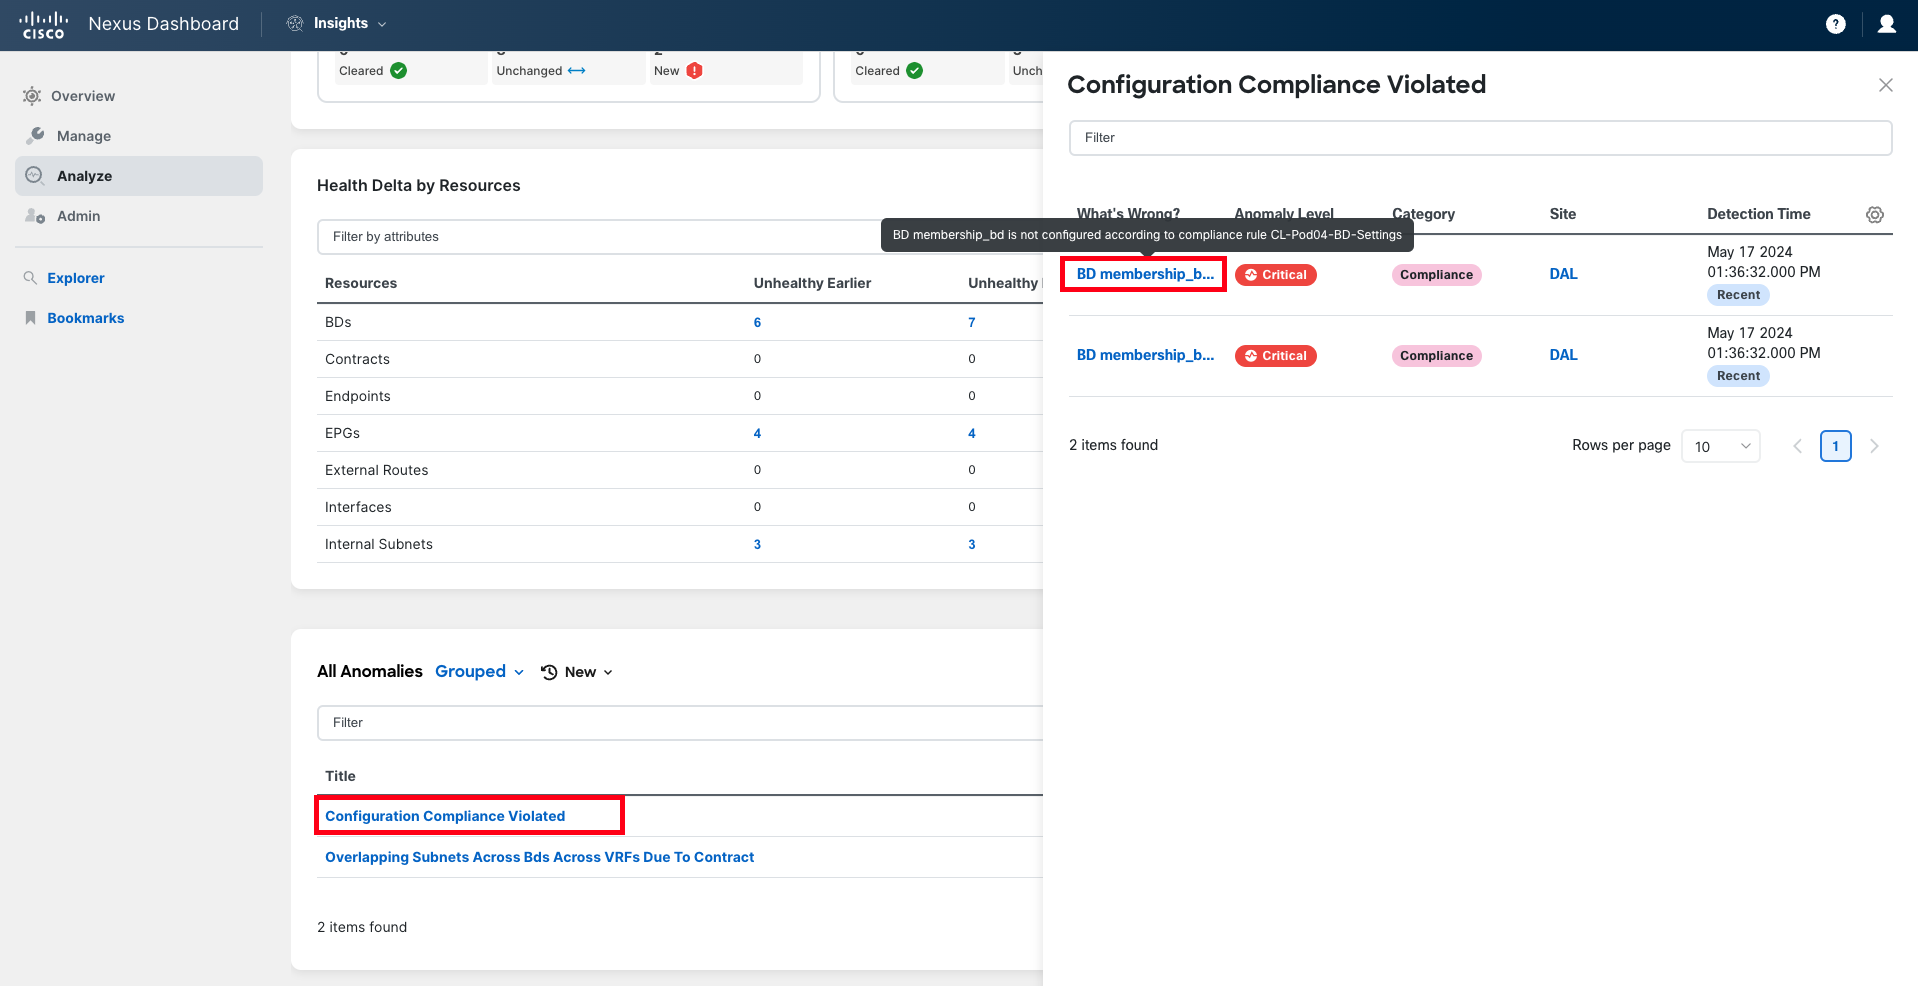
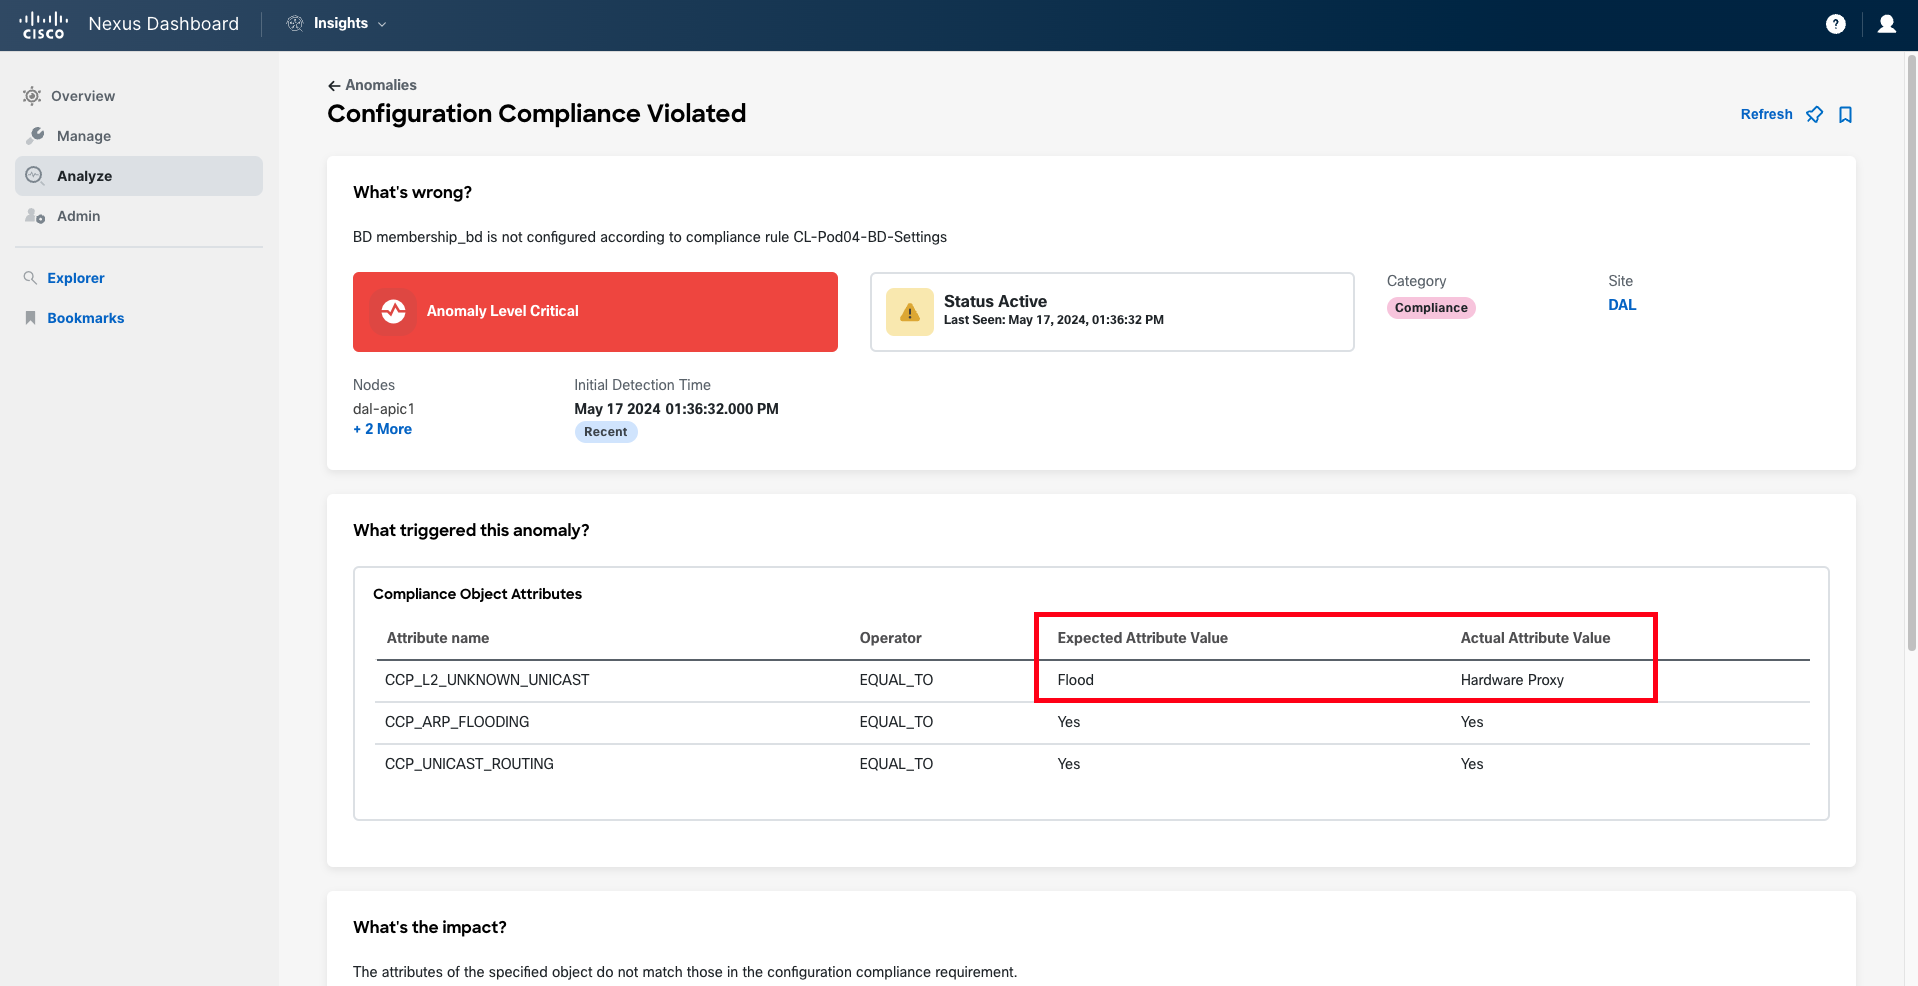
The first anomaly is triggered due to a configuration compliance violation that has been identified because the new bridge domain being configured does not adhere to the golden rules set for your organization. These golden rules dictate that Bridge Domains should be configured with L2 Unknown Unicast set to Flood, ARP Flooding enabled, and Unicast Routing enabled. However, the new bridge domain is configured to use Hardware Proxy.
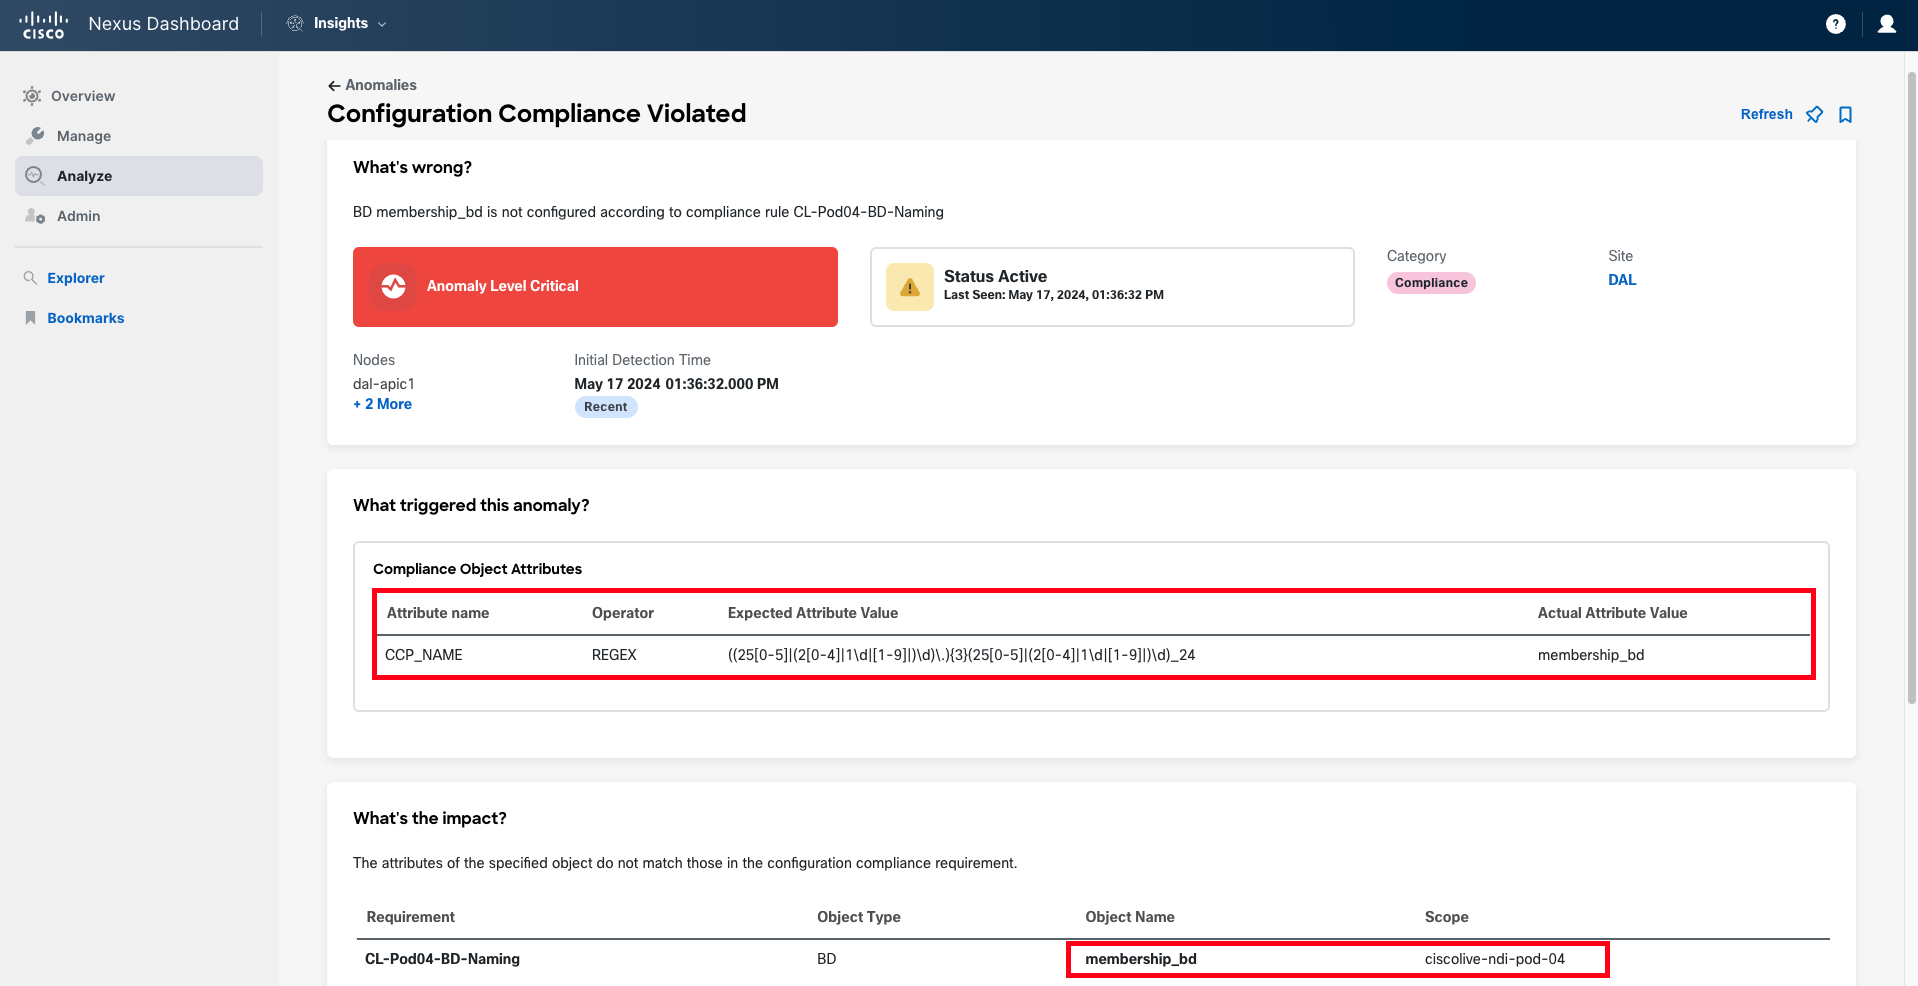
The second anomaly is also related to configuration compliance. In this case, it's a violation of your organization's naming conventions. According to the enforced naming convention, the bridge domain name should consist of the subnet IP address and the mask length, separated by an underscore. The bridge domain being configured does not meet that naming convention.
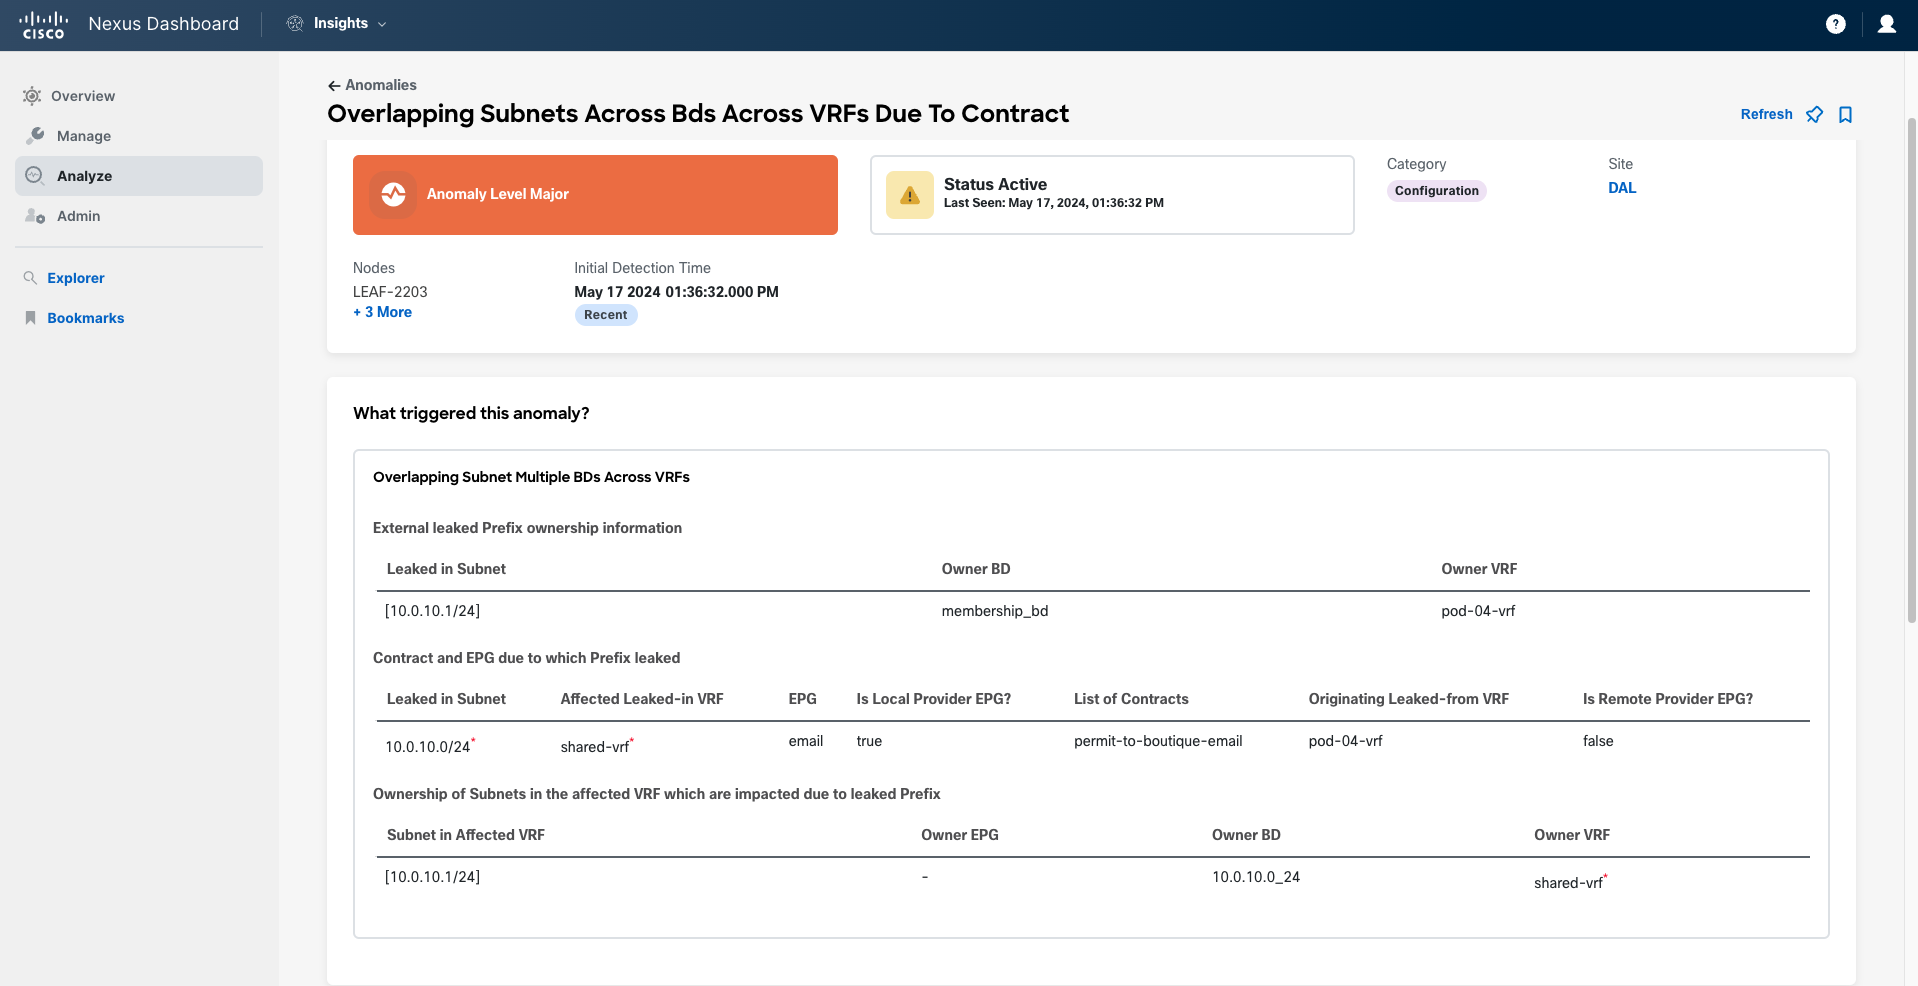
The last anomaly is triggered by the existence of overlapping subnets across Bridge Domains (BDs) introduced during route leaking. This issue occurs when two subnets from different VRFs overlap and conflict when one is leaked to the VRF where the other already exists. In the body of the anomaly, you can find all the information needed to troubleshoot and fix the issue: prefixes overlapping, which BDs they belong to, the contract producing the leaking, and more.
All these anomalies must be resolved before the change can be applied to the production fabric.
Step 7
Before fixing the issues found, let's also use this pre-change analysis to confirm whether the required communication for the membership service is in place. For instance, let's explore how the connectivity between the 'Checkout' service and the 'Membership' service will look if you proceed with the configuration.
Open the Explore function by clicking on Explore Pre-Change Analysis.
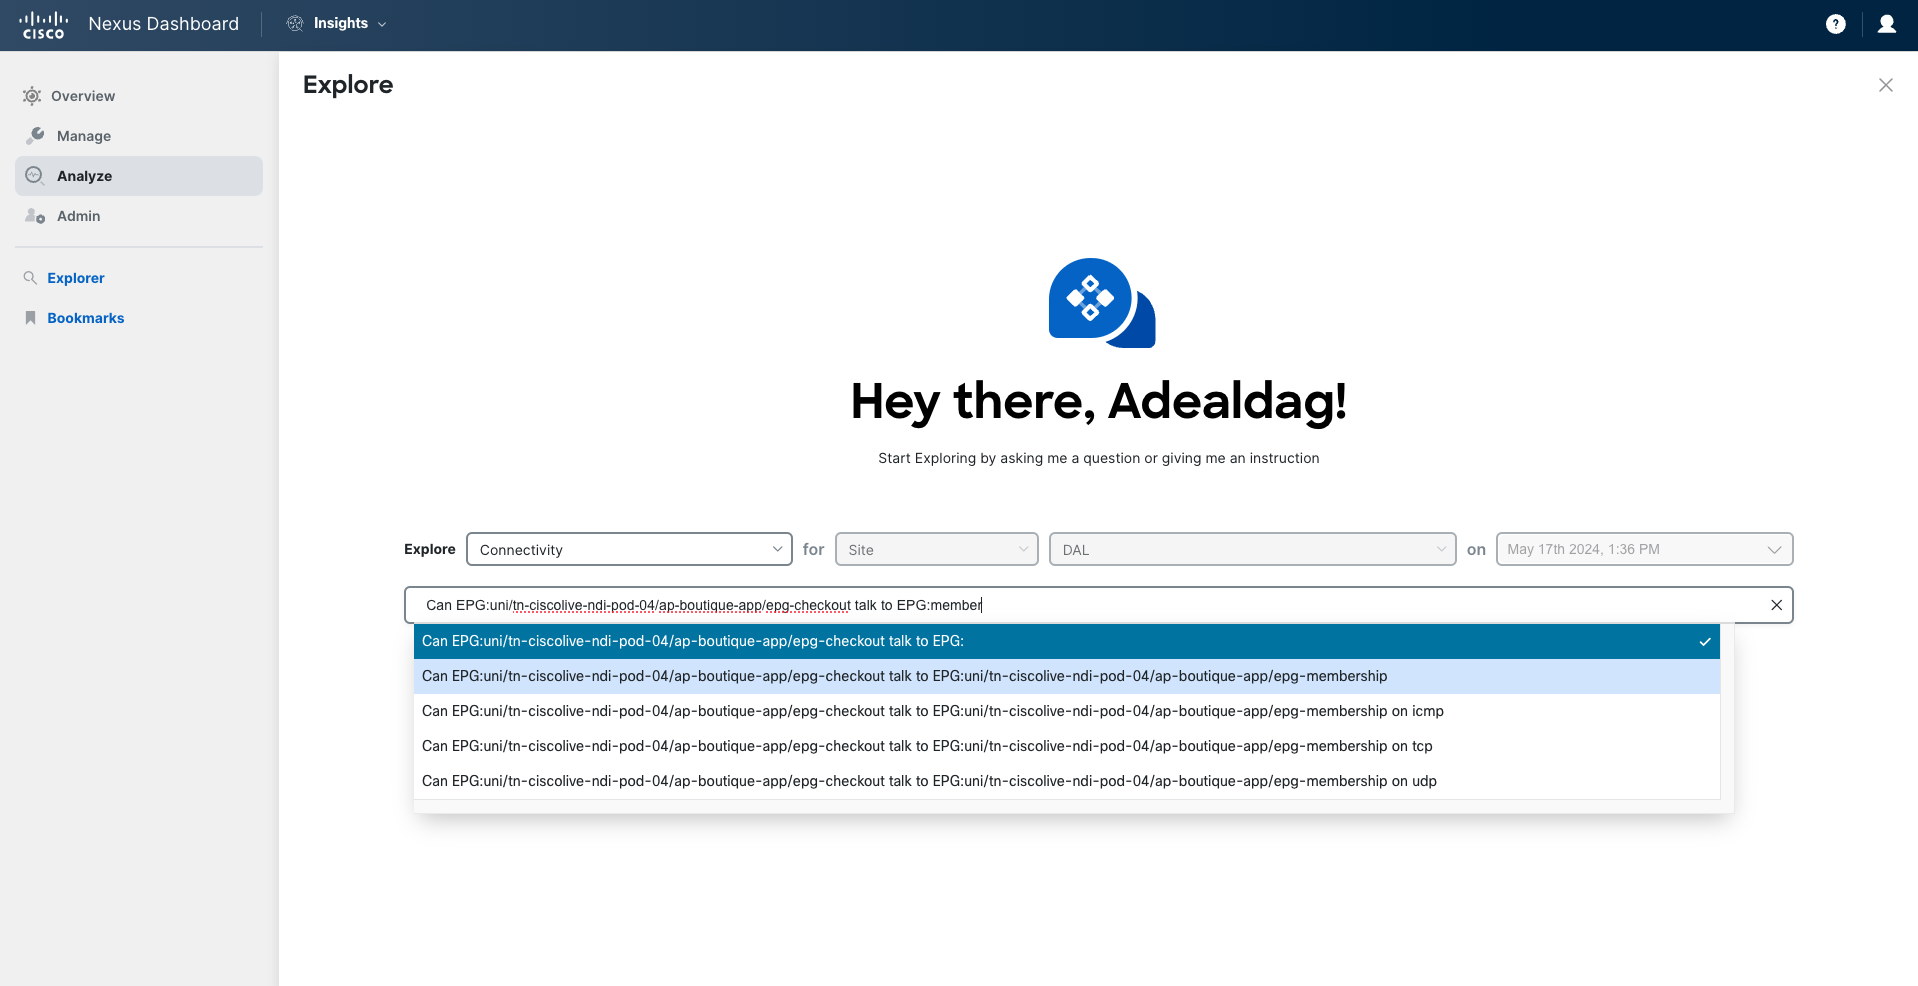
Select the option Explore Connectivity and then execute different queries to verify the communication allowed to/from the new service. For instance, you can run the query:
Can EPG:uni/tn-ciscolive-ndi-pod-XX/ap-boutique-app/epg-checkout talk to EPG:uni/tn-ciscolive-ndi-pod-XX/ap-boutique-app/epg-membership on tcp?
Or...
Can EPG:uni/tn-ciscolive-ndi-pod-XX/ap-boutique-app/epg-checkout talk to EPG:uni/tn-ciscolive-ndi-pod-XX/ap-boutique-app/epg-membership on tcp dport:5555?
Note that while you are typing your query in natural language, Nexus Dashboard helps you auto-complete your query by suggesting supported terms you can use.
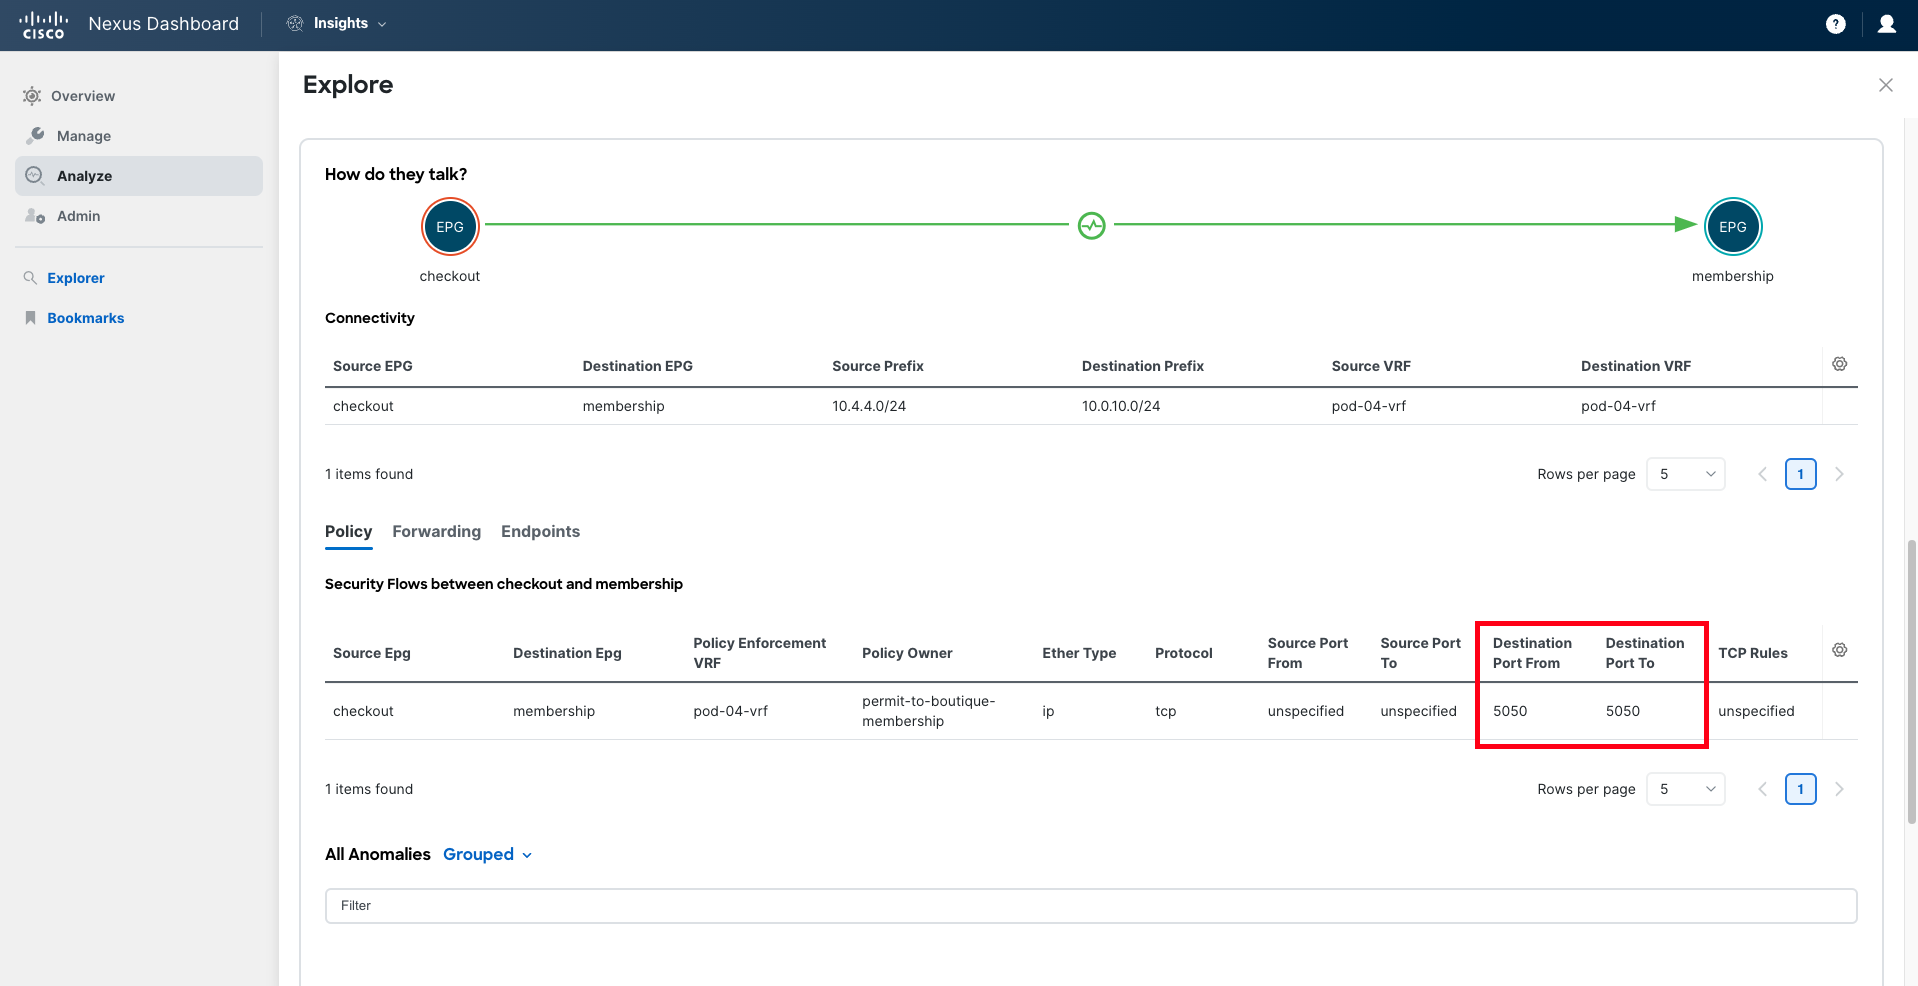
Once the query is completed, Nexus Dashboard will analyze whether the connectivity you have requested to verify is possible from different perspectives: policy, forwarding, and endpoints being learned.
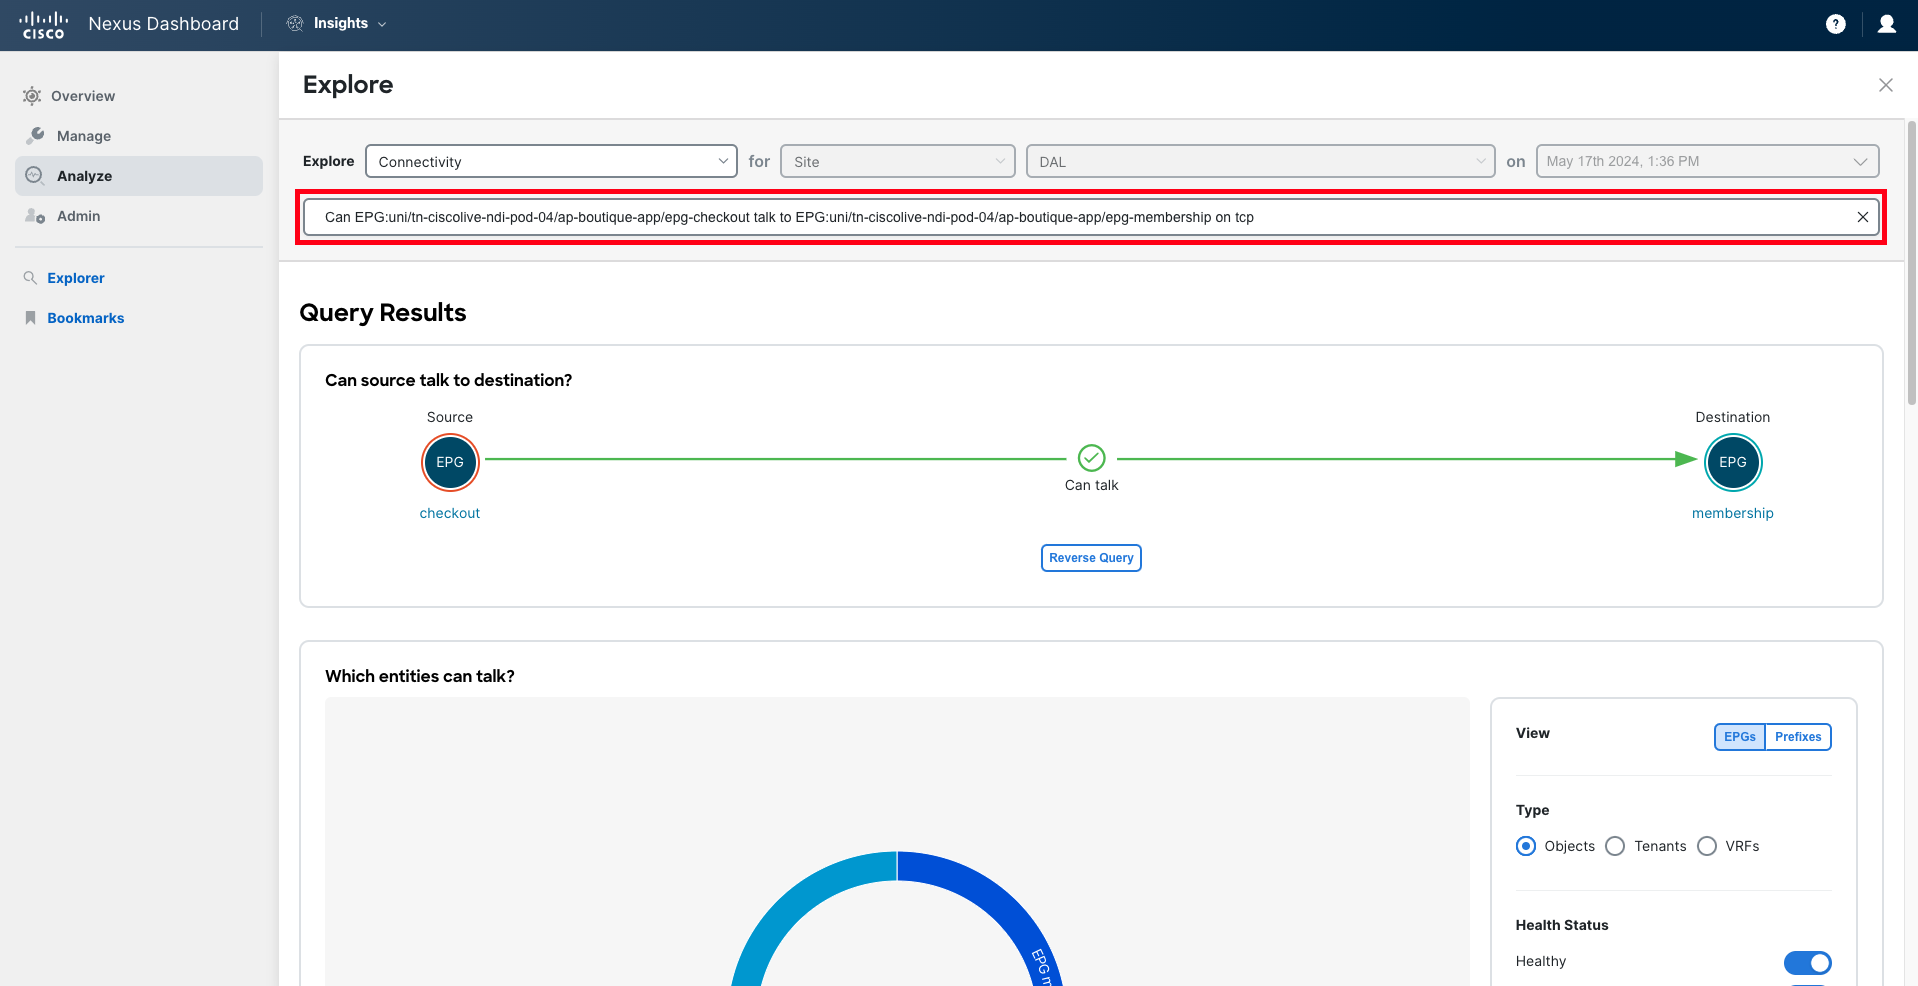
You will notice that Nexus Dashboard Insights reports that connectivity from the 'Checkout' service to the 'Membership' service is not allowed on port "TCP:5555". Based on this analysis, you can determine that this is due to a misconfiguration in the contract filter that is allowing port "5050" instead of "5555".
Note
If you want Nexus Dashboard Insights to automatically verify whether communication is (or is not) allowed between two entities, you can use communication compliance rules to configure this. When compliance rules are configured, Nexus Dashboard Insights will check this for you during every assurance run, and also during a Pre-Change Analysis. Check Use Case Compliance to learn more about compliance management in Nexus Dashboard Insights.
Step 8
The next step is to resolve the issues found in the configuration. In the screenshot below, you can find a comparison between the configuration your colleague prepared (v1, left) and the one with the required modifications indicated by Nexus Dashboard (v2, right).
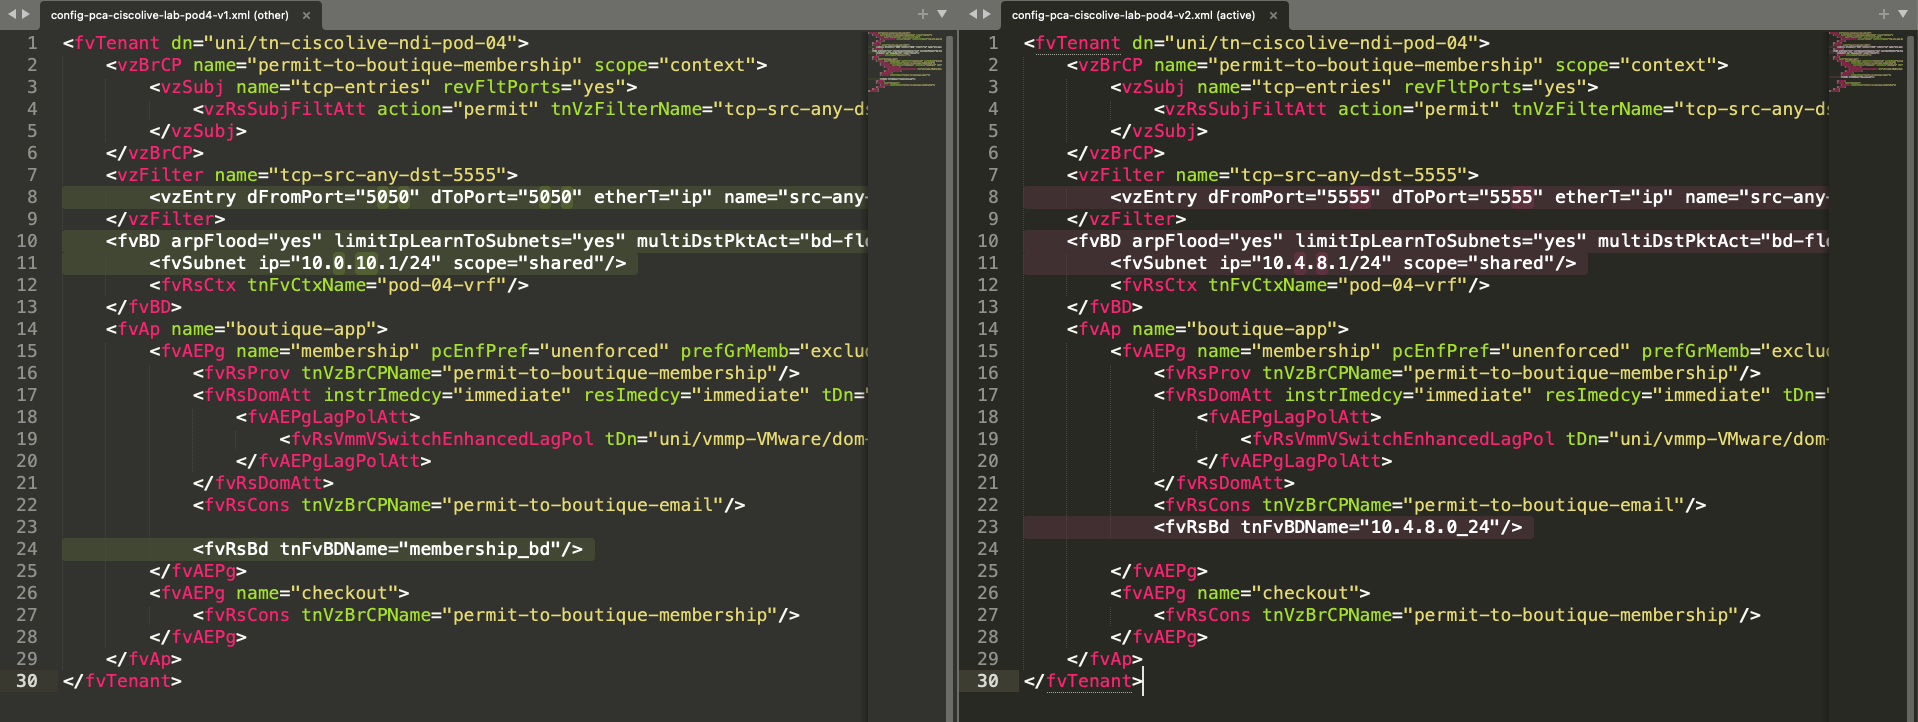
The following changes were made:
- The Bridge Domain name has been changed.
- The Bridge Domain settings have been adjusted to use Flood for L2 Unknown Unicast traffic.
- The Bridge Domain subnet has been updated to use the correct and non-overlapping subnet.
- The contract configuration has been corrected to use port "TCP:5555".
After the configuration has been fixed, it is strongly recommended to run another pre-change analysis to confirm that there are no more issues with the configuration and to verify that previous issues have been properly addressed.
This additional pre-change analysis has already been run. Let's then explore the results of that additional pre-change analysis.
Step 9
Navigate back to the list of Pre-Change Analysis jobs by clicking on Pre-Change Analysis in the navigation bar at the top.
The filter in place may have been removed when navigating back to this table. Filter again using the filter bar, typing "Name contains podXX", where XX represents your pod ID in two-digit format (for example, pod04).
Then click on the analysis that ends with "v2". This is the analysis performed with the amended configuration.
Step 10
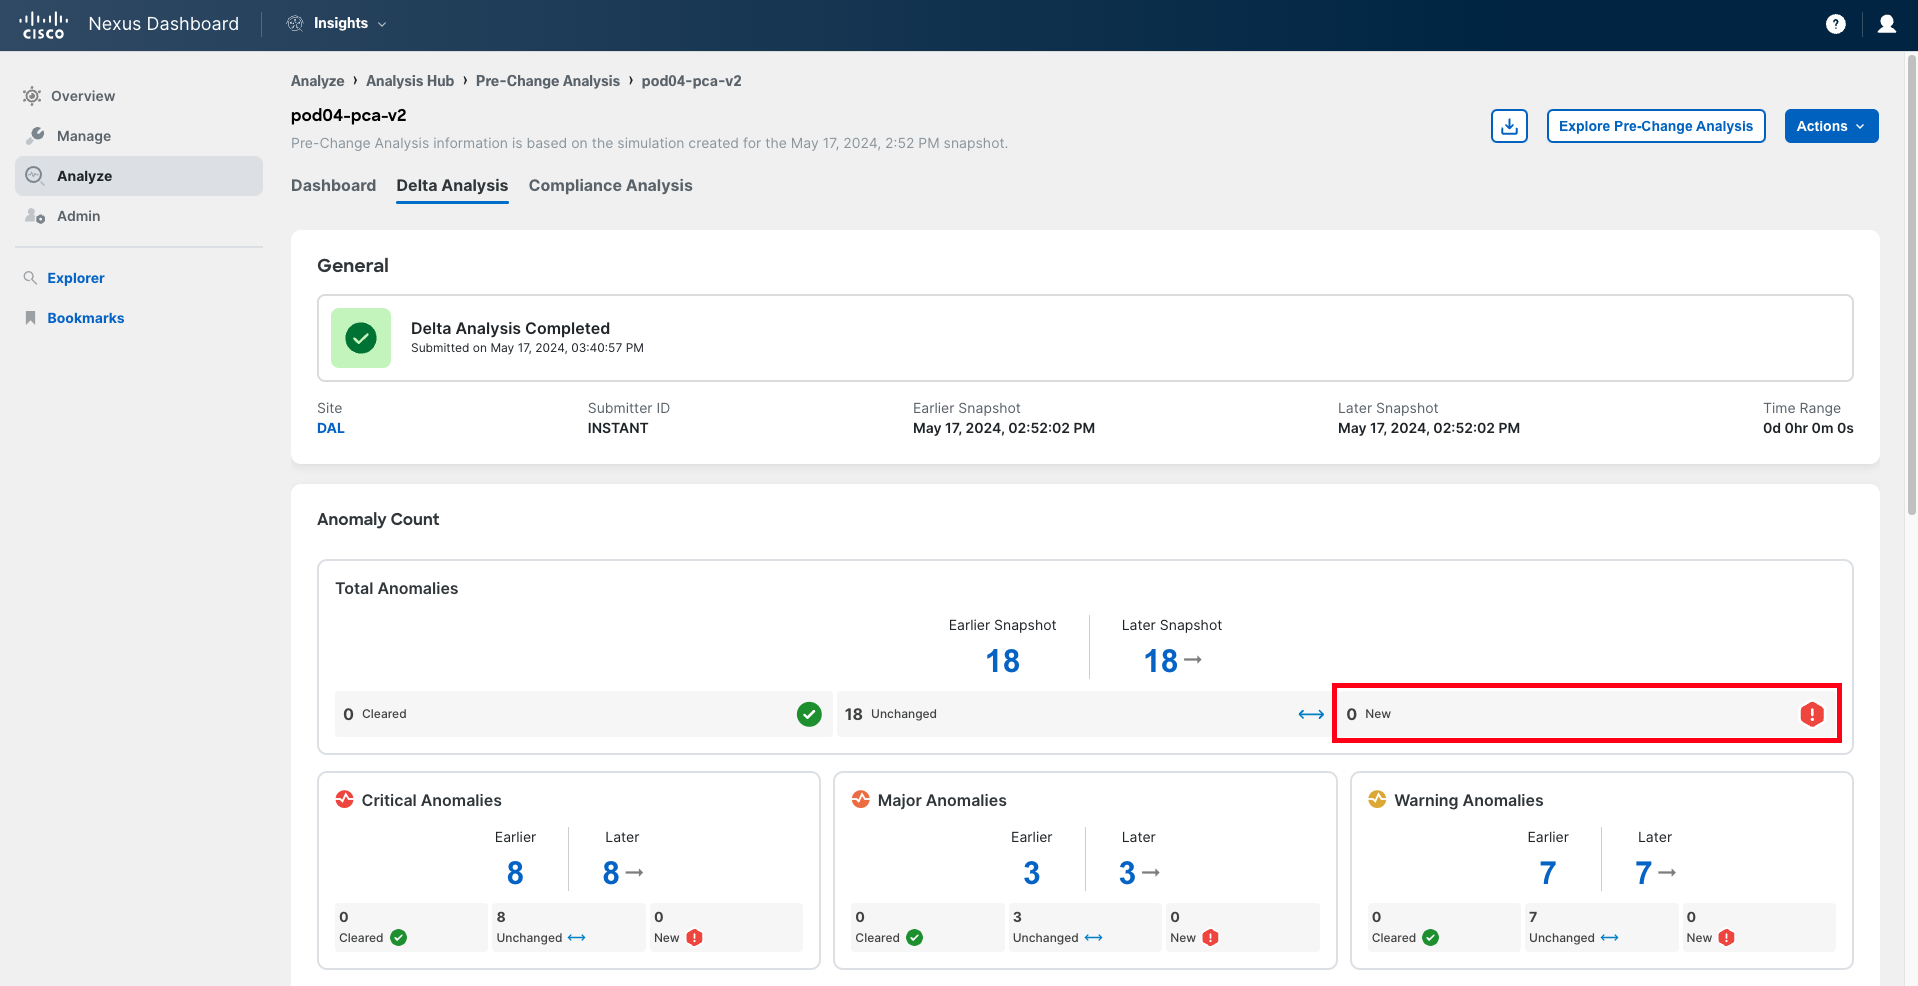
Navigate to Delta Analysis and verify that no new anomalies are being triggered. This reassures administrators that the configuration is correct, thereby reducing change risk.
Step 11
Navigate to Explore Pre-Change Analysis and repeat the same queries you ran before. Verify that now communication from Checkout to Membership is allowed on port "TCP:5555".
Can EPG:uni/tn-ciscolive-ndi-pod-03/ap-boutique-app/epg-checkout talk to EPG:uni/tn-ciscolive-ndi-pod-03/ap-boutique-app/epg-membership on TCP dport:5555


Step 12
After the Pre-Change Analysis has been successful, you can deploy the configuration on the Cisco ACI fabric.
First, download the XML file (v2) with the change description. The configuration file can be found on the website below. You can save it in the Documents folder of your jumphost.
Note
The direct link to the files is http://ciscolive-ltrdcn2258-docs.s3-website.eu-central-1.amazonaws.com/pod-xx/config-pca-ciscolive-lab-podxx-v2.xml, where "xx" is your pod number in a 2-digit format.
Once you have the configuration file (v2), navigate to the Cisco ACI UI, right-click on the tenant name, and select the Post... option. Then select the corrected configuration file (v2) that has been verified with the Pre-Change Analysis (the corrected one). Finally, click Post.
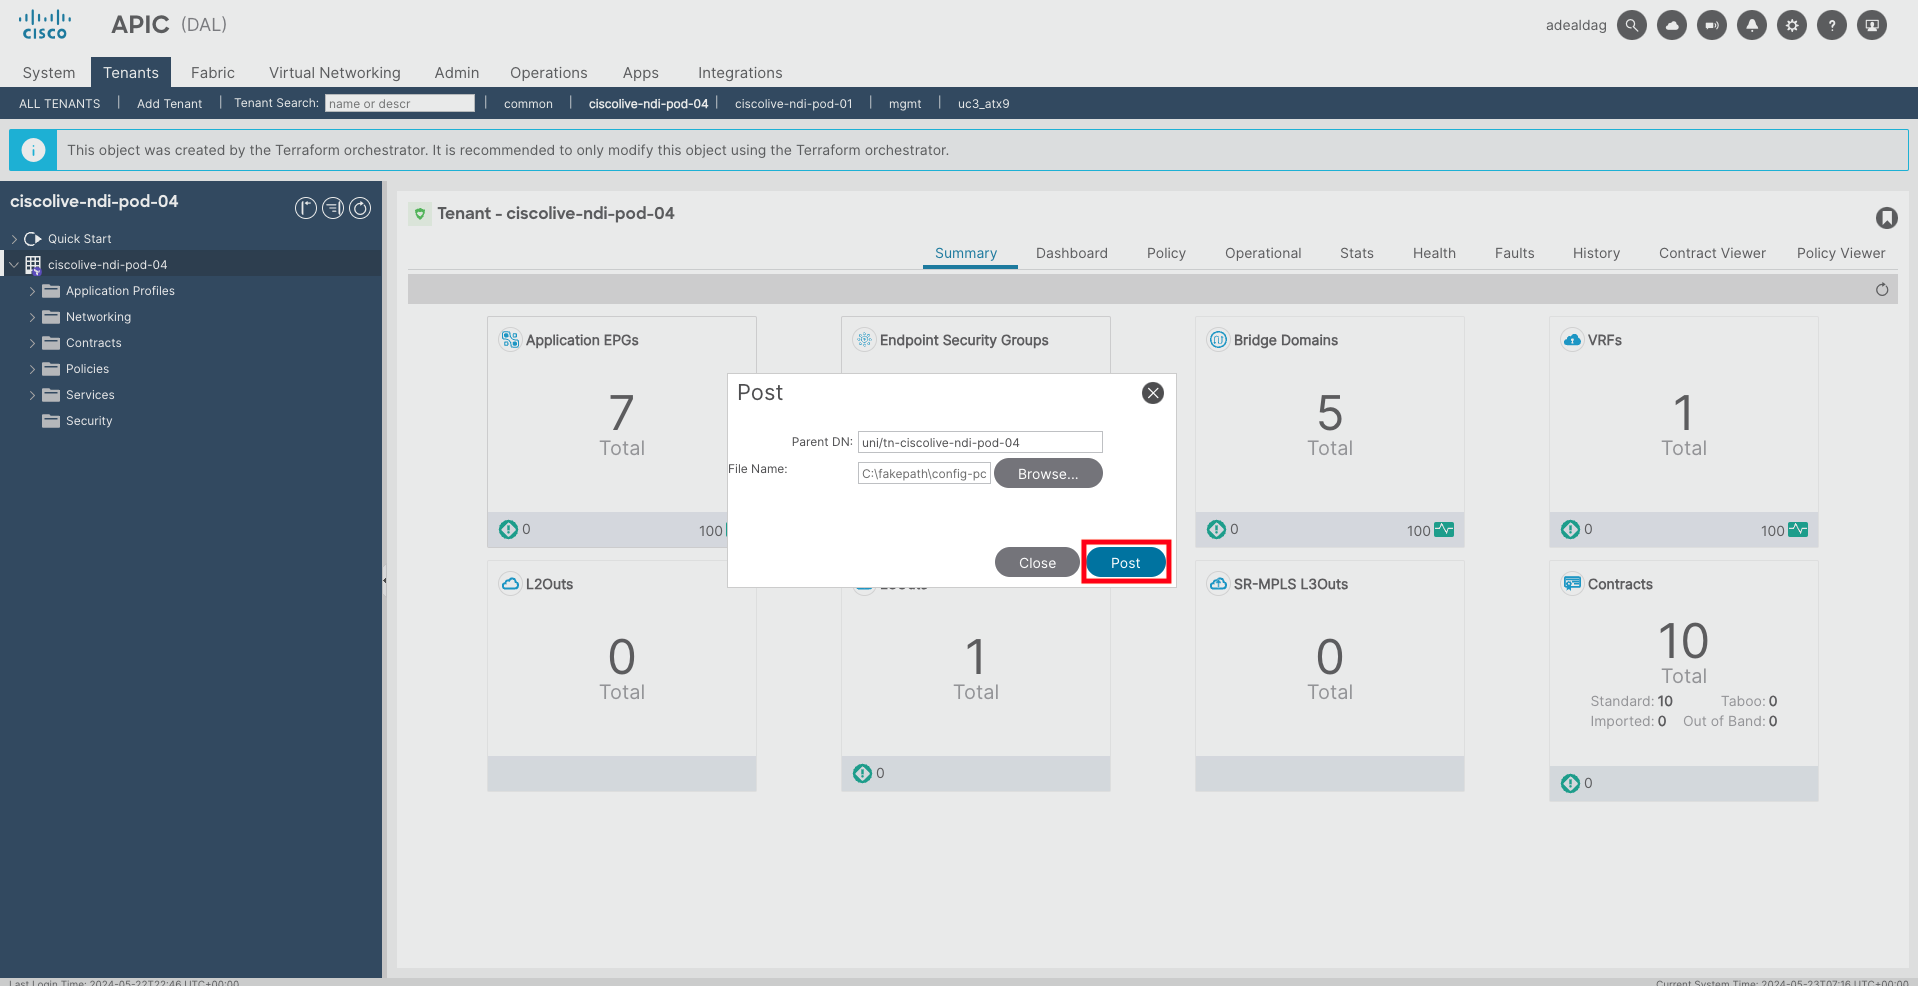
Changes will be pushed immediately to the APIC. Note down the time when the change has been made, as you will need it later. Now you can proceed with post-change validations.
Note
After applying the change on the APIC, it is always a good practice to verify if any new faults are being raised in Cisco ACI before proceeding with the Nexus Dashboard Insights post-change analysis. In this scenario, you should verify that there are no faults raised under the tenant.
Step 13
Warning
This step is for informational purpose only. We are running a background script to trigger instant Assurance Analysis for you to create a snapshot of ACI fabric. During this lab, it can take up to 20 minutes to have new snapshot. This can depend on at what stage of snapshot creation you would perform any configuration changed. This time might be a good time for a break, strech your legs or get a coffee. In your production environment, you would trigger the assurance analysis for your site manually at this stage. At the end of this guide, there is separate chapter describing how to do it. We recommend to check it when you are done with this lab.
Step 14
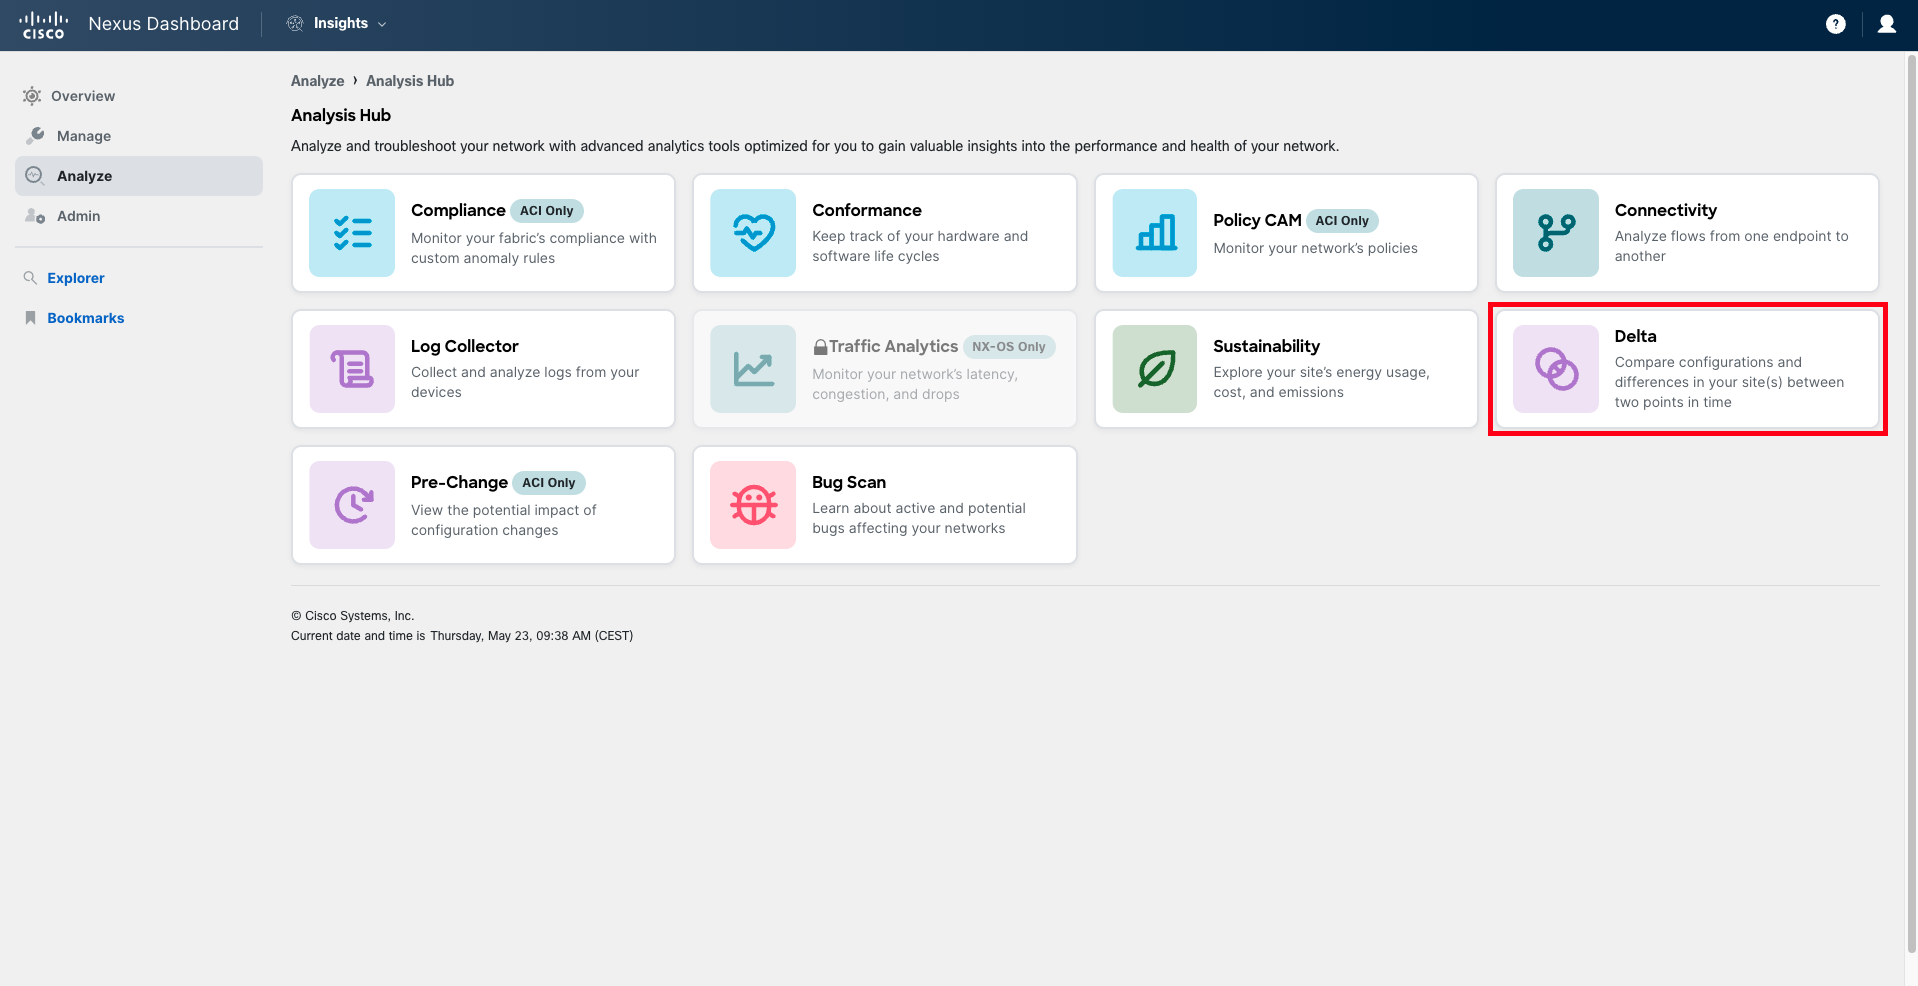
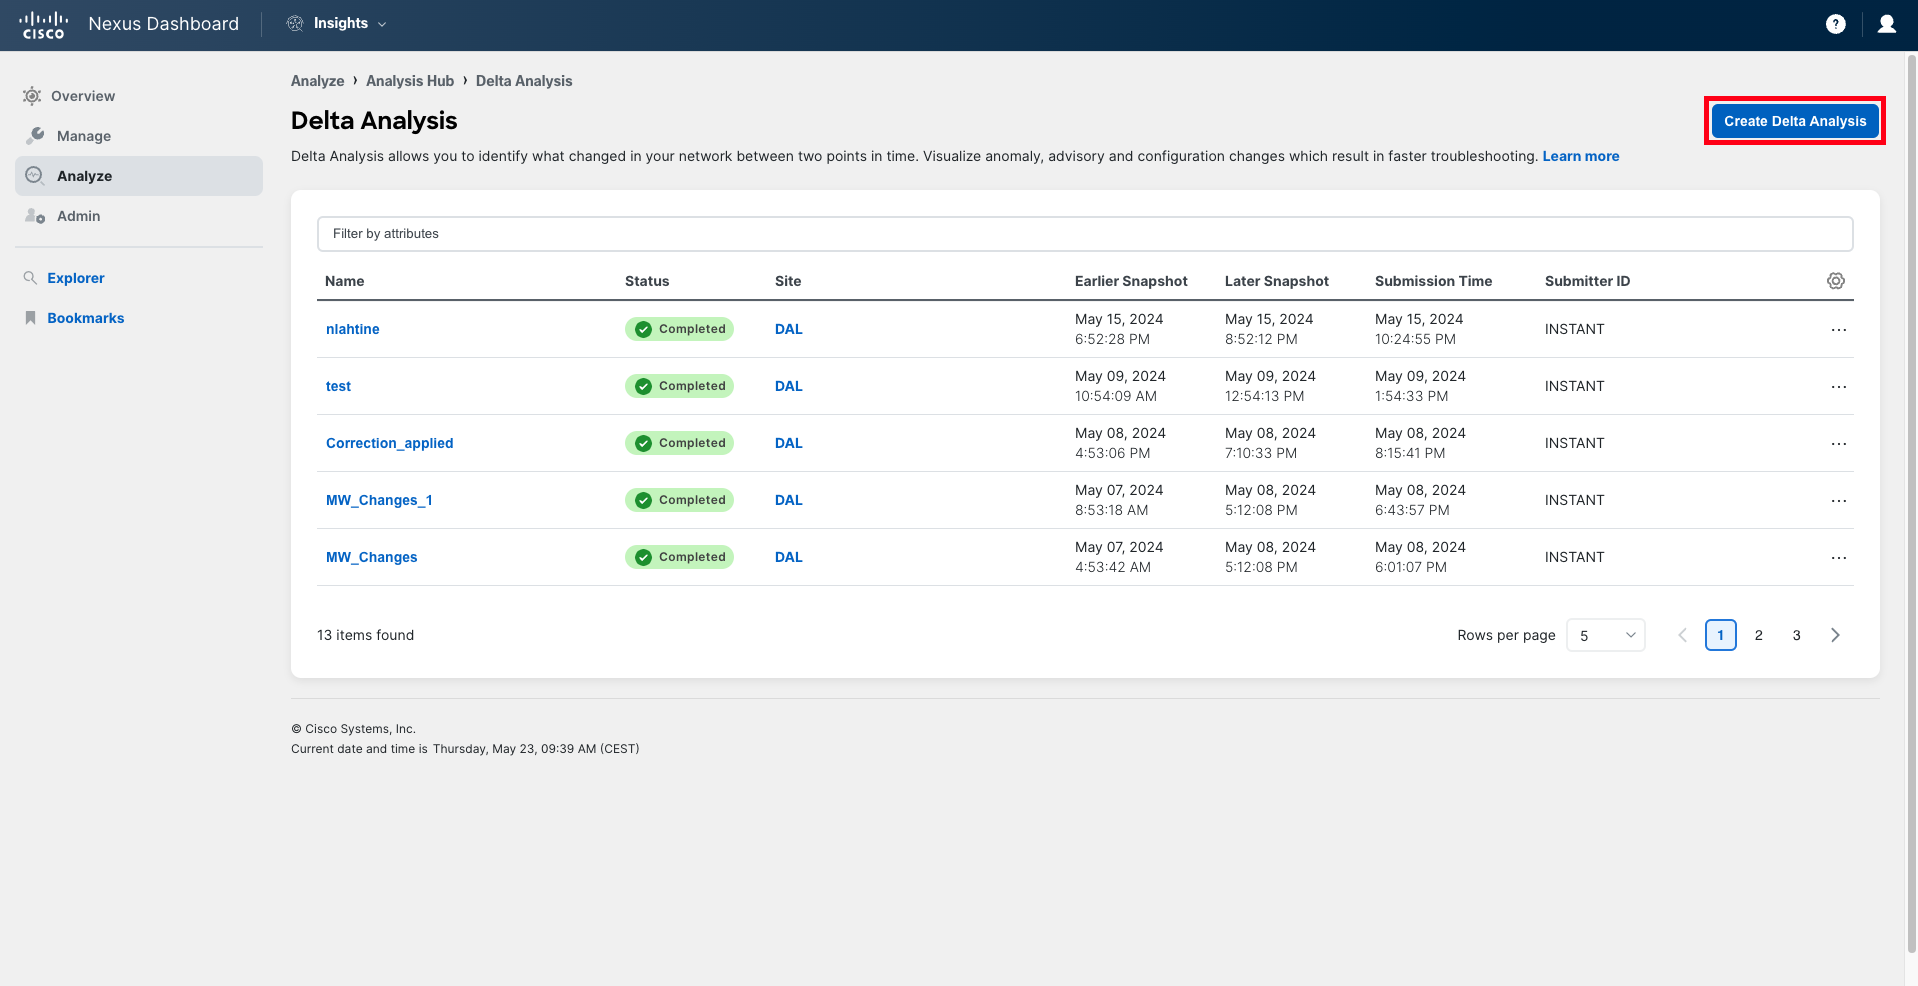
After the assurance collection is complete, navigate to Analyze > Analysis Hub > Delta Analysis and create a new delta analysis.
Step 15
Provide a new name for the delta analysis job, ensuring it includes the pod number in double-digit format. For example, delta-pod04. Select the Dallas site and choose the two snapshots to compare. The earlier snapshot must be the one right before the change was applied on the APIC, and the later snapshot should be the one immediately after the change was applied. Reference the time you noted down when you pushed the configuration to the APIC.
Warning
If you don't see a snapshot with a timestamp later than the time of your post-action to the APIC, you need to wait until the current assurance collection is completed. Please consult your proctor in case of any question related to this.
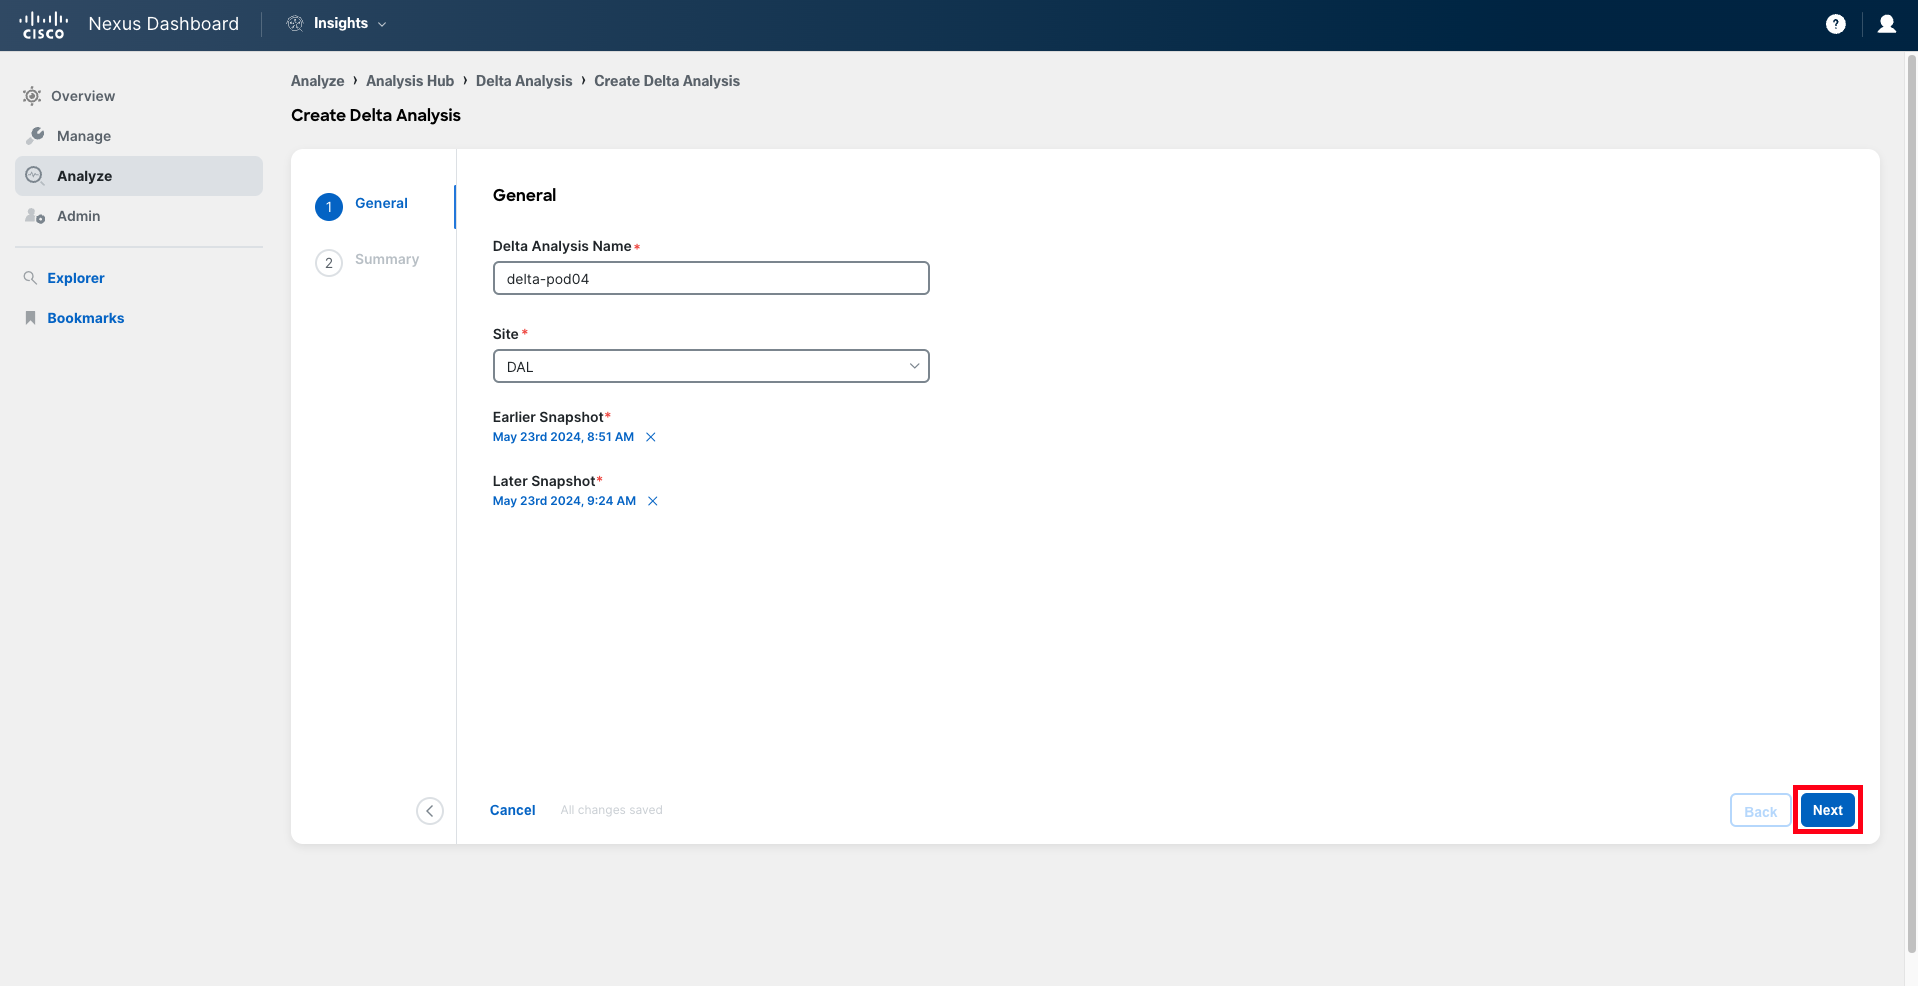
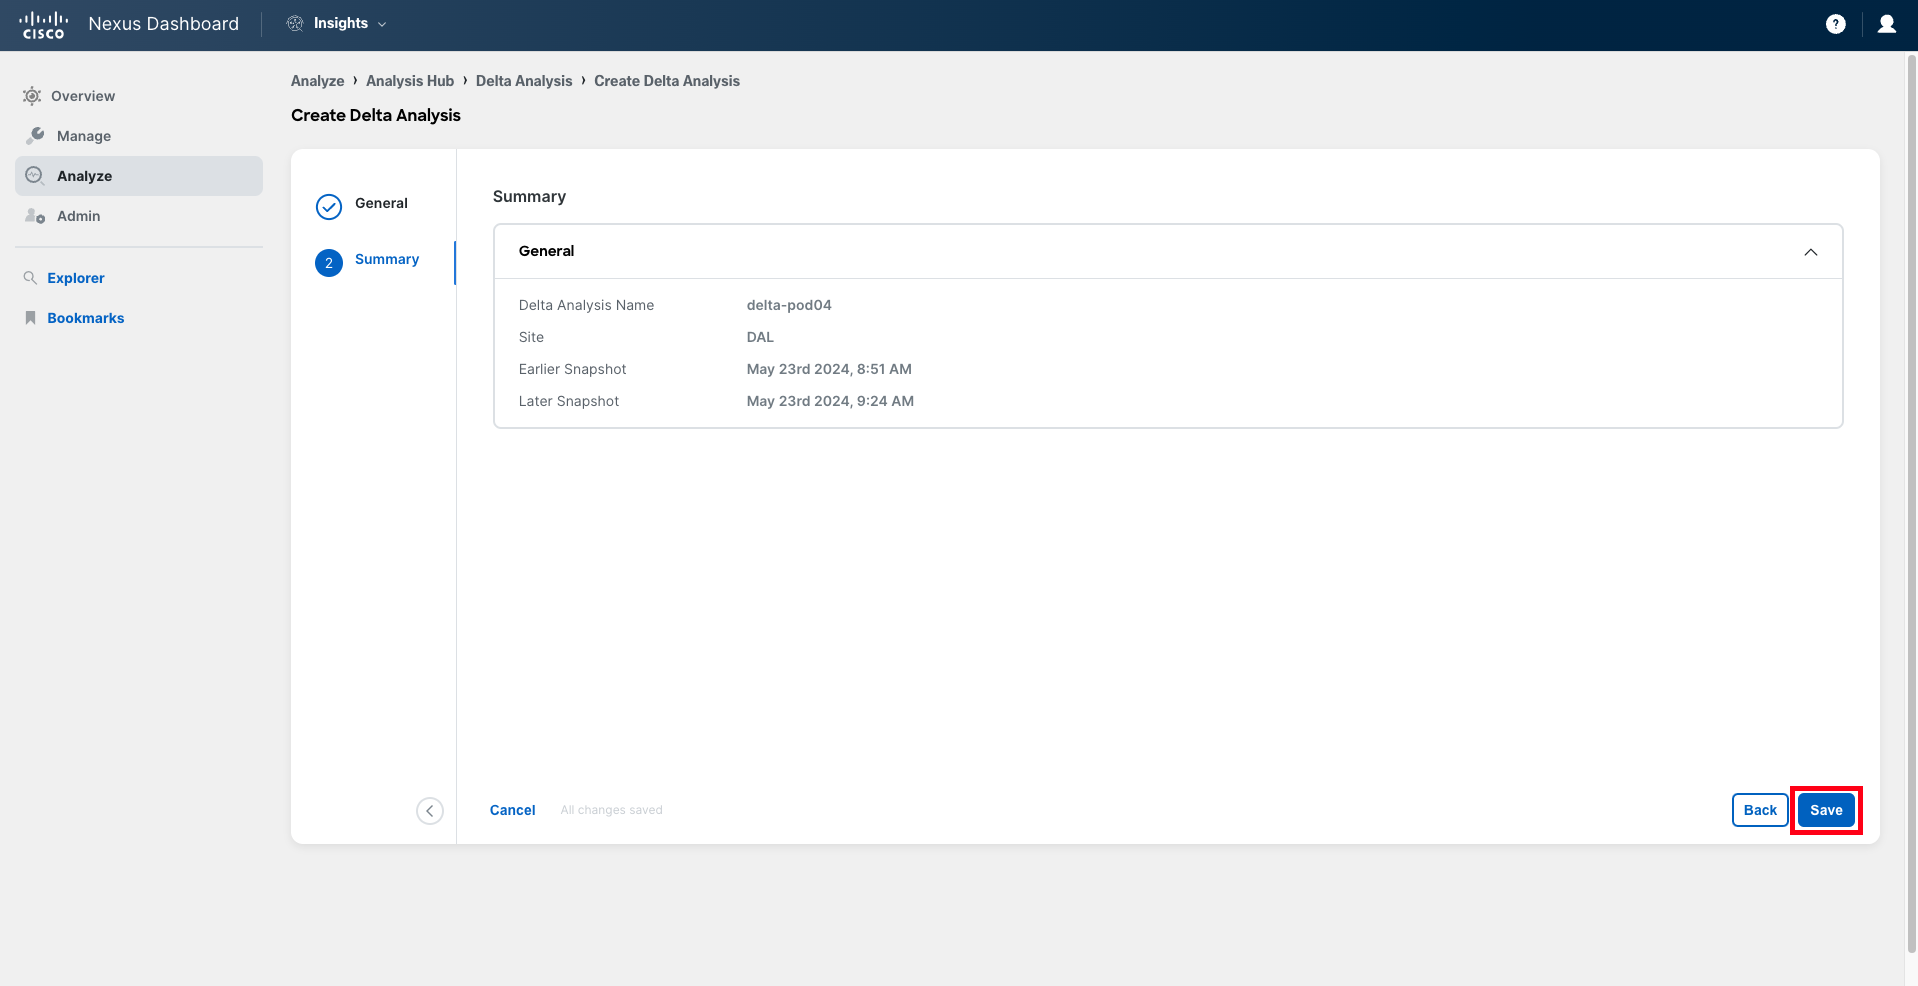
Click Next, review the details, and then click Save to initiate the job.
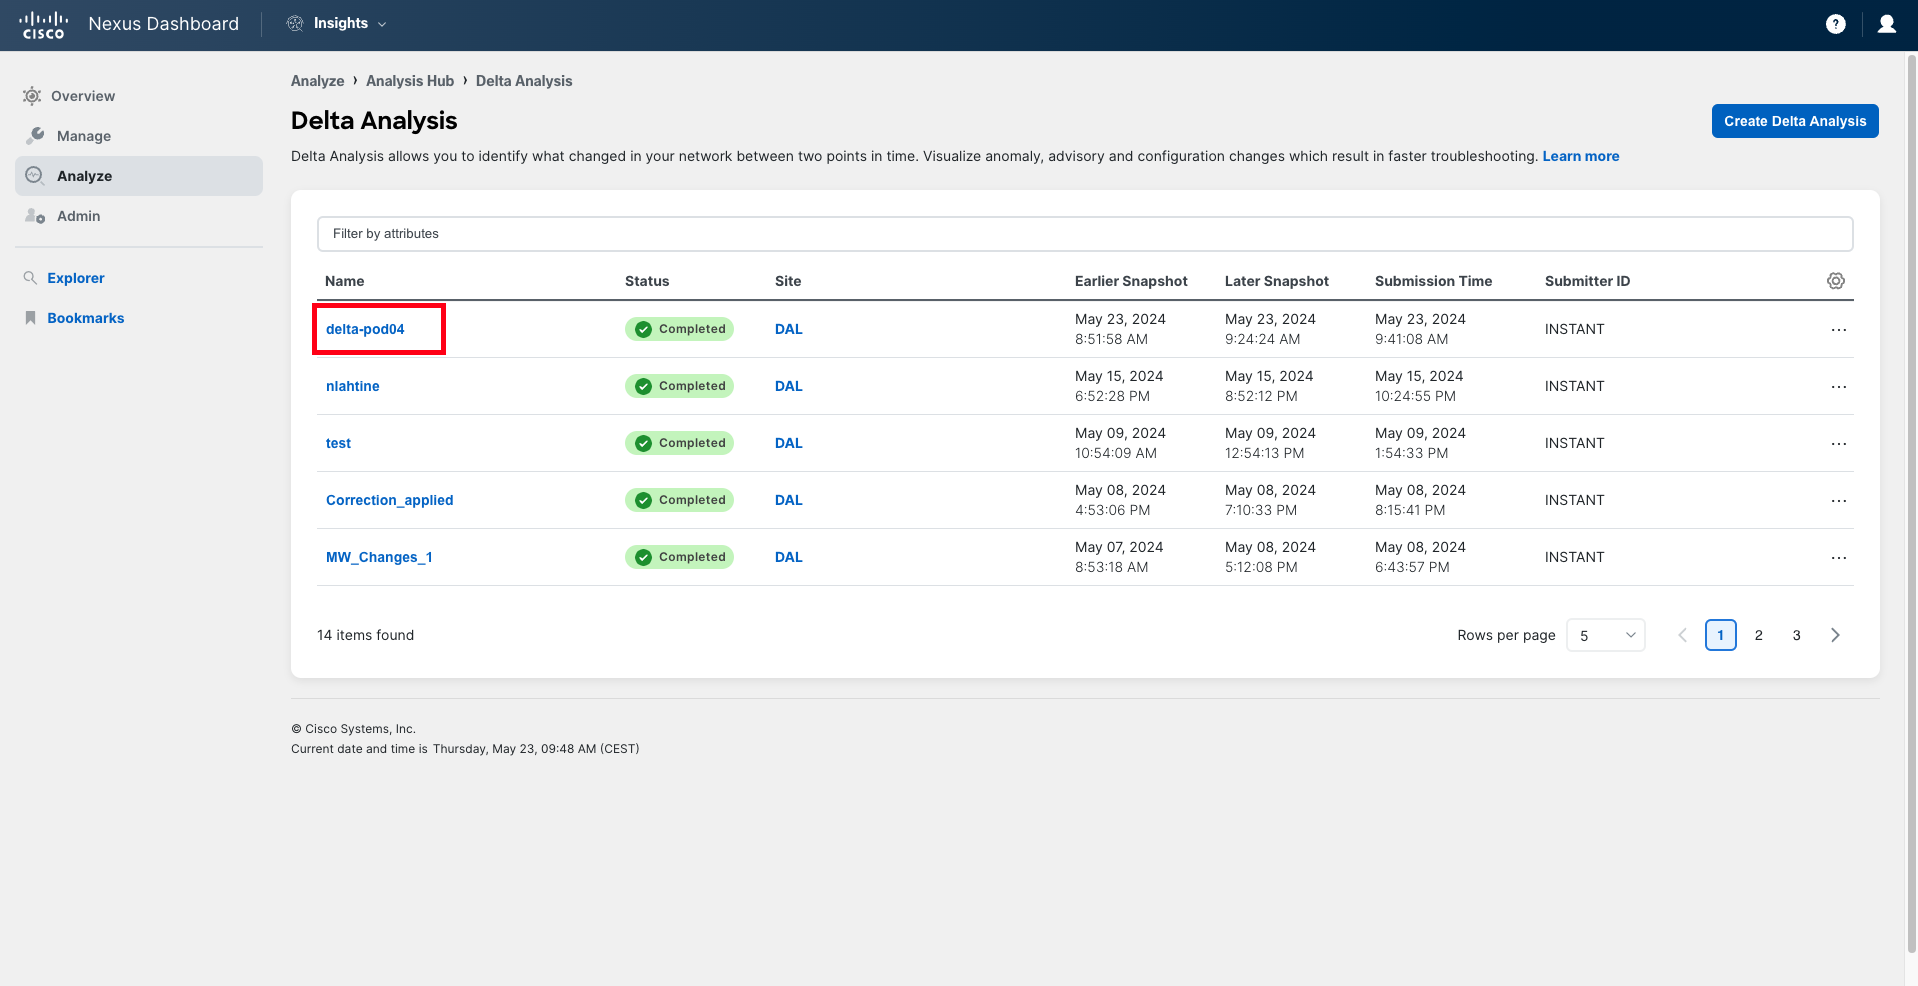
The delta analysis is now running. It takes around 2-5 minutes to be completed.
Step 16
Once the Delta Analysis is complete, click on the name to open it.
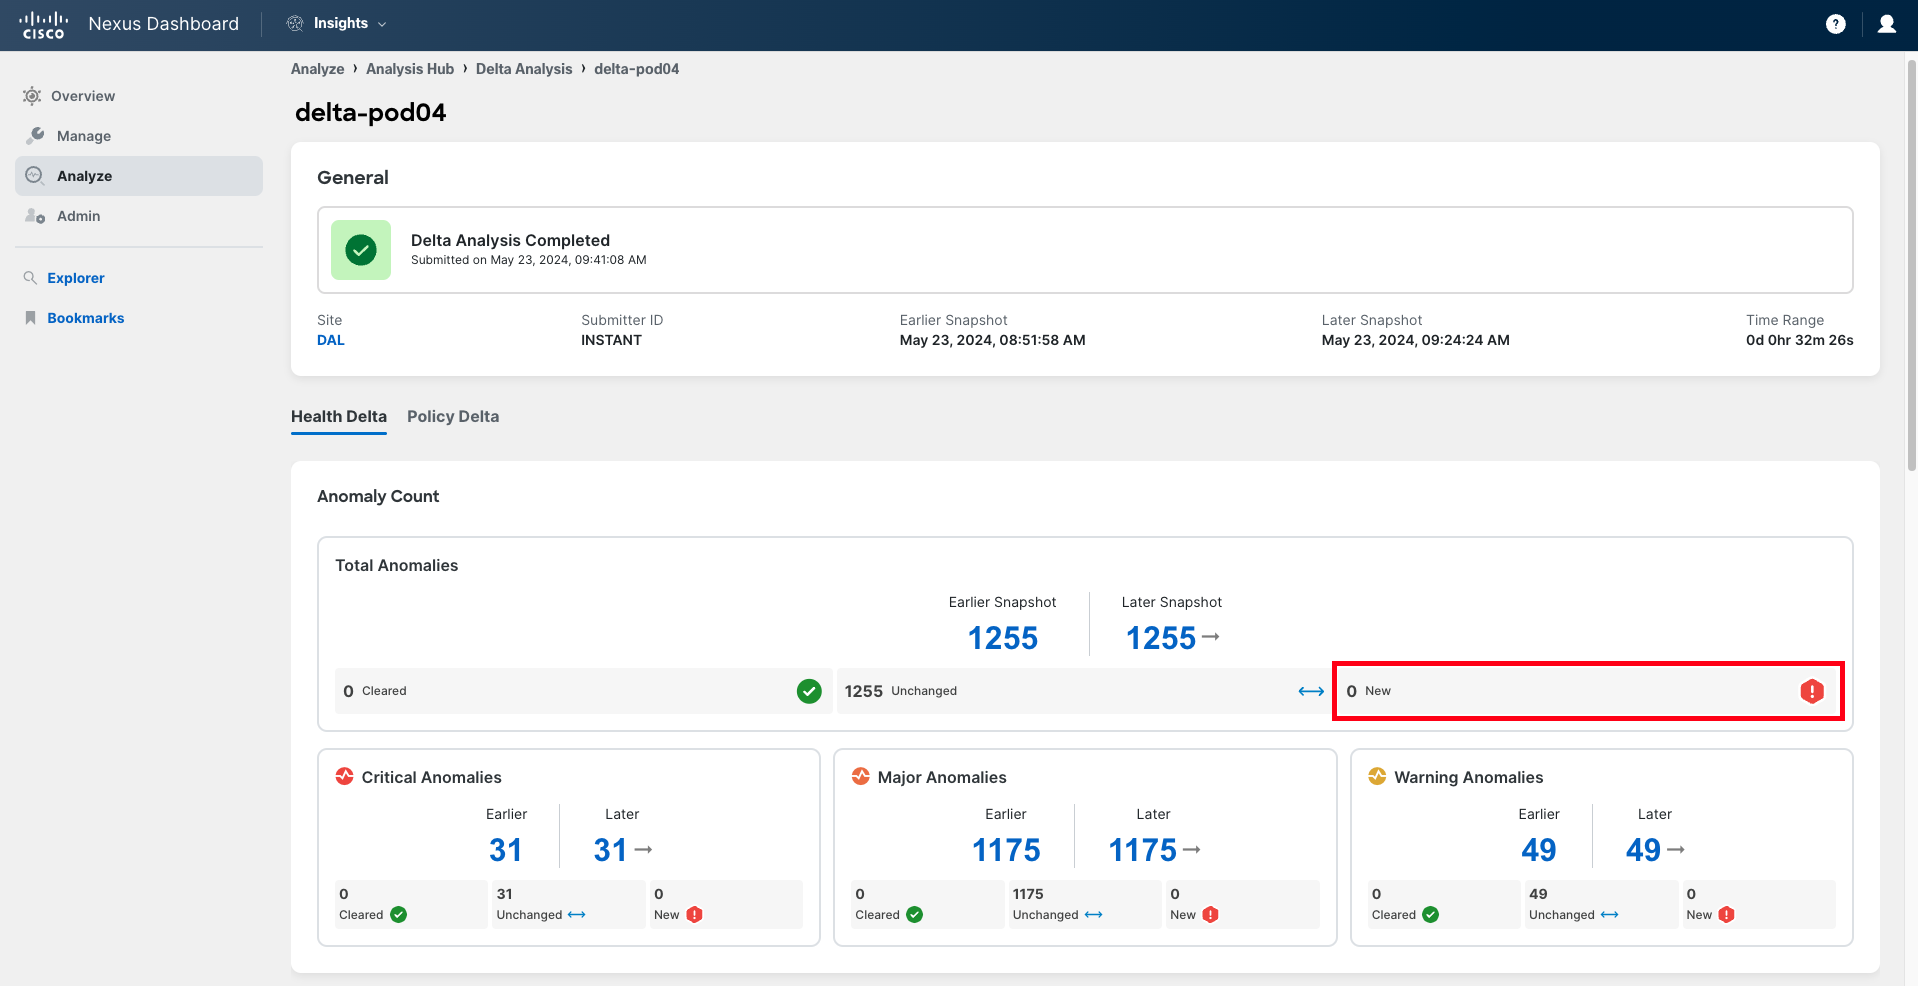
There are two main sections in the delta analysis results:
- Health Delta: It displays the anomalies and health delta between the selected snapshots.
- Policy Delta: It displays the configuration delta between the selected snapshots.
In this case, focus on the health delta.
Step 17
Navigate to Health Delta. At the top, you will find a panel similar to the one found in the Pre-Change Analysis. Verify that no new anomalies have been raised after the change. This indicates that the change has been successful and that no new anomalies have been detected following the implementation of the change.
Note
As the lab resources are shared among all participants, the delta analysis may report some new anomalies being raised. If this occurs, ensure that these anomalies are not related to resources from your pod.
Step 18
The change has been completed with minimal risk to the business. You can now proceed with the next use case.