Use-Case 8 - Firmware Update
ACI Firmware Update Analysis
The Firmware Update Analysis feature, now included in Software Management within Nexus Dashboard Insights, simplifies the process of preparing for and reviewing the impacts of fabric upgrades. Gone are the days of manual pre-upgrade checks and the risk of encountering unexpected issues before or after an upgrade. This feature conducts a comprehensive analysis of the fabric's state before and after an update, offering an easily digestible view of policy or operational changes. It can highlight modifications, discrepancies, and trends in various areas, such as policy changes, user activity, routing differences, and the introduction or resolution of issues due to the upgrade.
Scenario
Your current task is to upgrade the SFC ACI site from an older release. SFC is a smaller regional data center that hasn't received much attention lately because all recent projects were focused on the main data center, the DAL ACI fabric. However, the time has come to upgrade the SFC site to comply with the Corporate Software Policy.
Note
This use-case is one of two that involve the SFC ACI fabric. This guide will demonstrate how to perform pre-upgrade and post-upgrade analysis. However, you will not actually initiate the analysis or the upgrade. These actions require significant time and the fabric is shared among all lab participants. You will explore pre-existing analyses for both pre-upgrade and post-upgrade scenarios. The actual site upgrade was performed in the interim, mirroring a real-world process. Instructions for initiating pre-upgrade and post-upgrade analysis are provided at the end of this lab guide in a special how-to section.
Warning
Please note that some screenshots in this guide might not exactly match what you observe in Nexus Dashboard Insights during this use-case. They are provided to assist you in completing this use-case successfully. If you encounter discrepancies, it does not necessarily mean that you are in error or that the displayed information is incorrect. Should you require clarification, please do not hesitate to raise your hand and call for a lab proctor.
Solution
Step 1
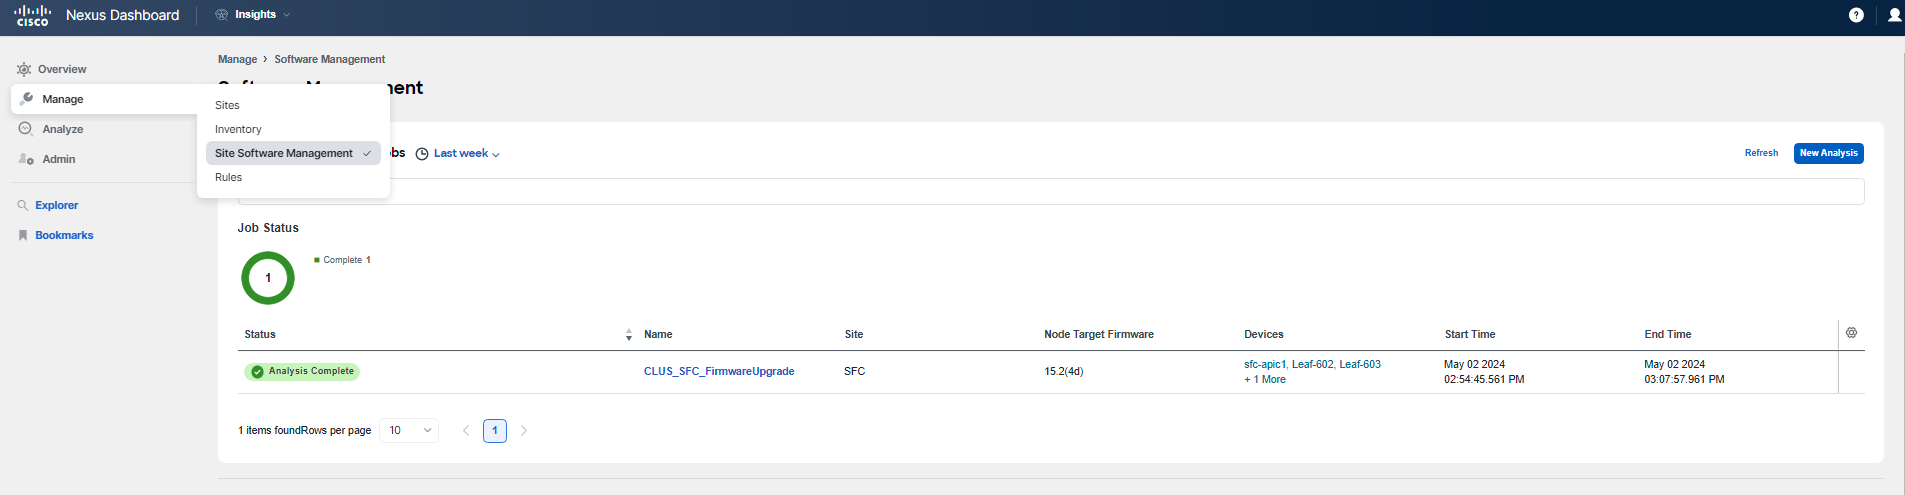
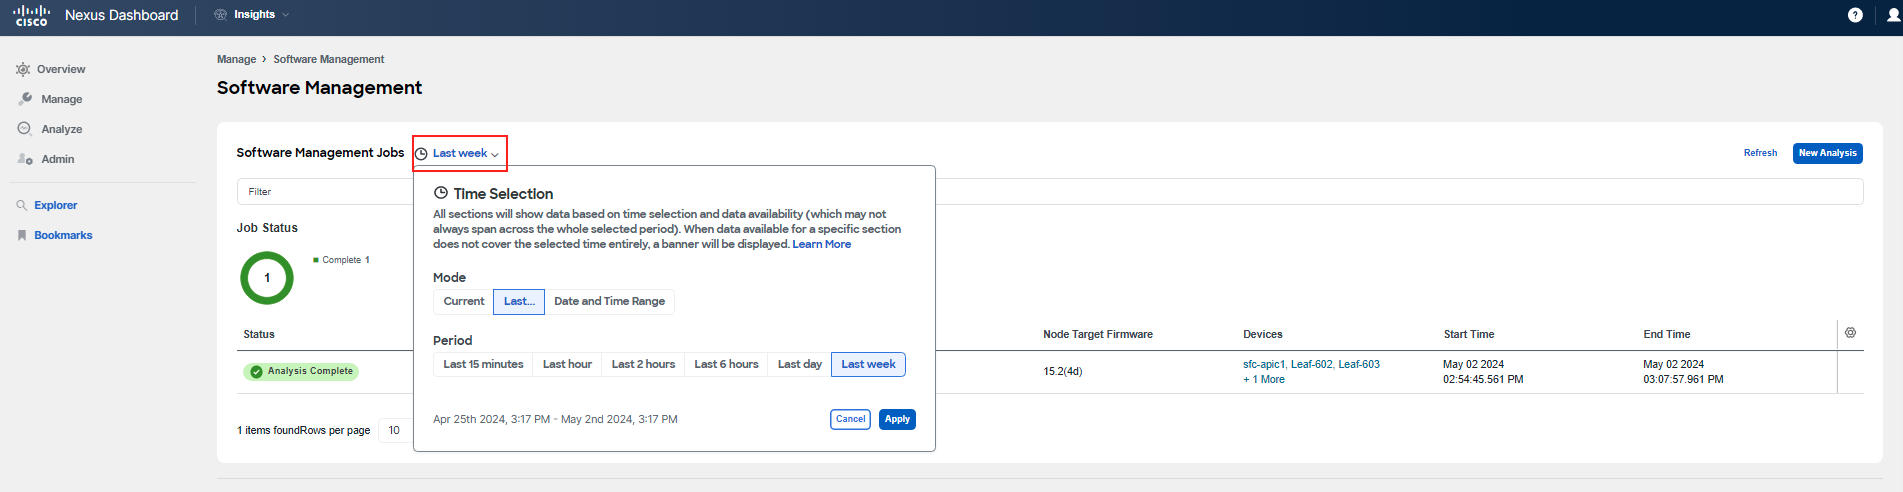
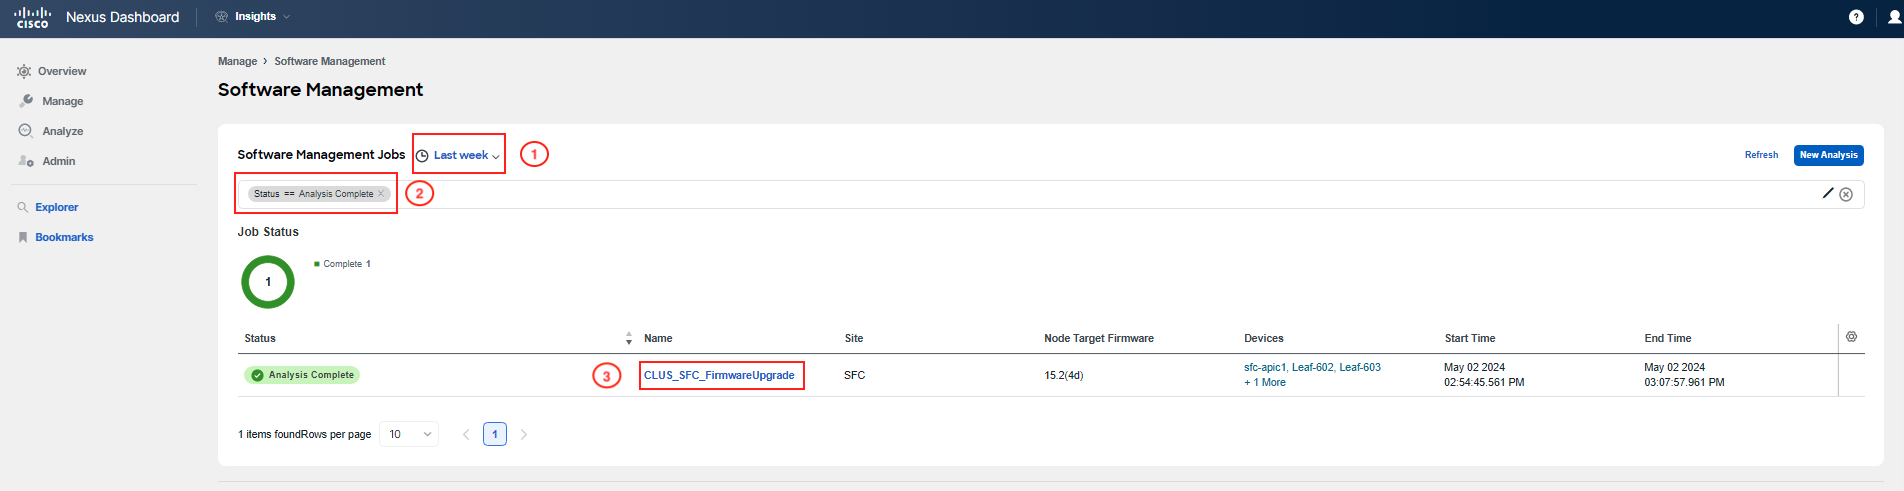
Click on Manage > Software Management to locate the completed Firmware Analysis job. You may need to adjust the time window to "Last Week" to find the specific job referenced in the below images. If there are any uncertainties or if you need assistance, please raise your hand to get help from a lab proctor.
Note
The analysis job that all participants should review is named: CLUS_SFC_FWUpgrade-Final
Step 2
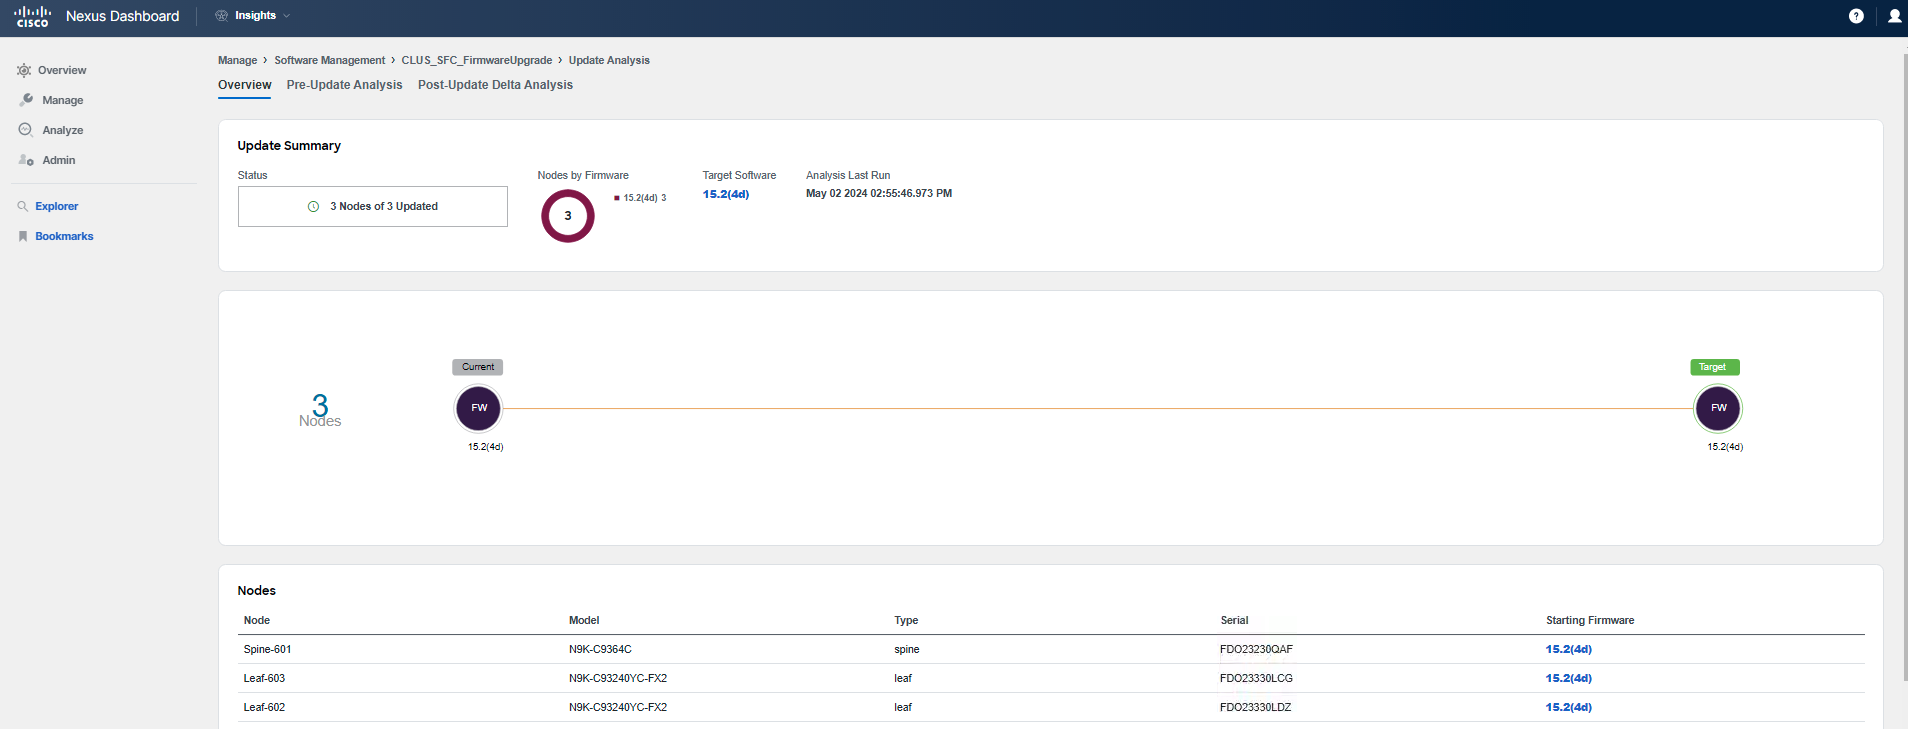
When you double-click on the completed analysis, you will be presented with a job summary. This summary will highlight key information such as the current firmware release version, the target release version to which the upgrade is planned, and the number and types of nodes involved in the upgrade. This overview provides a quick snapshot of the upgrade parameters and the scale of the operation.
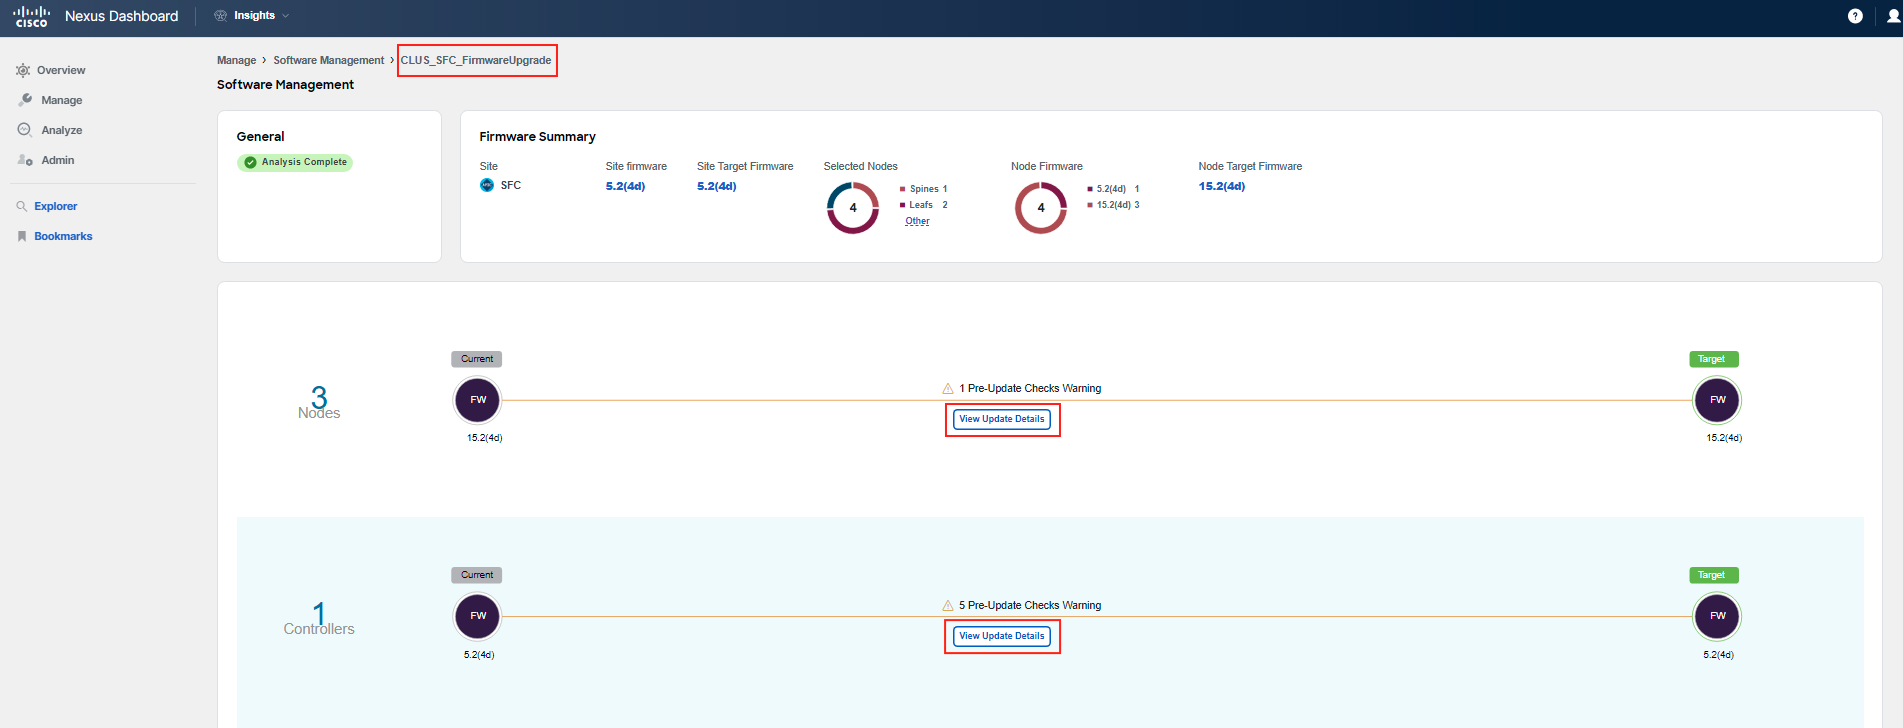
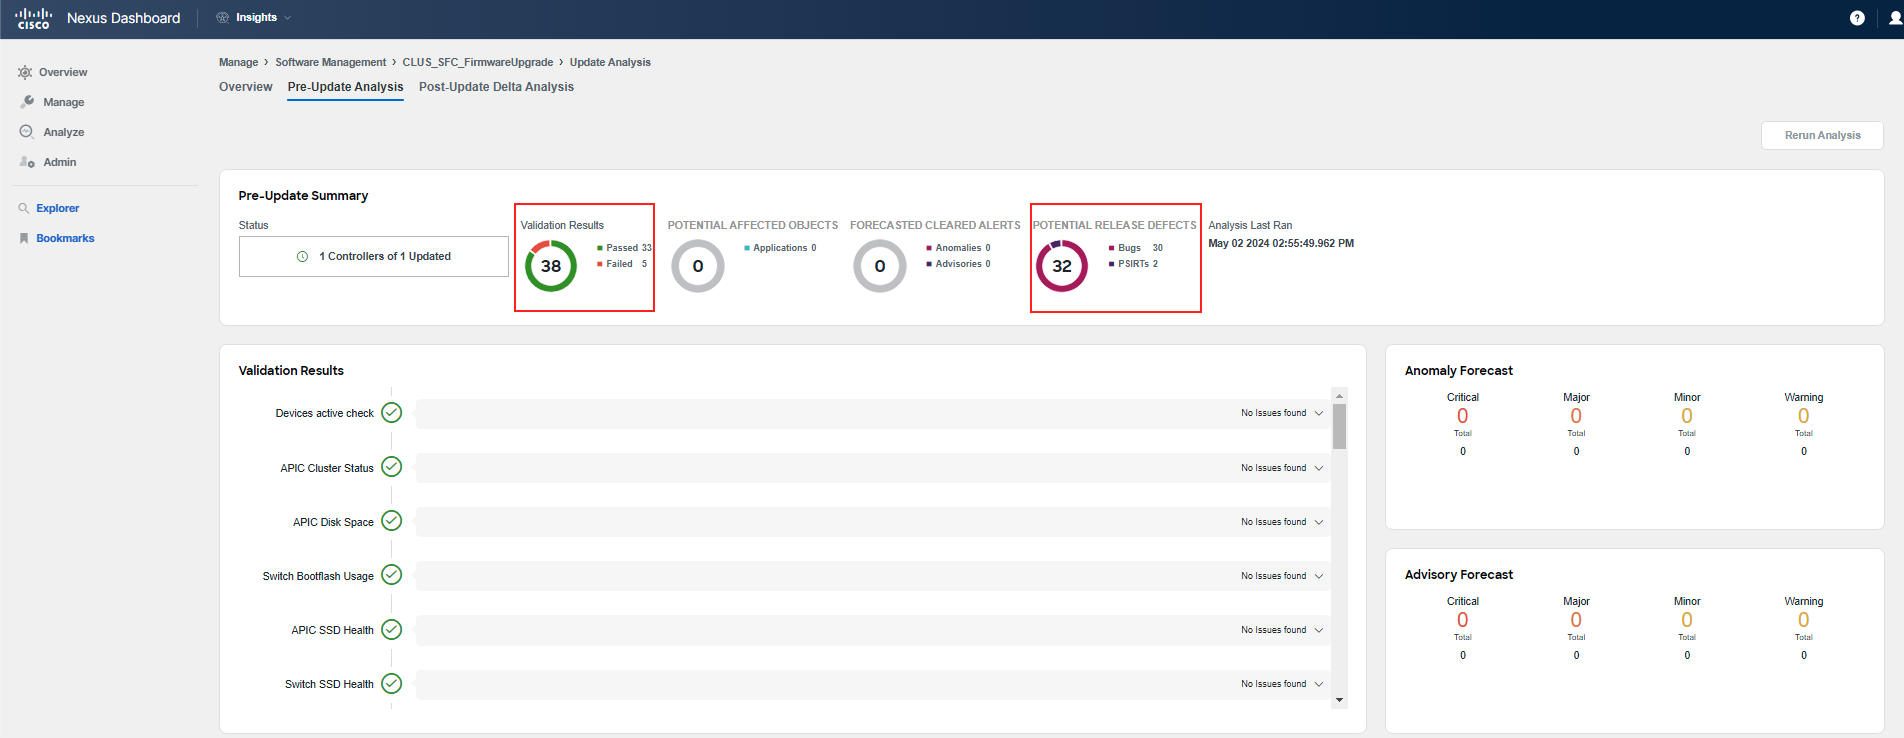
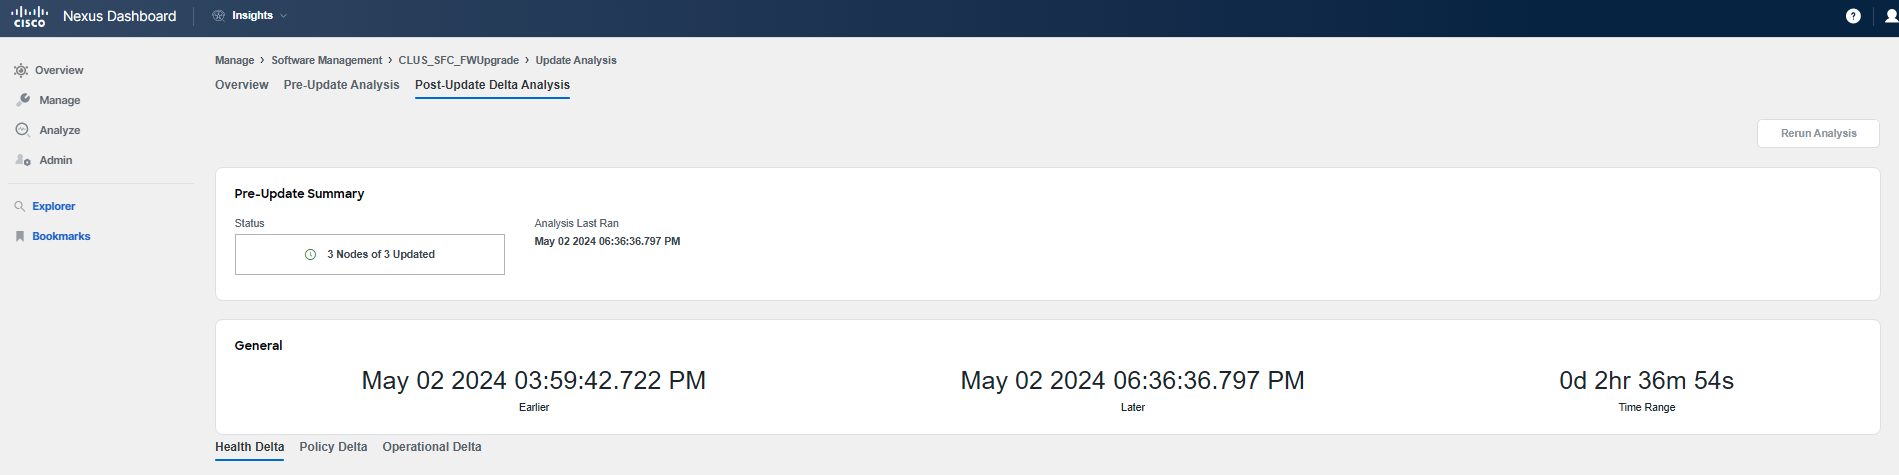
By clicking on View Update Details for the nodes within the job summary, you will be redirected to a detailed update summary for the switches in the fabric. To access the Pre-Update Analysis, which shows the state and readiness of the fabric for the upgrade, click on the second tab. This tab will provide insights into the conditions that exist prior to the upgrade and any potential issues or considerations that should be addressed before proceeding with the upgrade process.
Note
The pre-update summary indicates that all 3 nodes of the fabric have been updated. However, if you were performing this analysis before the actual upgrade, the summary would display 0 nodes updated.
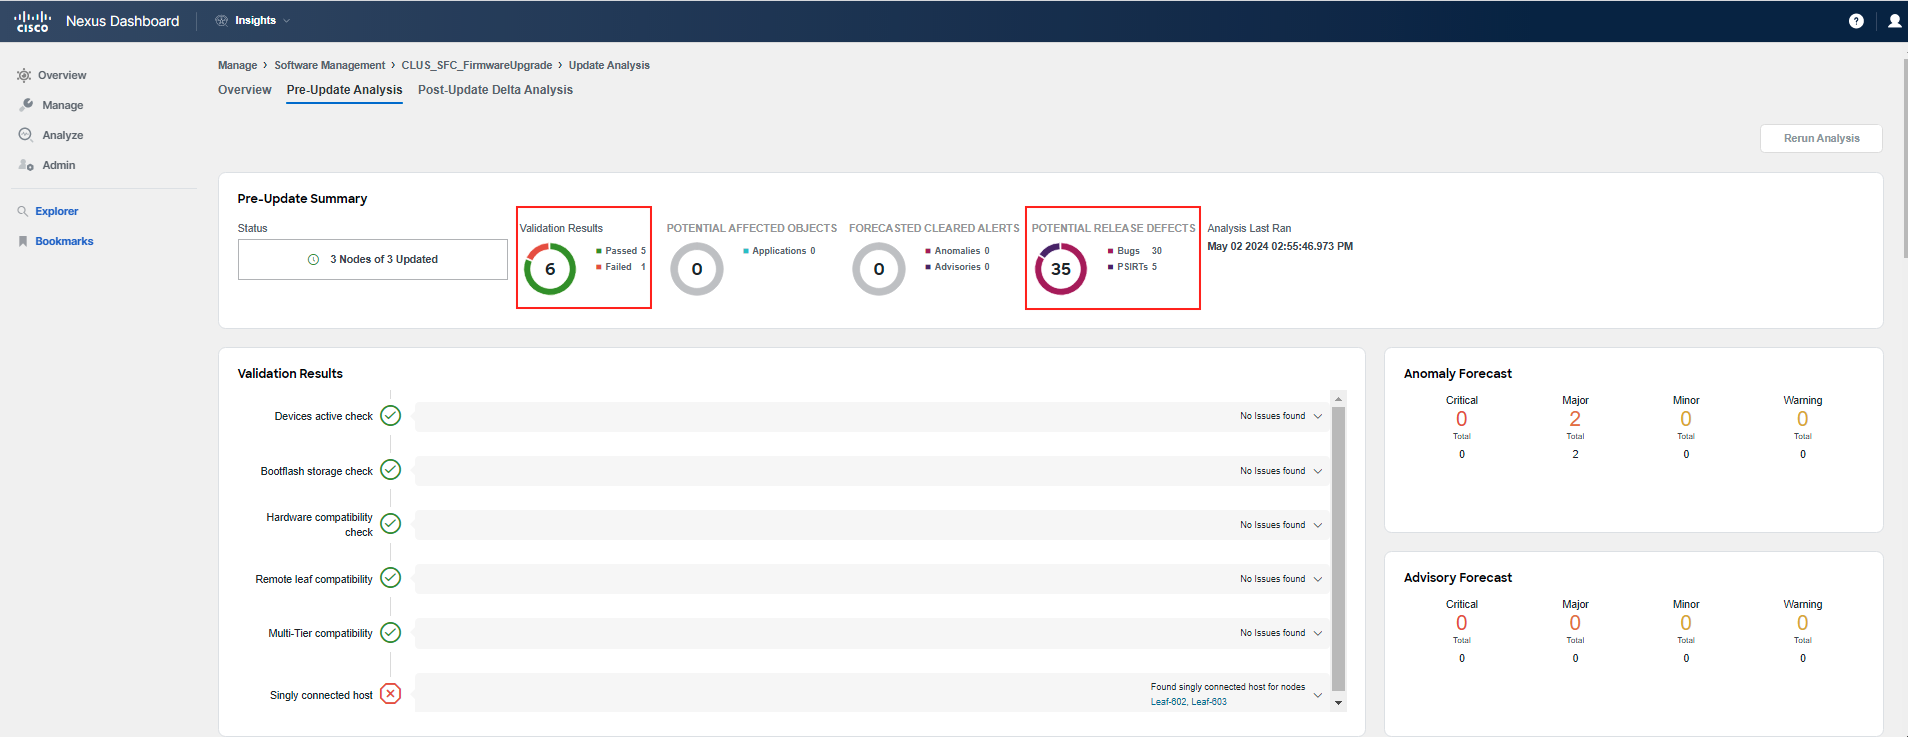
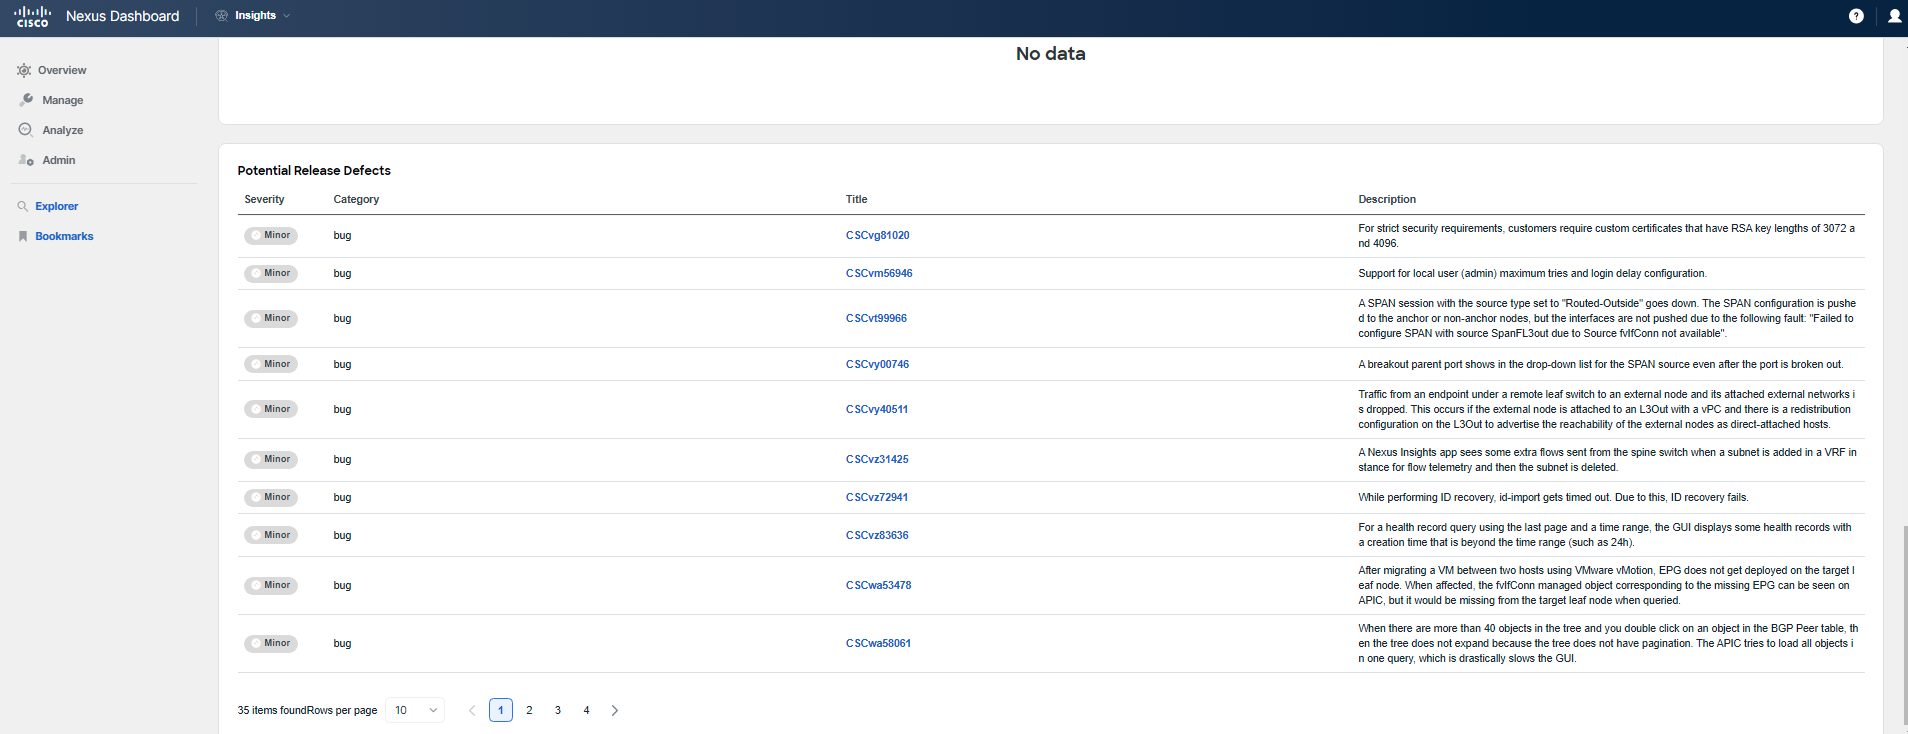
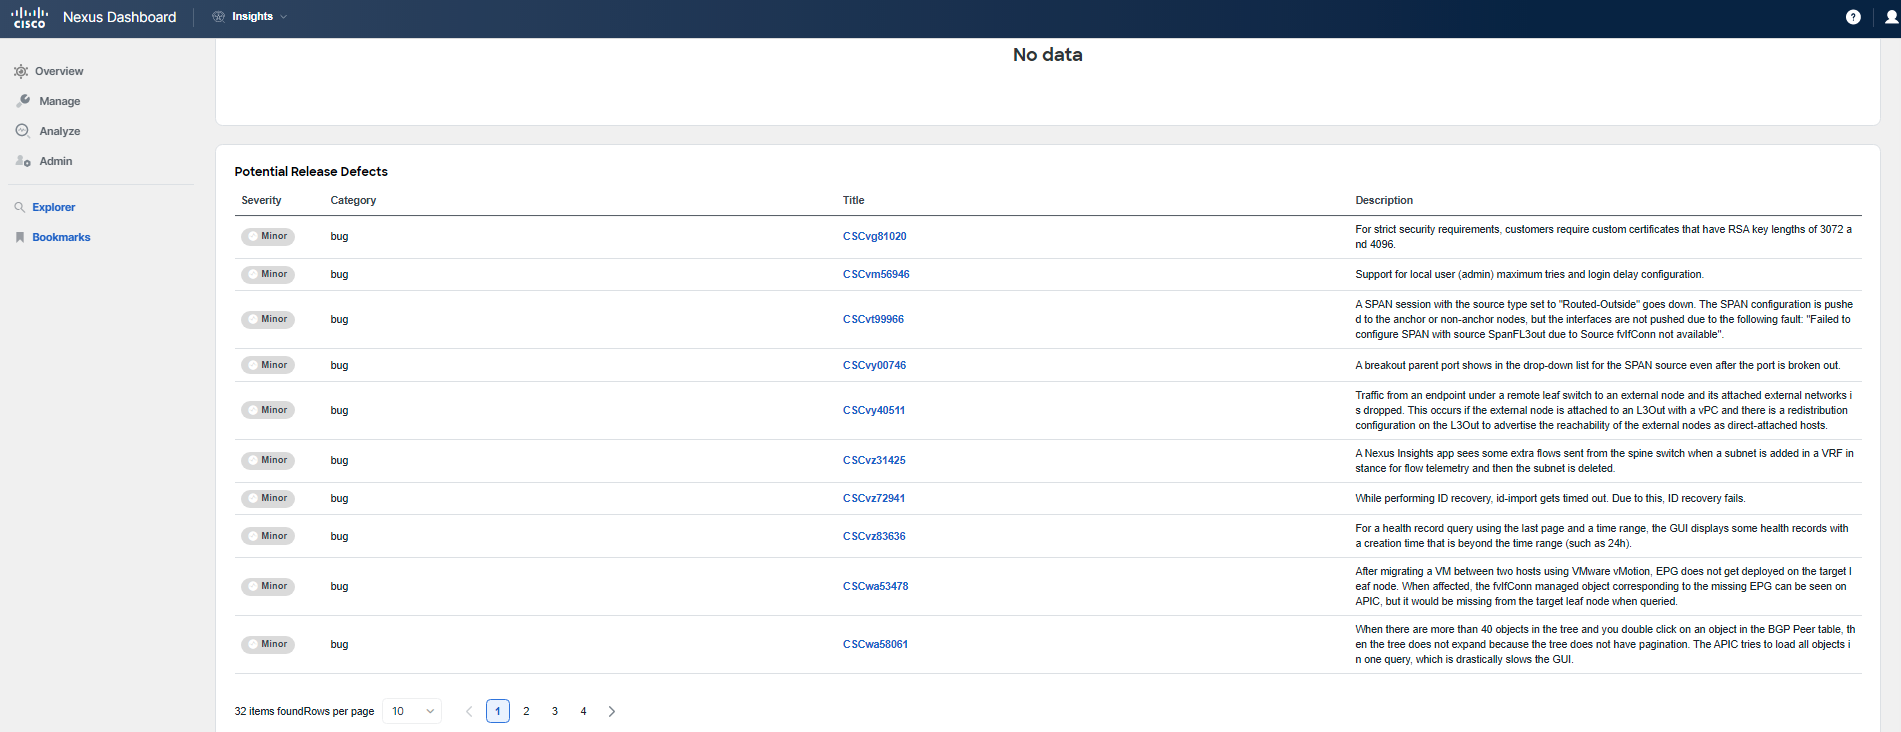
The pre-update summary provides the validation results of the pre-upgrade checks. These checks are conducted on both levels: the nodes and the controllers. Take a moment to review the pre-update summary in detail. Scroll down to see the full extent of the information the analysis provides. For instance, you will find a list of known bugs associated with the target release. It's important to explore these bugs to determine whether they would pose significant issues for your environment. Based on this information, you might decide to upgrade to a different release if you believe the known bugs could be a show-stopper for your deployment.
Step 3
To explore the controller level details, navigate back to the main analysis summary. From there, you can find the section or tab that provides an overview of the APIC controllers involved in the upgrade. This overview will give you insights into the current state of the APICs, their readiness for the upgrade, and any specific checks or considerations that pertain to the controllers themselves.
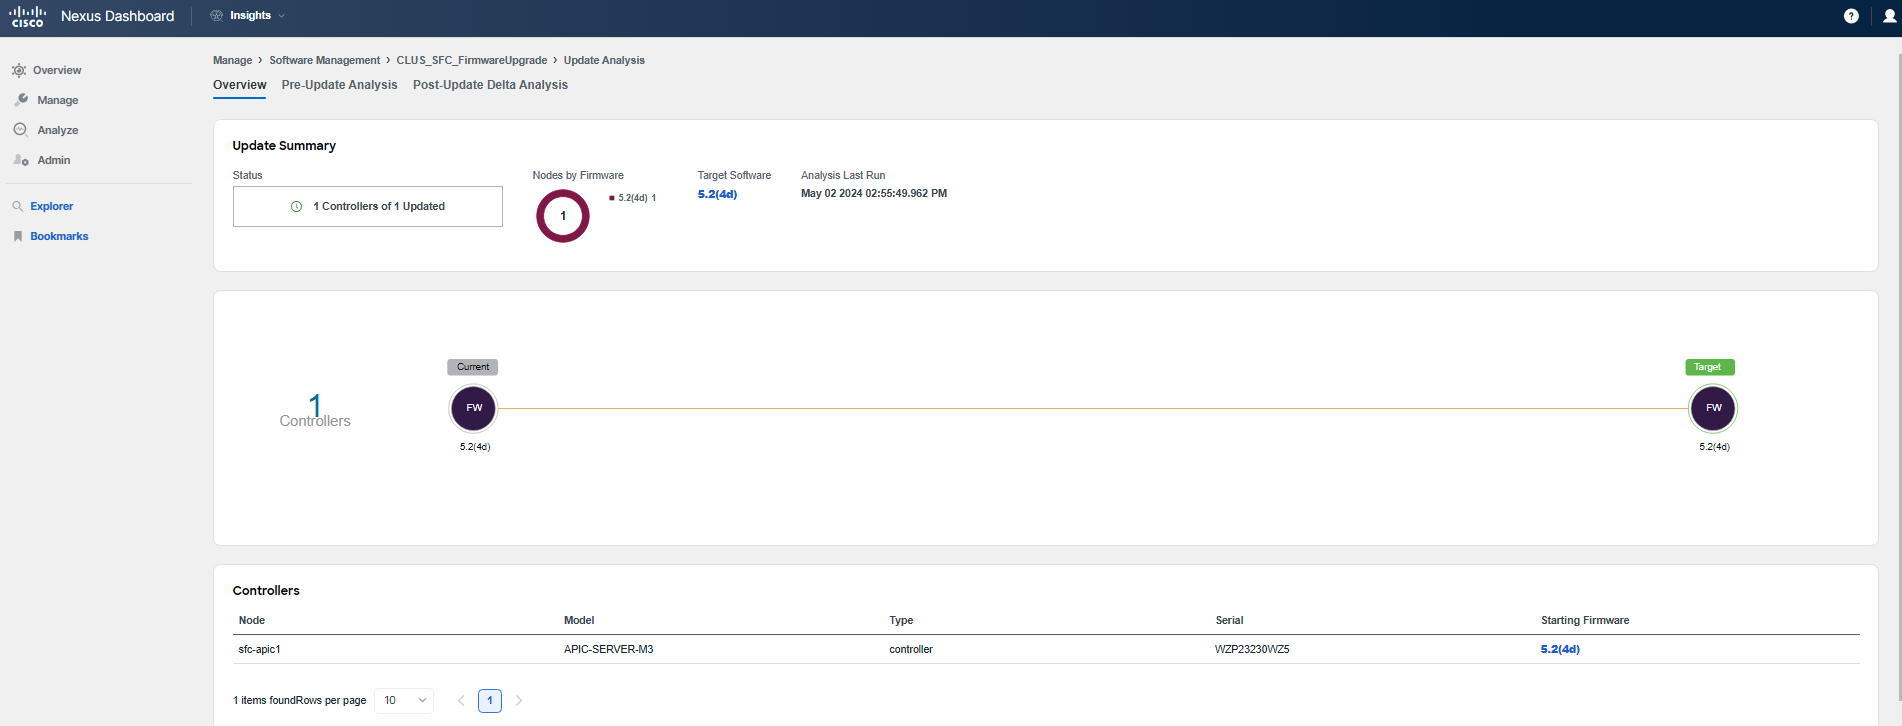
By clicking on the Pre-Update Analysis tab, you will access the controller-level details, which include the validation results of the pre-upgrade checks for the APIC cluster. This section will provide you with similar details to what you observed for the switch nodes, but specifically tailored to the APIC controllers. Take some time to explore the Pre-Update Analysis tab to understand the readiness of the APIC cluster for the upgrade and to review any potential issues or important considerations that have been identified.
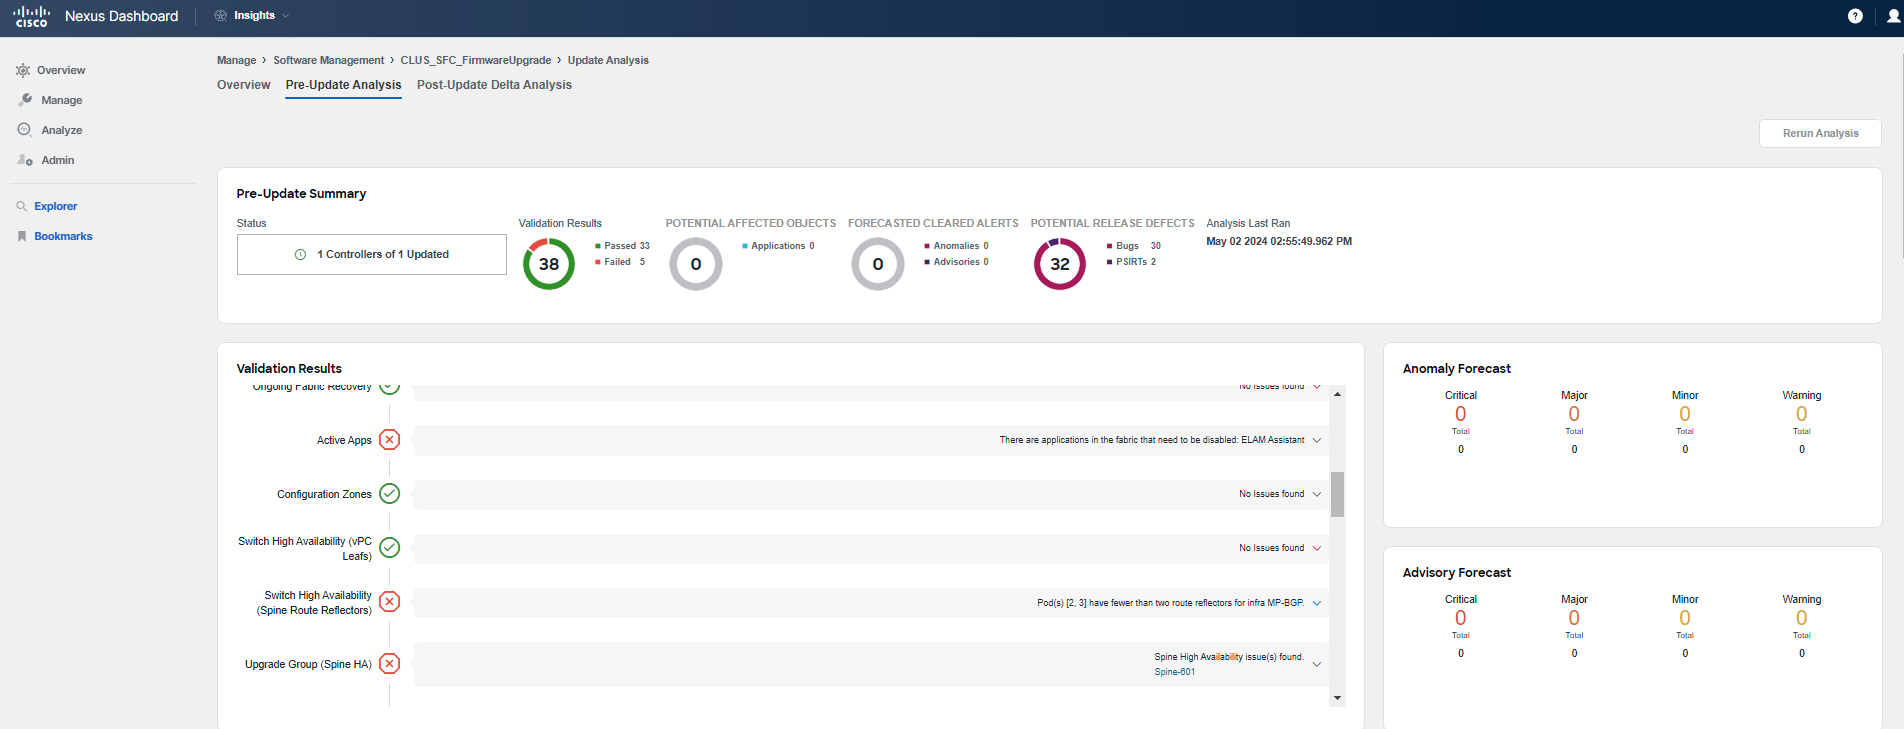
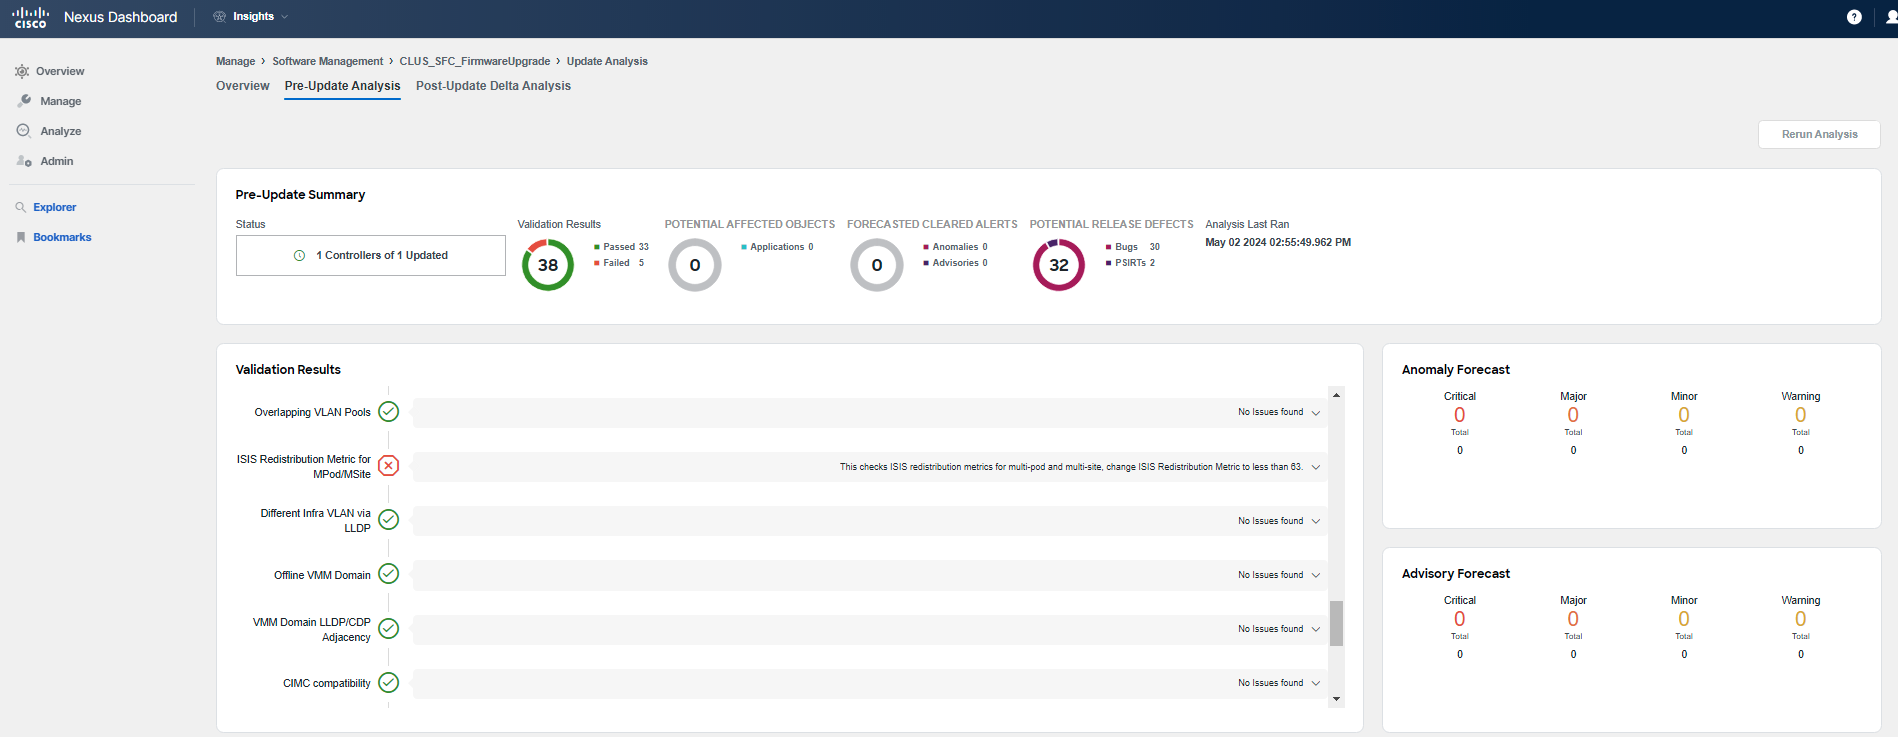
As you have observed, the APIC-level pre-upgrade checks yielded more results, which is to be expected given the critical role of the controllers. In a live production environment, you would want to address any issues flagged by these checks before proceeding with the upgrade. In the case of the SFC site, there is only one spine, which led to some specific checks failing; such a setup is not recommended for a production fabric. One notable check indicates that there are applications running on the APIC, and it is advisable to disable these applications before upgrading. After remedying any issues, it is also recommended to re-run the analysis by clicking the Rerun Analysis button to ensure all concerns have been addressed.
Note
At this juncture in a real-world scenario, you would proceed to the APIC to perform the upgrade of the controllers followed by the switches. Depending on the size of your fabric, the upgrade process for the entire ACI could span several weeks or weekends. For larger fabrics, it's prudent to run the Firmware Update Analysis for each upgrade group to ensure a smooth transition.
Step 4
Now, click on Post-Upgrade Delta Analysis to examine the state of the fabric following the upgrade. The Delta Analysis compares snapshots of the fabric's state before and after the upgrade to identify any changes.
Note
Under normal circumstances, you would need to initiate the post-upgrade analysis yourself. In this lab scenario, as previously explained, the analysis has already been conducted for you. Details on how to trigger this analysis are included in the how-to section at the end of the lab guide, which you should review once you have completed all the exercises in this lab.
The post-upgrade analysis is divided into three sections: health delta, policy delta, and operational delta (the latter being available only for the nodes analysis).
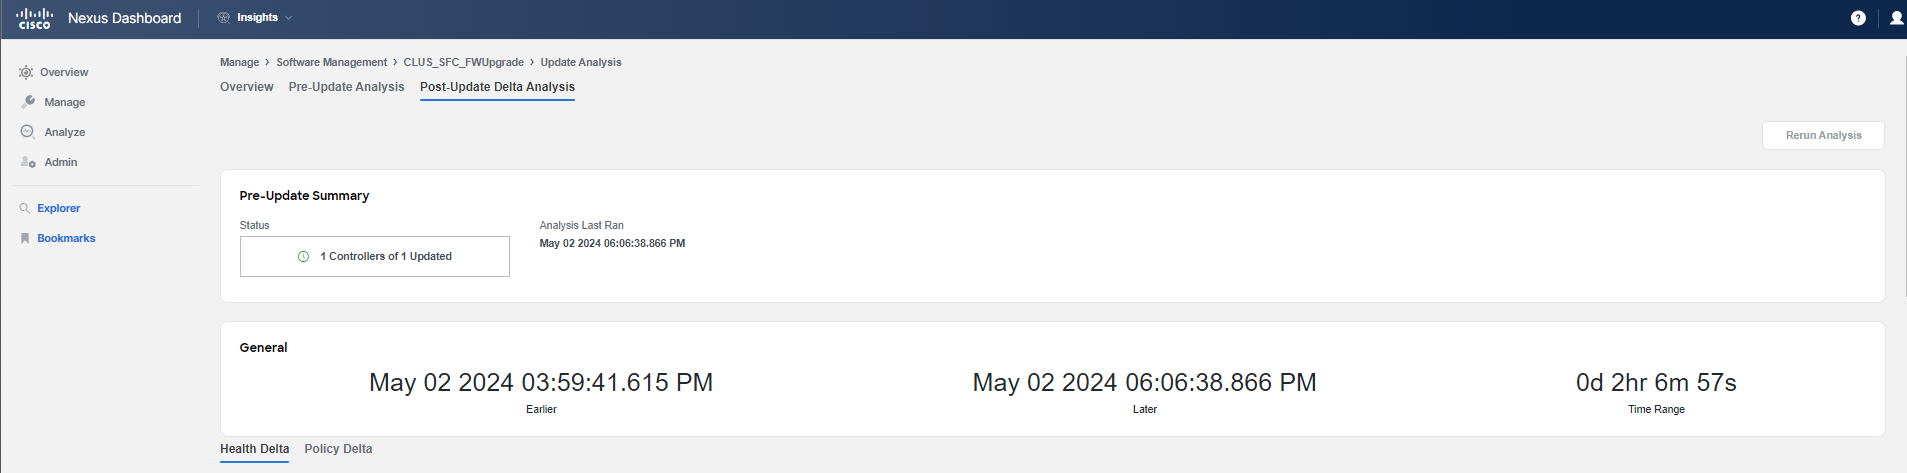
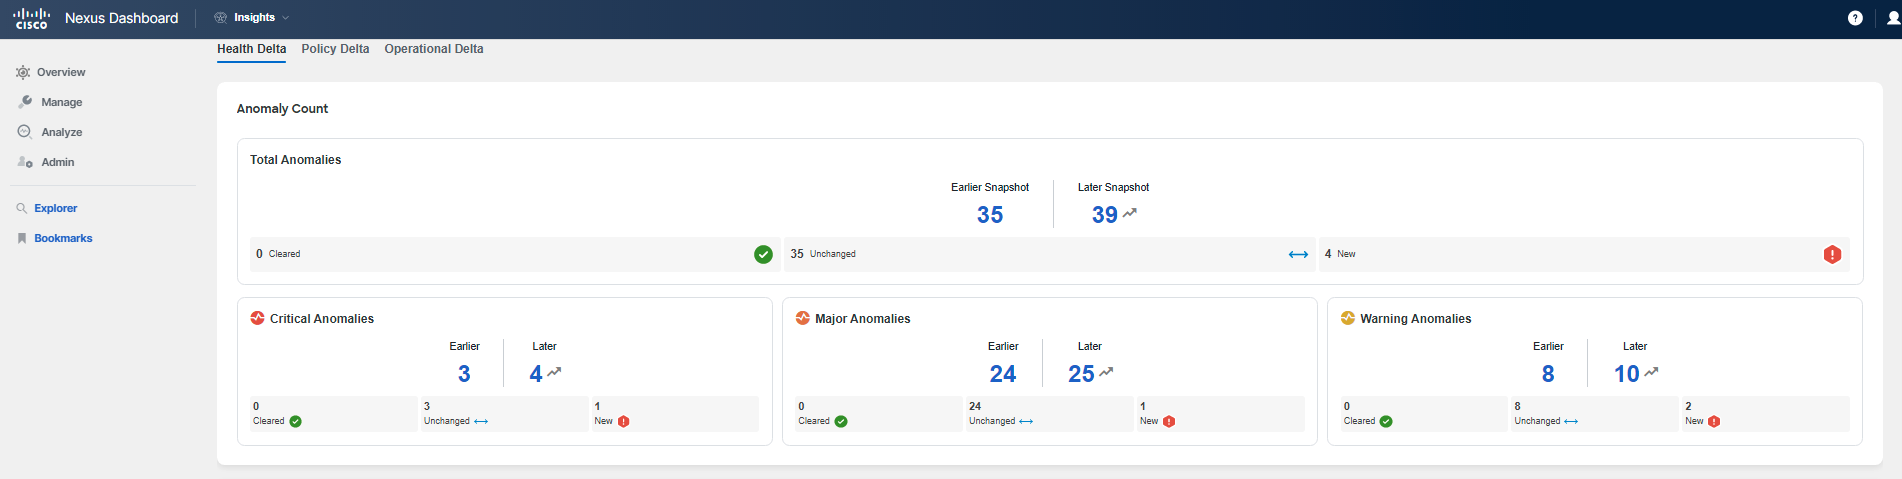
The Health Delta section of the post-upgrade analysis offers a view of the trends for various objects or anomalies by comparing the differences between two snapshots: one taken before the upgrade and the other taken after. This comparison helps identify any changes that occurred during the upgrade process.
As you scroll down to review the Health Delta, you will see the trending data for anomalies and counts of ACI's managed objects, such as routes and subnets. This information is crucial as it highlights whether new anomalies emerged during the upgrade maintenance window or if existing anomalies were resolved. For a more in-depth look at these changes, you can click on the numbers provided to explore the details further.
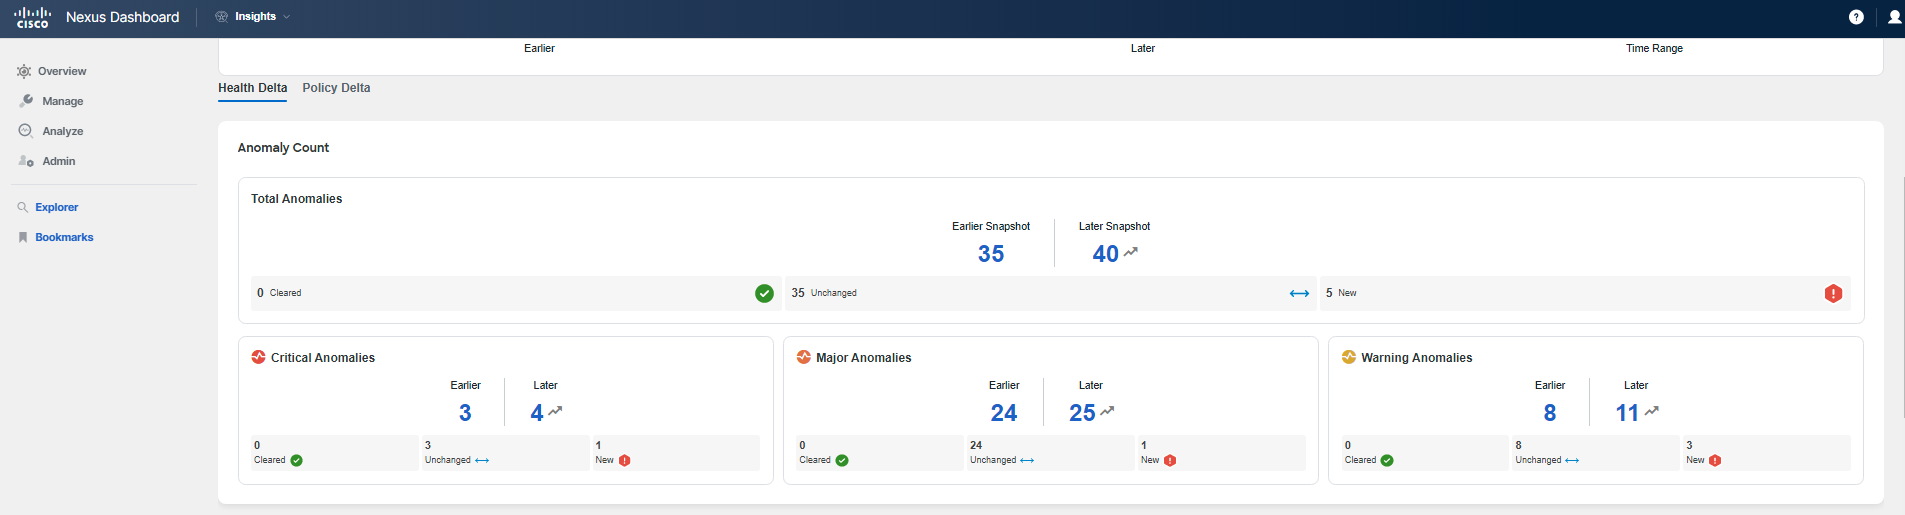
Note
It's important to recognize that to simulate the effects of changes, a few hidden actions were taken during this lab scenario, including modifications to tenant policies and adjustments that affect interfaces or VMs. You are encouraged to use this opportunity to delve into the analysis and attempt to uncover precisely what was altered, how the changes were implemented, who made them, and the operational state of the fabric after these modifications. The upcoming screenshots will provide some guidance. While it is not necessary to identify every single change to complete this lab successfully, at a minimum, you should explore the capabilities of the different post-upgrade deltas to see what insights they can reveal.
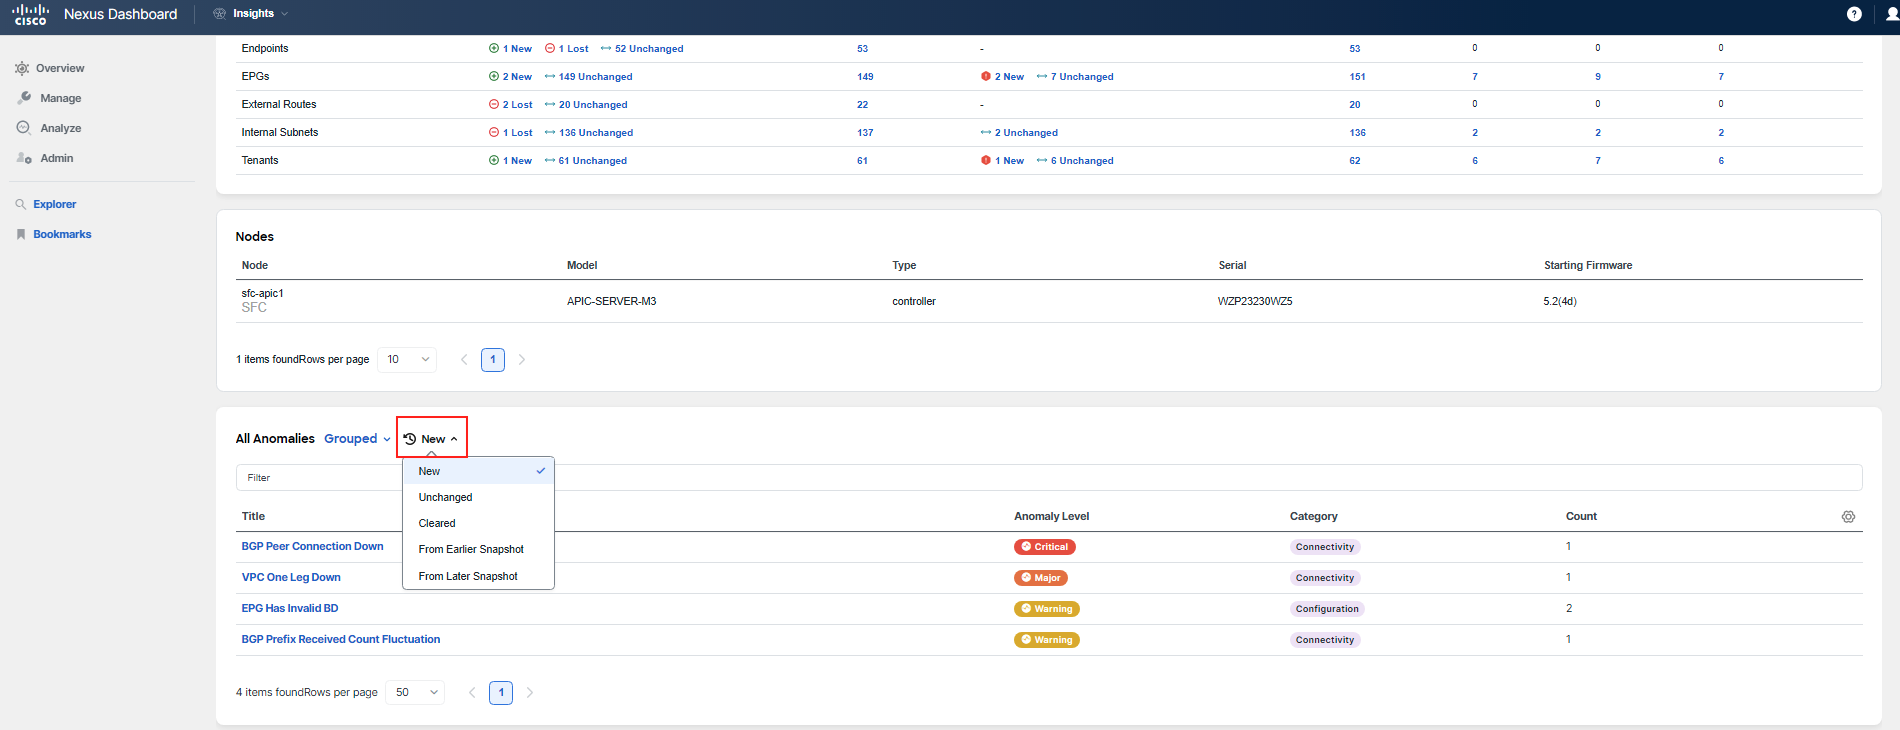
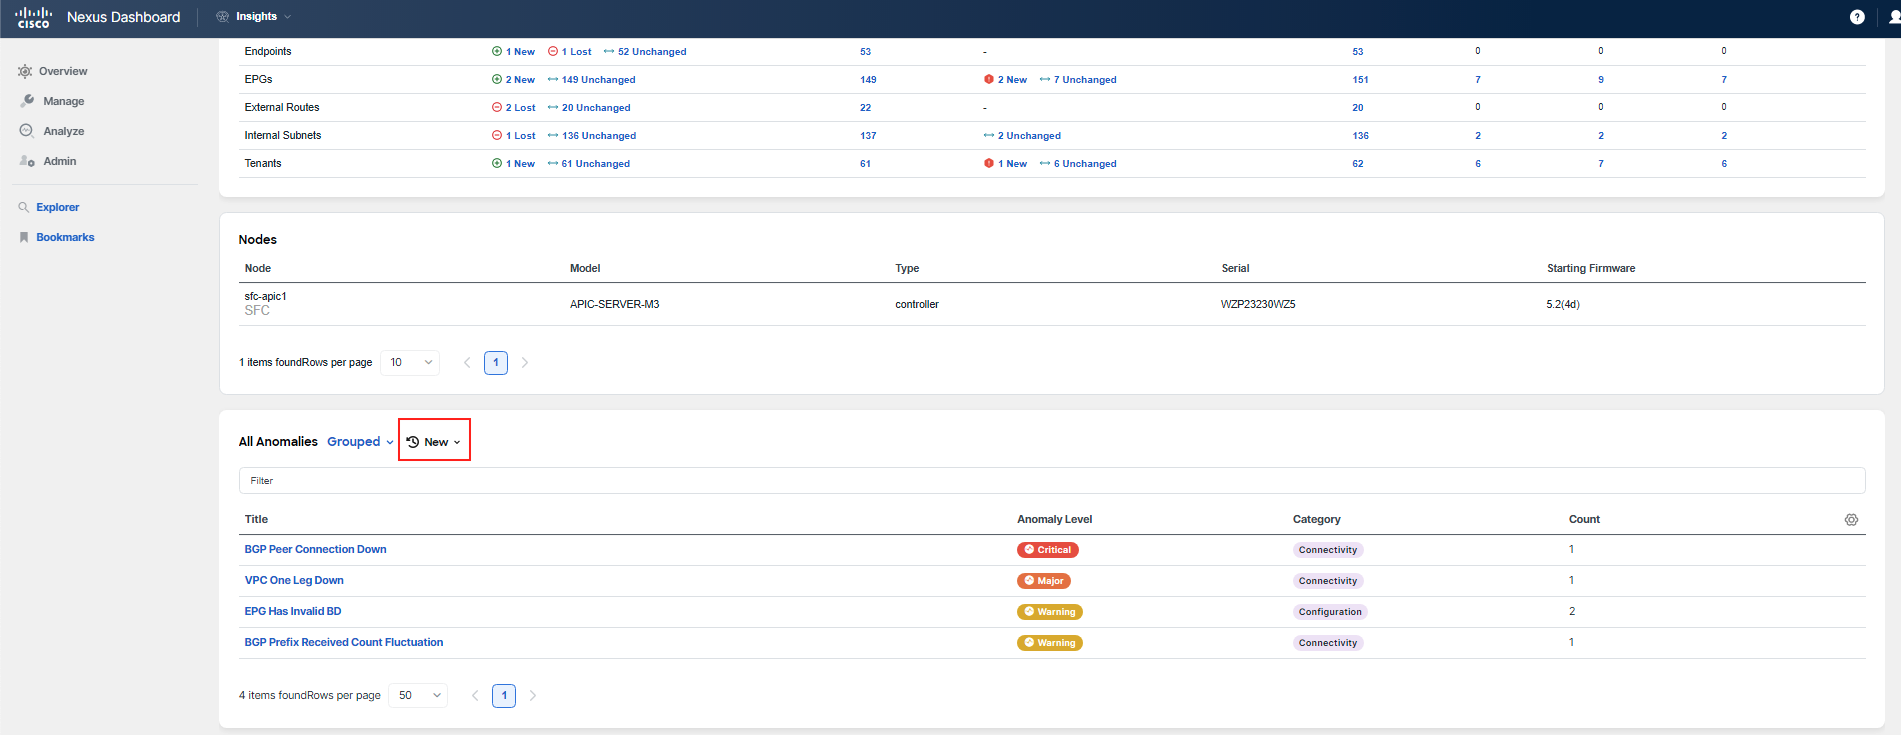
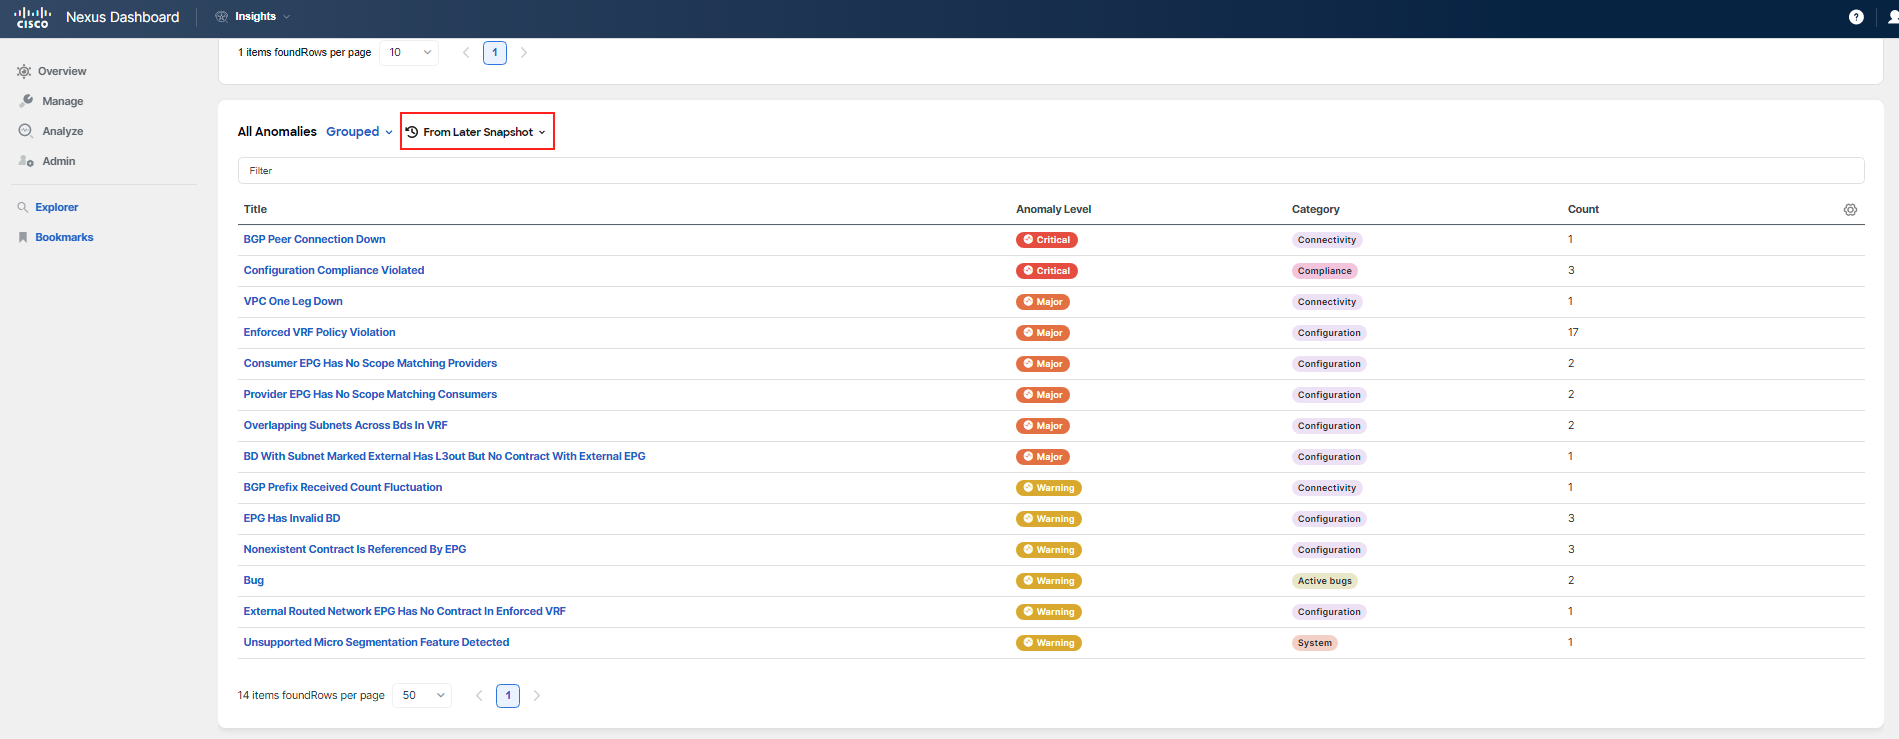
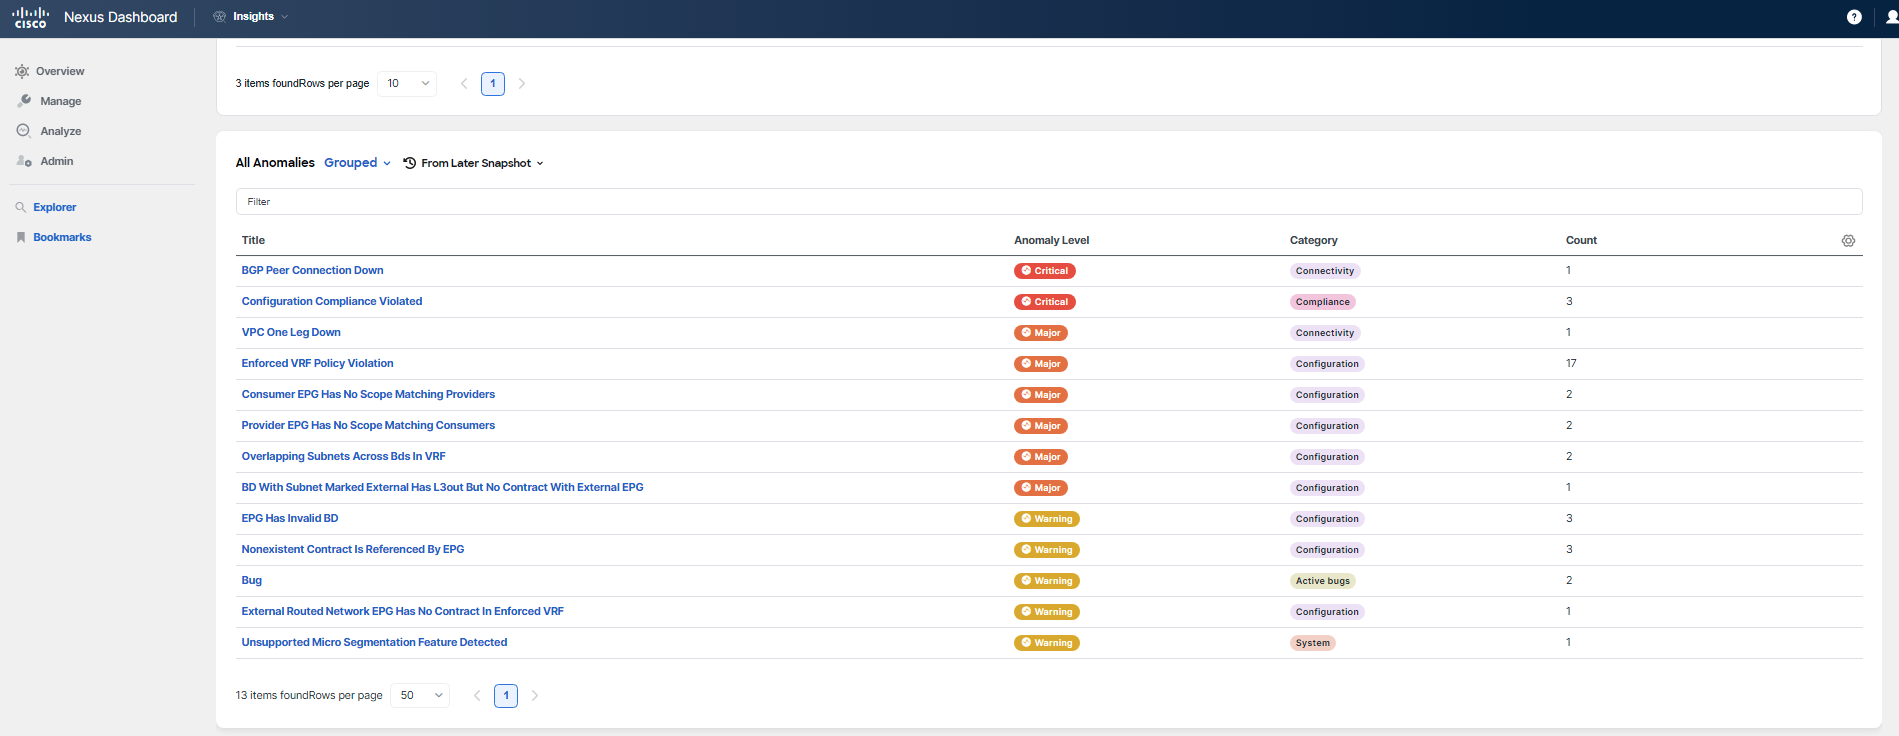
As you continue to scroll down the page, you will come across the All Anomalies section. Here, you can filter the displayed anomalies by selecting options from the drop-down menu, such as Unchanged, New, or From Later Snapshot. Choose either New or From Later Snapshot to assess which anomalies were newly introduced. This exploration will help you determine if any anomalies were raised or introduced during the upgrade process, which is vital information for assessing the upgrade's impact on the fabric's health.
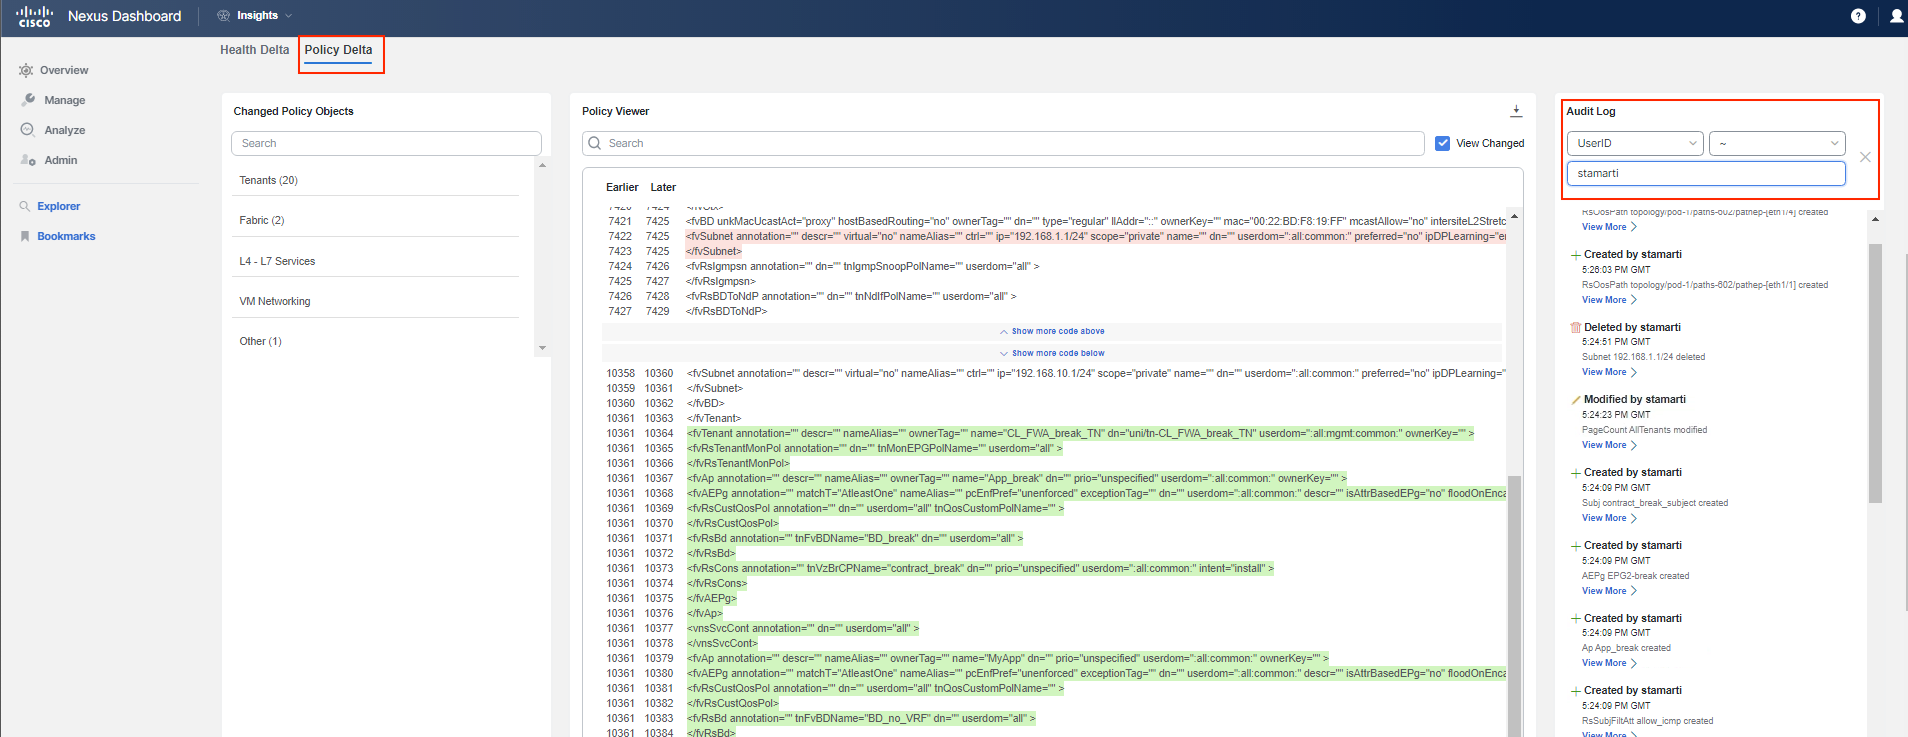
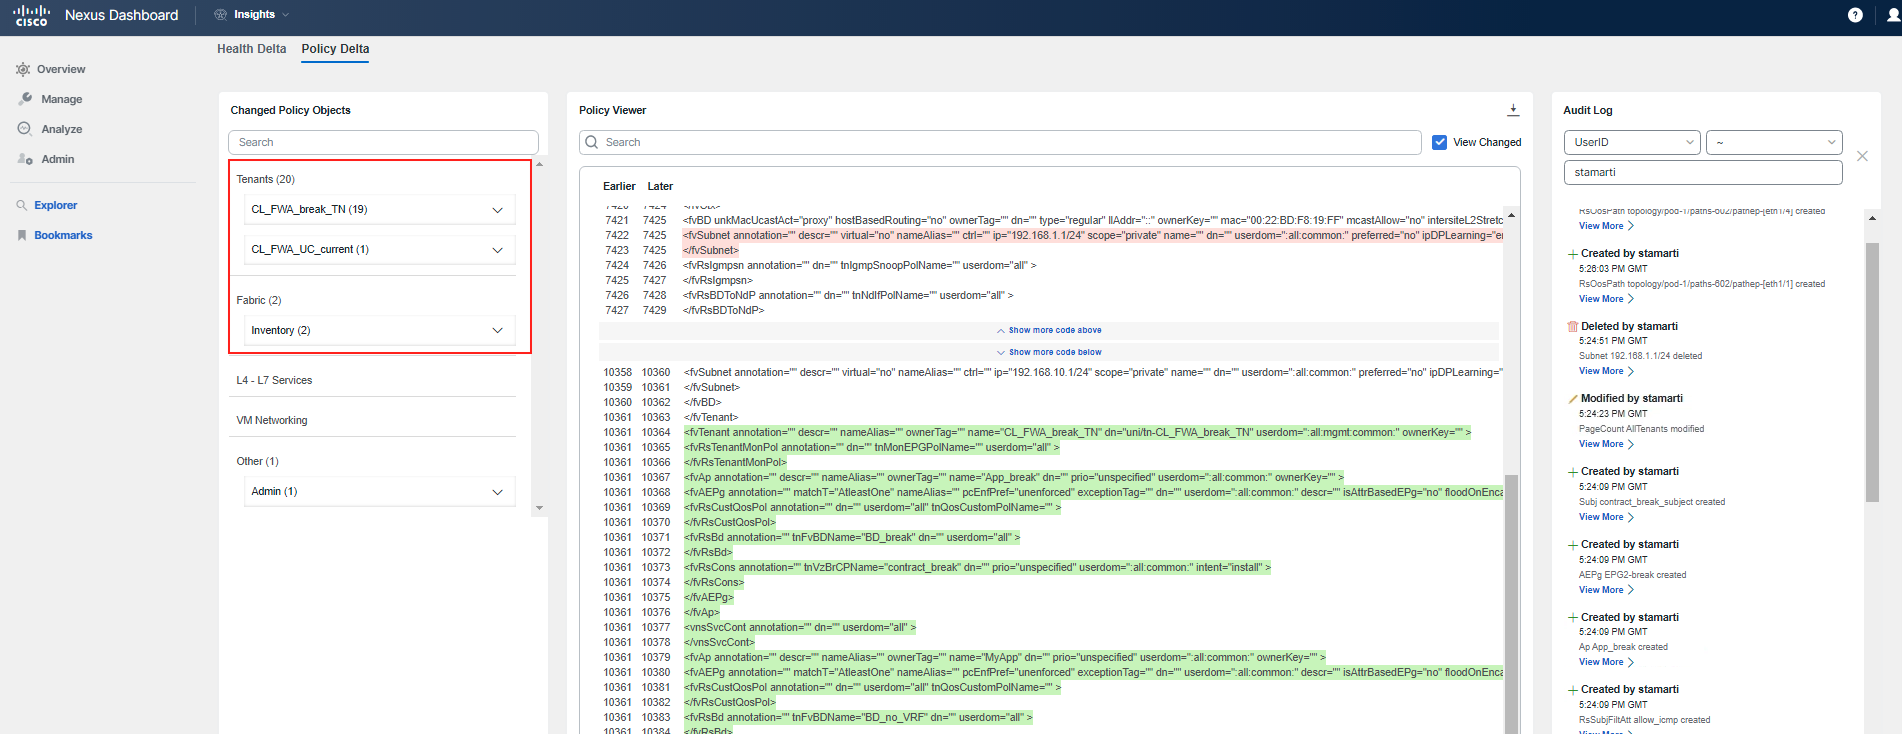
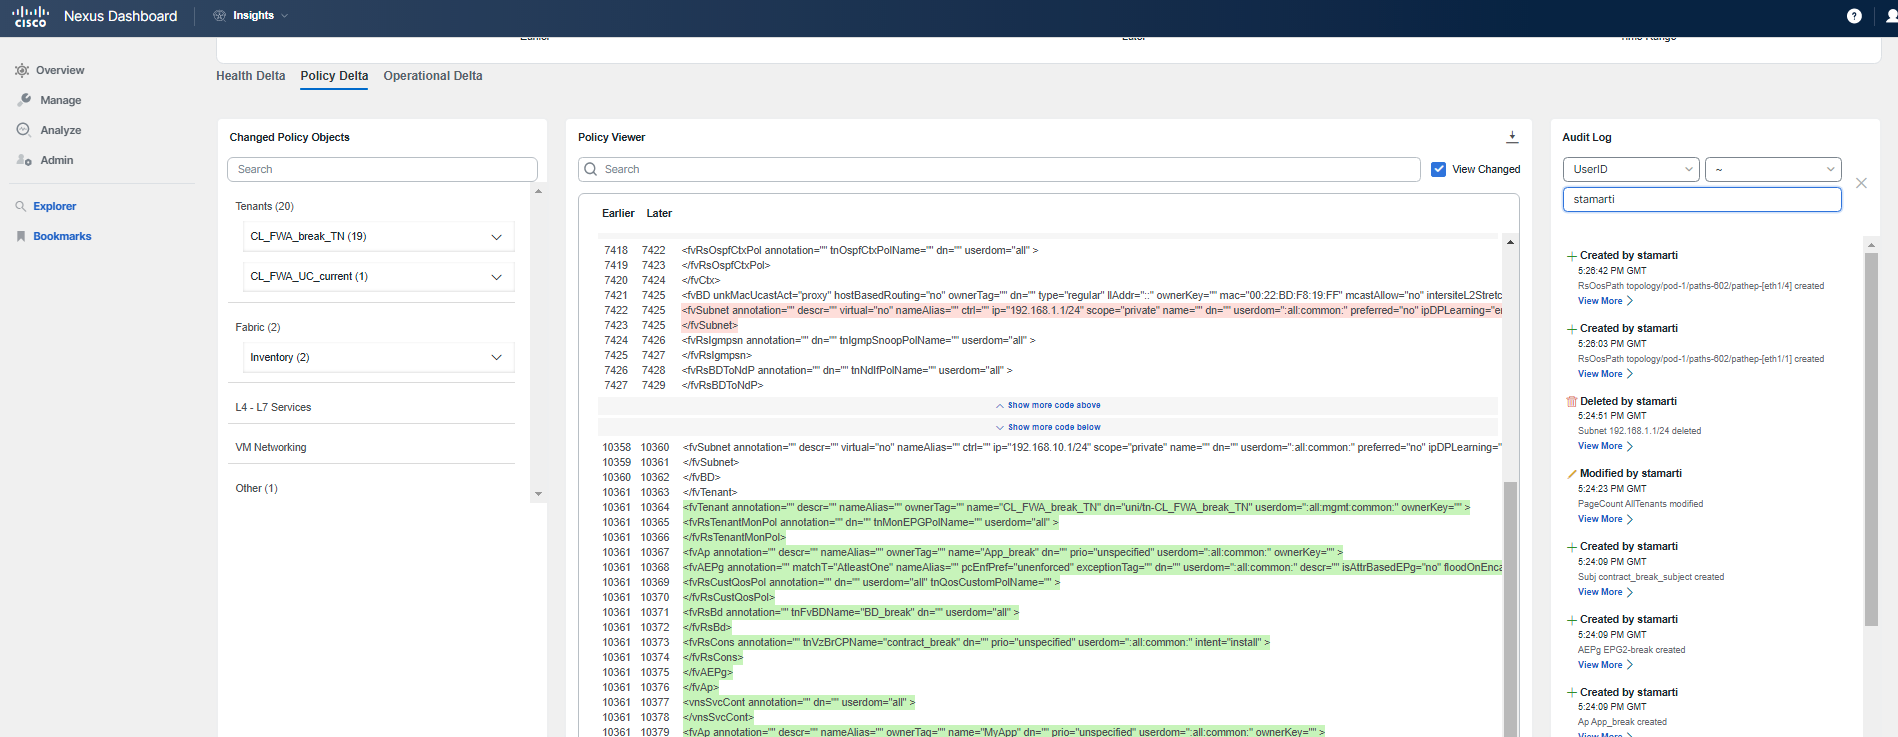
Continue your review by navigating to the Policy Delta tab. This section allows you to see the changes that were intentionally made to the fabric's policy configuration, which could include additions (highlighted in green), modifications (highlighted in orange), or deletions (highlighted in red). These color codings make it easy to visually identify the type of change that has occurred.
If you are looking for something specific and you know what to search for, you can utilize the search pane to quickly locate particular items within the policy changes. Additionally, the audit log displayed on the right side of the interface offers a convenient way to see who made which changes. This information is extremely valuable as it provides insight into the impact of changes and helps you understand what occurred during the maintenance window. It’s a critical tool for post-upgrade analysis, enabling you to verify that changes align with planned activities and to identify any unexpected modifications.
Step 5
To proceed with your investigation of the post-upgrade state:
- Return to the main view of the upgrade analysis.
- Click on View Update Details for nodes to access more specific information regarding the switches in the fabric.
- From there, select the Post-Upgrade Delta Analysis to delve into the changes that occurred on the node level as a result of the upgrade.
This step will allow you to examine the operational state of individual nodes and understand the differences before and after the upgrade, providing a comprehensive picture of the upgrade's effects on the fabric's infrastructure.
Step 6
In the Post-Upgrade Delta Analysis for nodes, you will find information analogous to what you observed at the controller level. This section allows you to evaluate the fabric's health from the perspective of the individual nodes (switches) and includes:
- Anomalies: You will be able to identify any new anomalies that have appeared post-upgrade, as well as any that have been resolved or persisted.
- Trending Data: The analysis will show you the change in the number of anomalies and provide trend information, helping you to understand whether the fabric's overall health is improving, degrading, or remaining stable post-upgrade.
This detailed information is crucial for assessing the impact of the upgrade on the fabric's operational state and for ensuring that any new issues are promptly addressed.
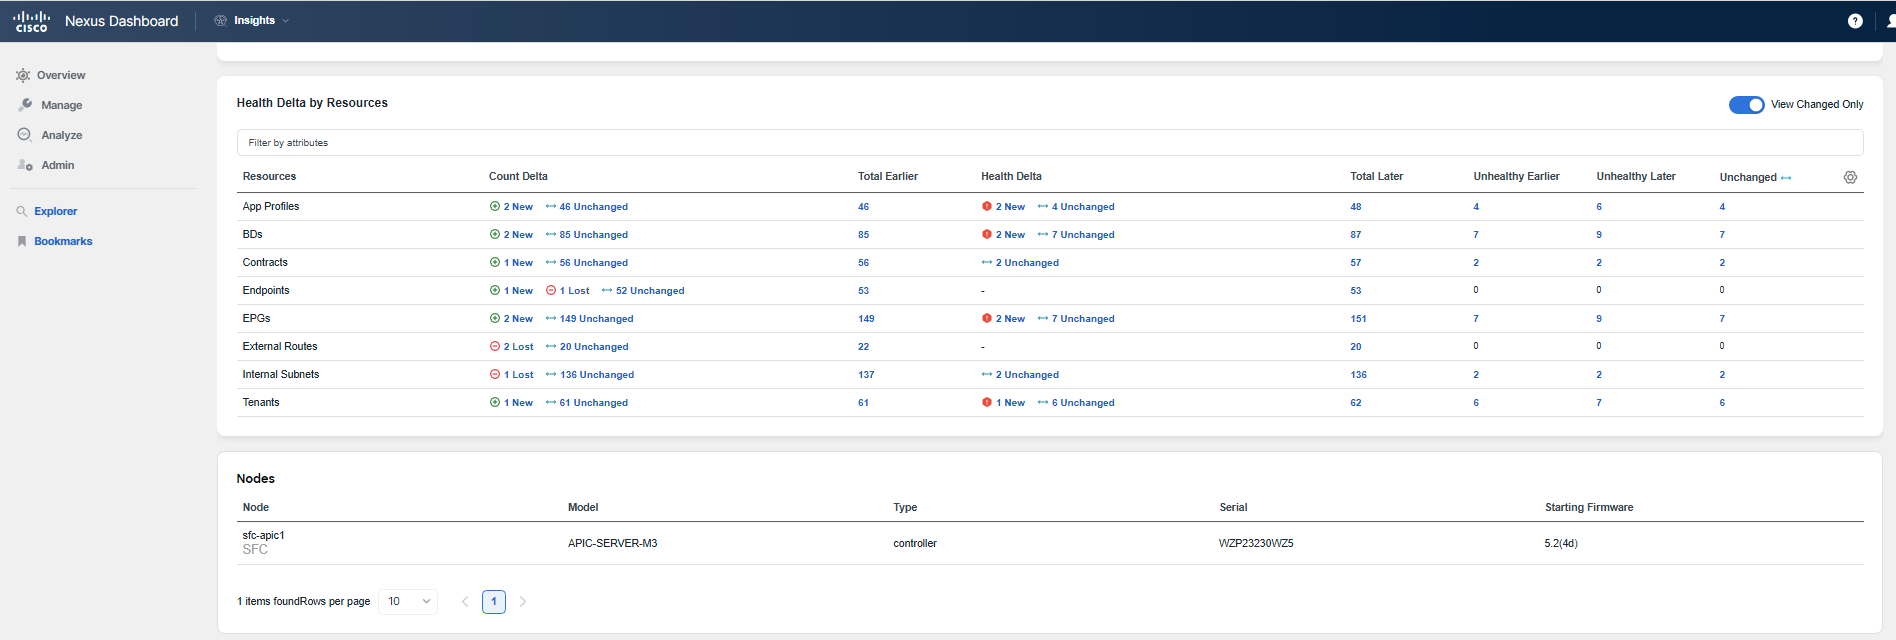
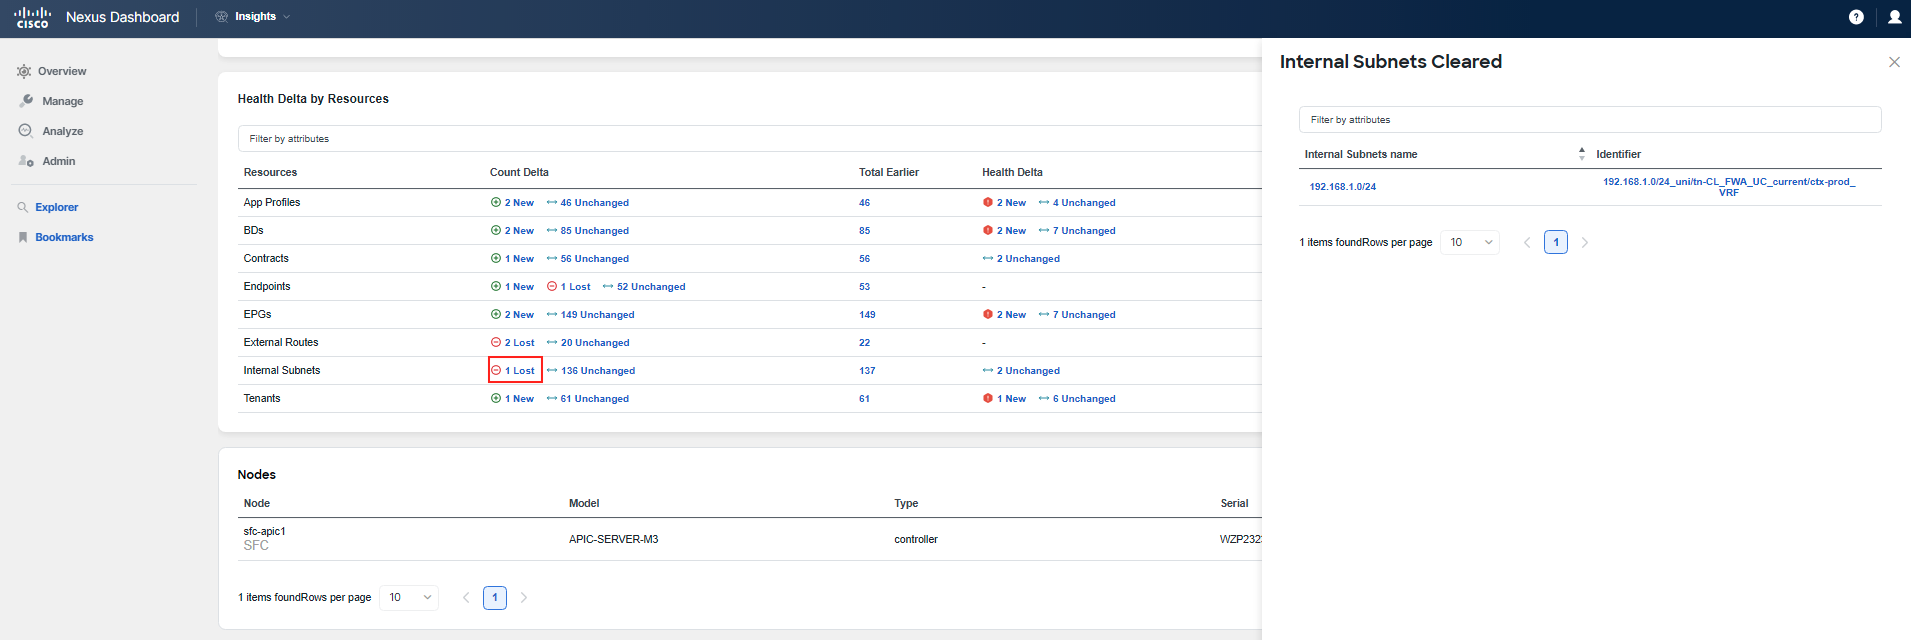
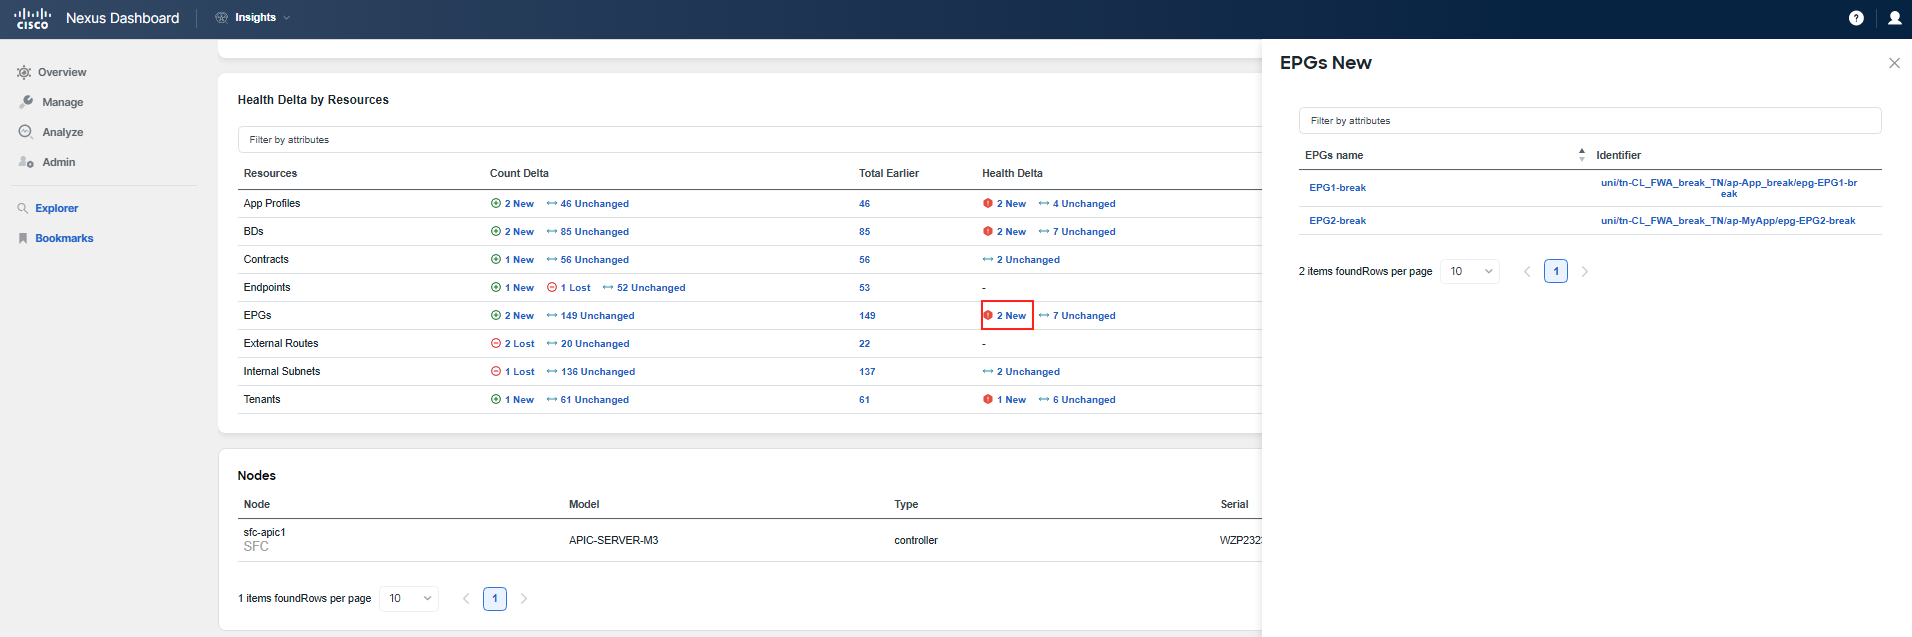
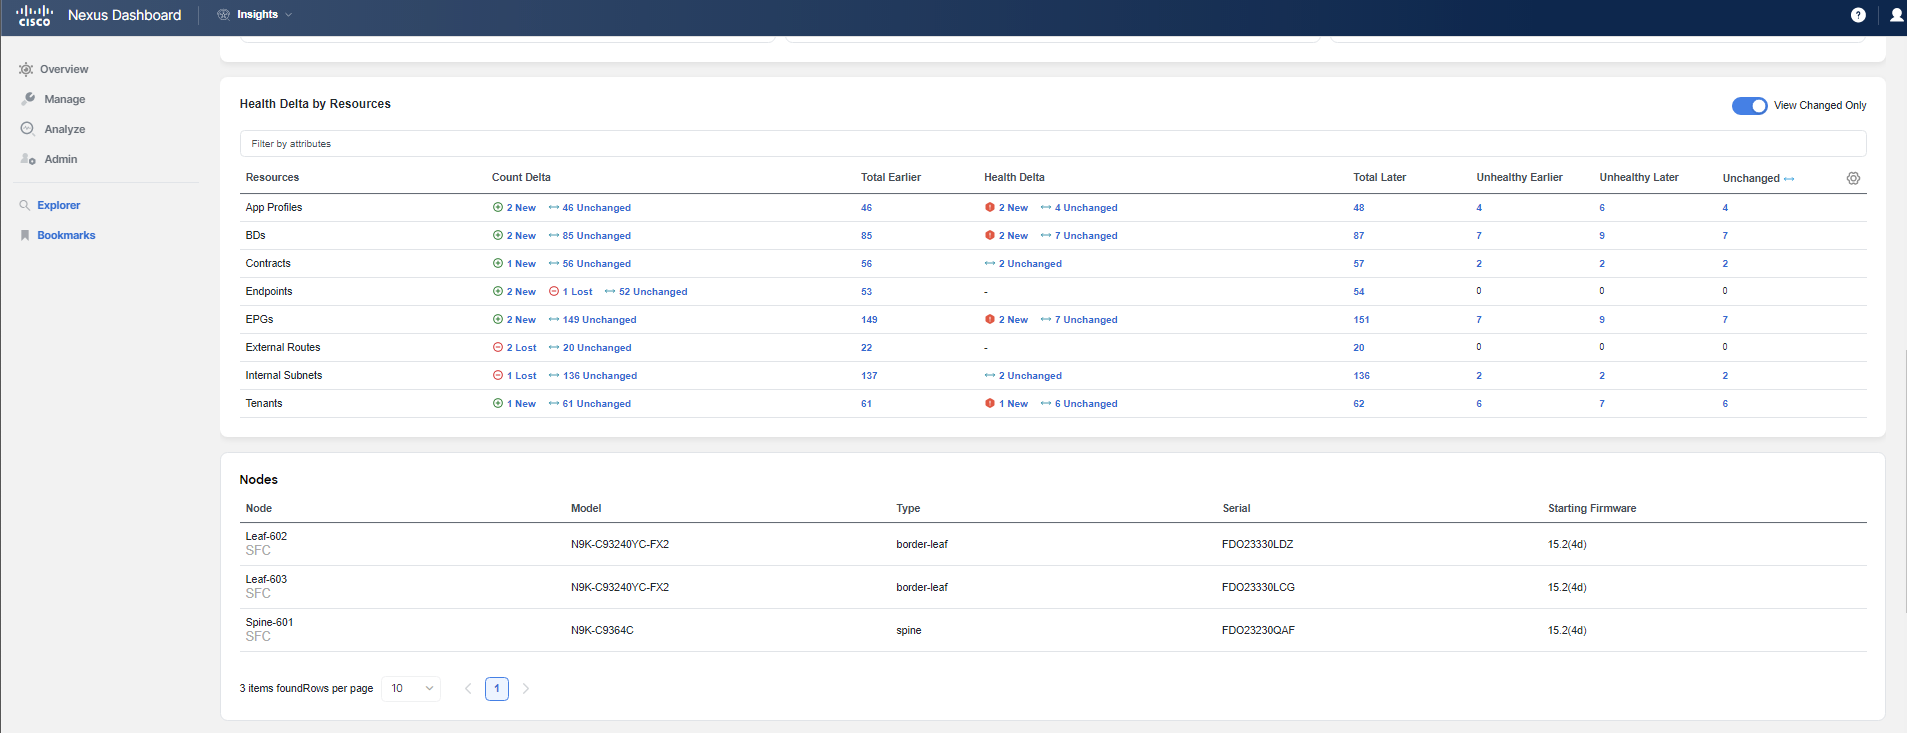
The Health Delta by Resources section within the Post-Upgrade Delta Analysis for nodes provides insights into the changes and trends of managed objects within the ACI fabric. Here you can observe:
- The differences in the counts of various managed objects before and after the upgrade.
- Trending data that indicates whether the quantity of specific managed objects (such as endpoints, EPGs, or bridge domains) has increased, decreased, or remained the same following the upgrade.
- Visual indicators that help you quickly ascertain the direction of these trends and the scale of any changes that have occurred.
This aspect of the analysis is essential for understanding how the upgrade may have affected the fabric's structure and resource utilization, which can, in turn, impact overall network performance and stability.
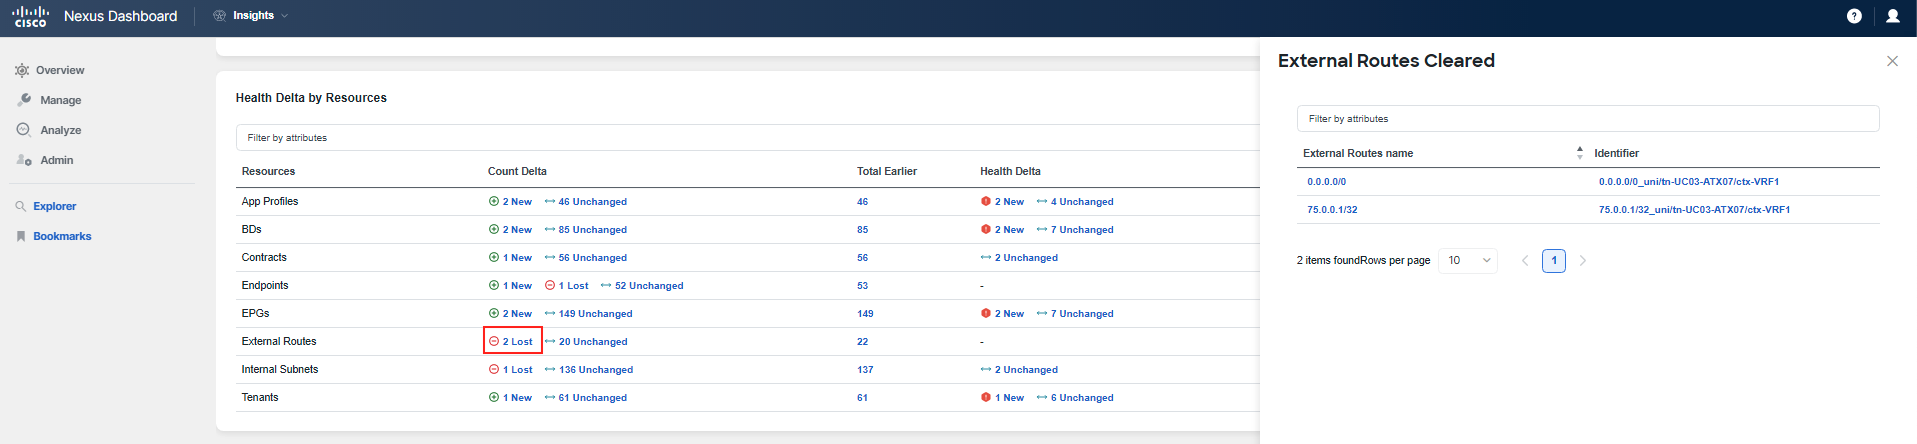
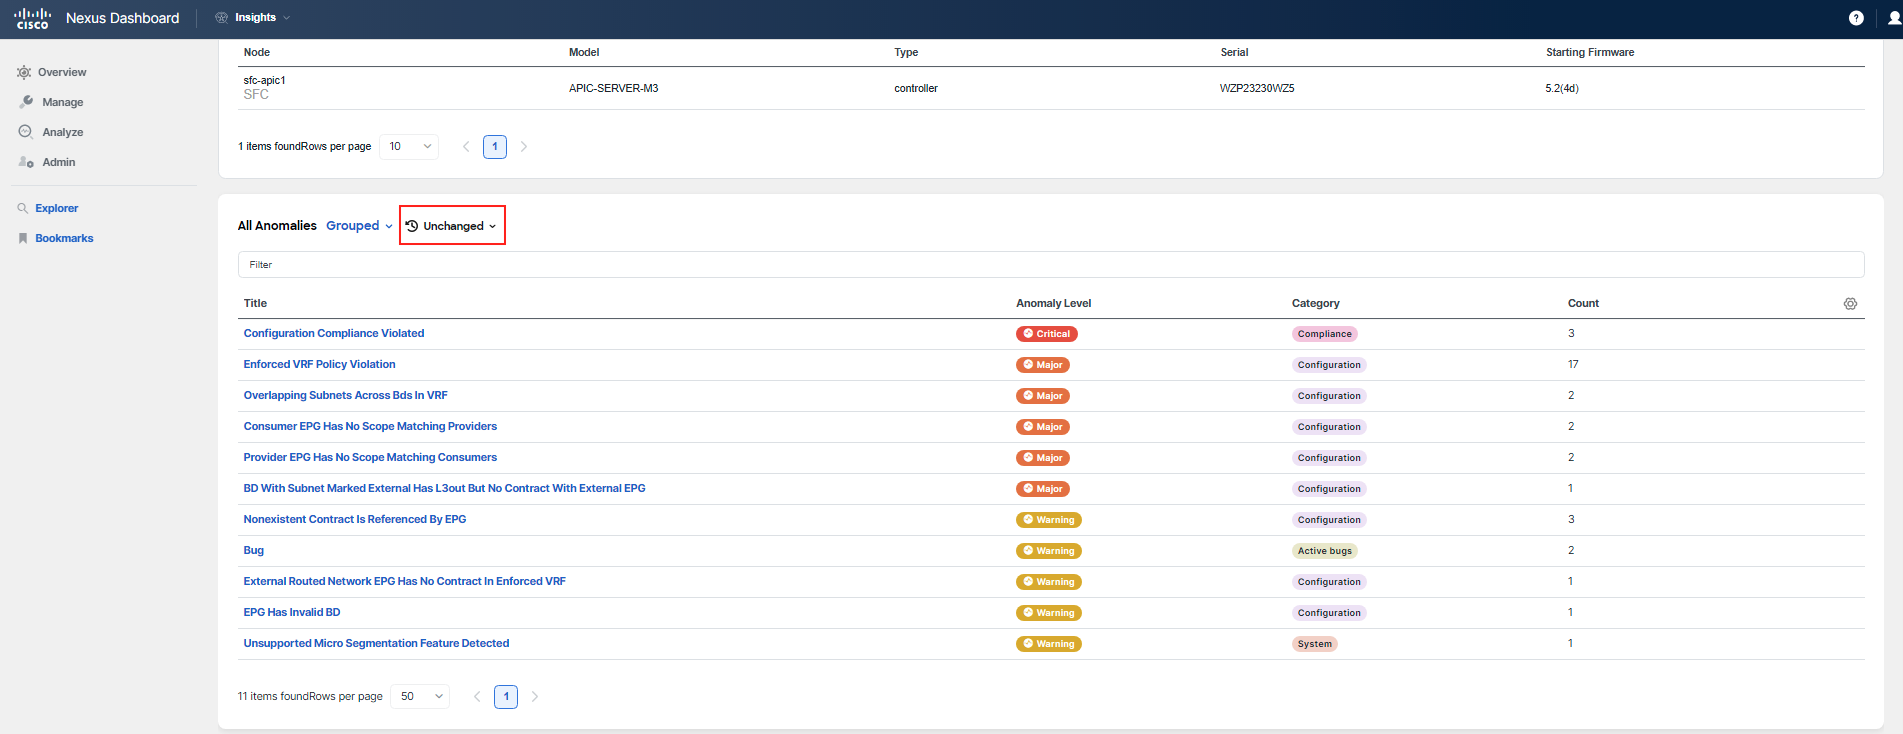
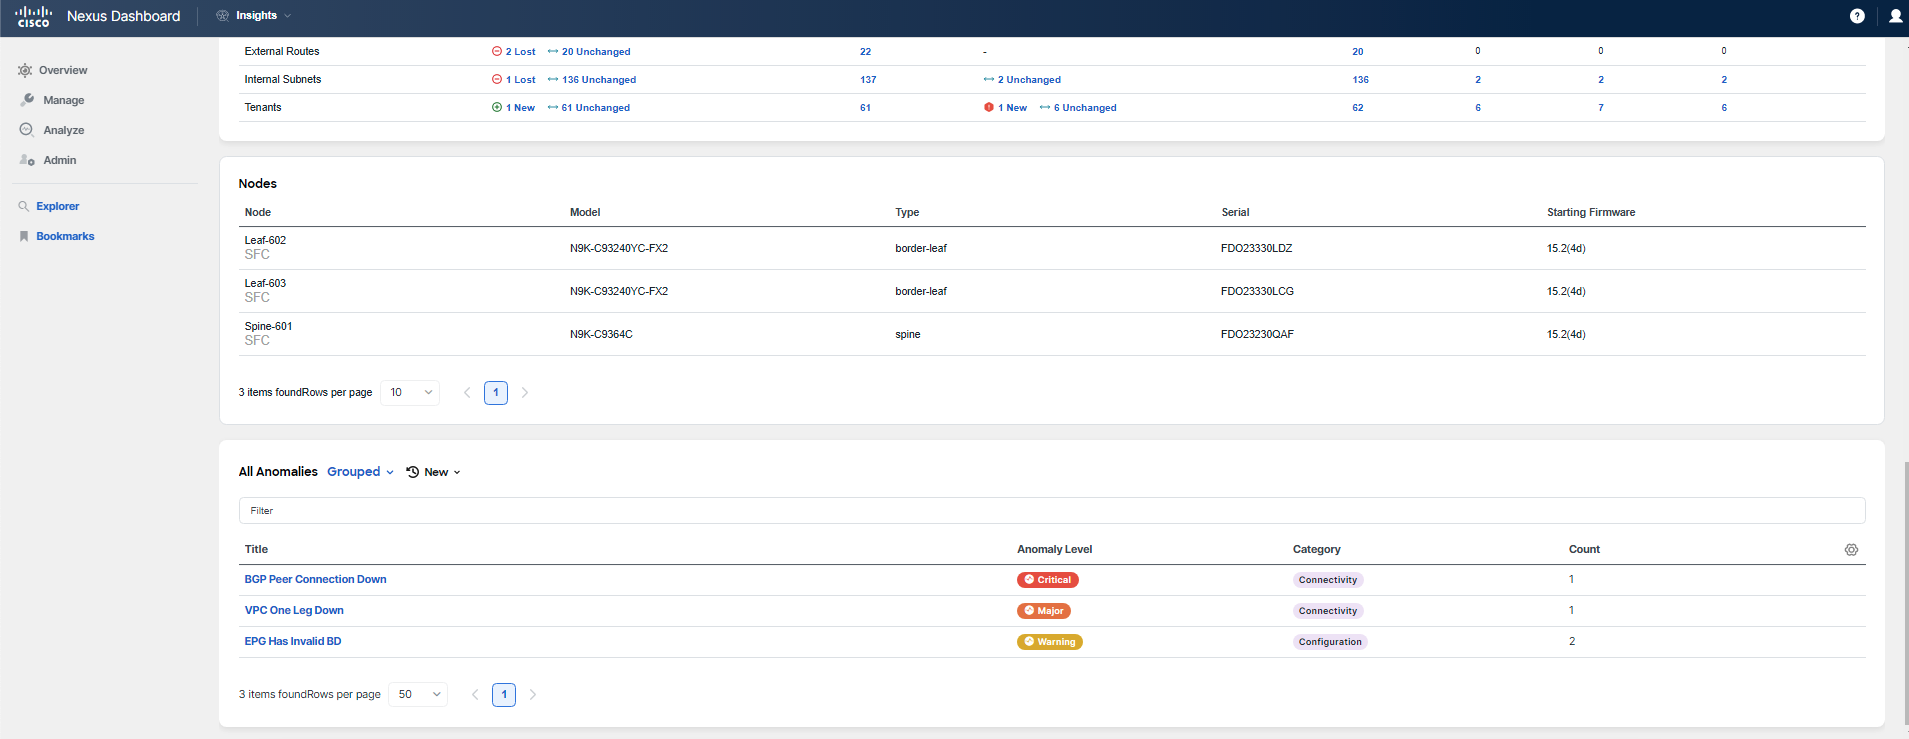
At the bottom of the Post-Upgrade Delta Analysis for nodes, you will find a comprehensive list of anomalies. This list will detail (depending on the selected view):
- New anomalies that have surfaced as a result of the upgrade.
- Existing anomalies that have persisted through the upgrade.
- Any anomalies that have been resolved following the upgrade.
Each anomaly is typically accompanied by a description, severity rating, and other relevant details to help you understand its potential impact on the network. You can use this information to prioritize which issues need immediate attention and to plan any necessary remediation steps to ensure the continued health and performance of your ACI fabric after the upgrade.
Step 7
In the Policy Delta tab of the Post-Upgrade Delta Analysis for nodes, you will encounter a detailed overview of the actual configuration changes that have taken place as a result of the upgrade. This includes:
- New configurations that have been added (indicated in green).
- Existing configurations that have been changed (indicated in orange).
- Configurations that have been deleted (indicated in red).
Just like with the controllers, these color-coded indicators help you quickly discern the nature of the changes made. Additionally, you will be able to identify who made each change, which is crucial for accountability and for understanding the context behind the modifications.
Exploring this tab will provide you with a clear record of the configuration adjustments that occurred during the upgrade process, allowing you to verify that all changes align with your intentions and policies. Or they do not as it might not have been the intend.
Step 8
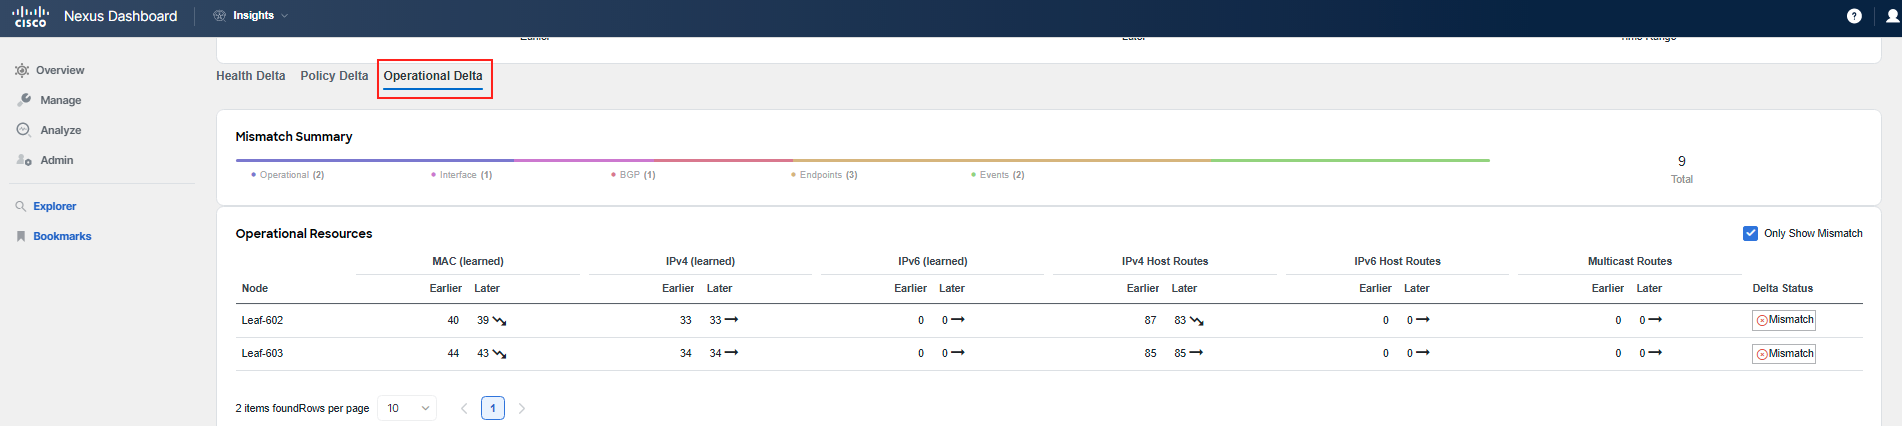
The Operational Delta tab in the Post-Upgrade Delta Analysis for nodes delves deeper into the operational status of the switches that were impacted by the upgrade. This tab is particularly valuable as it presents information that is critical for assessing the functional impact of the firmware update on the network infrastructure.
One of the key pieces of information you'll find in the Operational Delta tab is the comparison of routes and addresses before and after the upgrade. The first screenshot you encounter will highlight any mismatches in the routing tables or address spaces, which is essential for determining whether there are any learning or routing issues post-upgrade.
Discrepancies in the number of learned routes, MAC addresses, or IP addresses could point to potential problems with the network's ability to propagate routing information or maintain connectivity. This could affect traffic flow and accessibility within the network. Therefore, it's imperative to carefully review this information to ensure that the network remains reliable and that any discrepancies are investigated and resolved promptly.
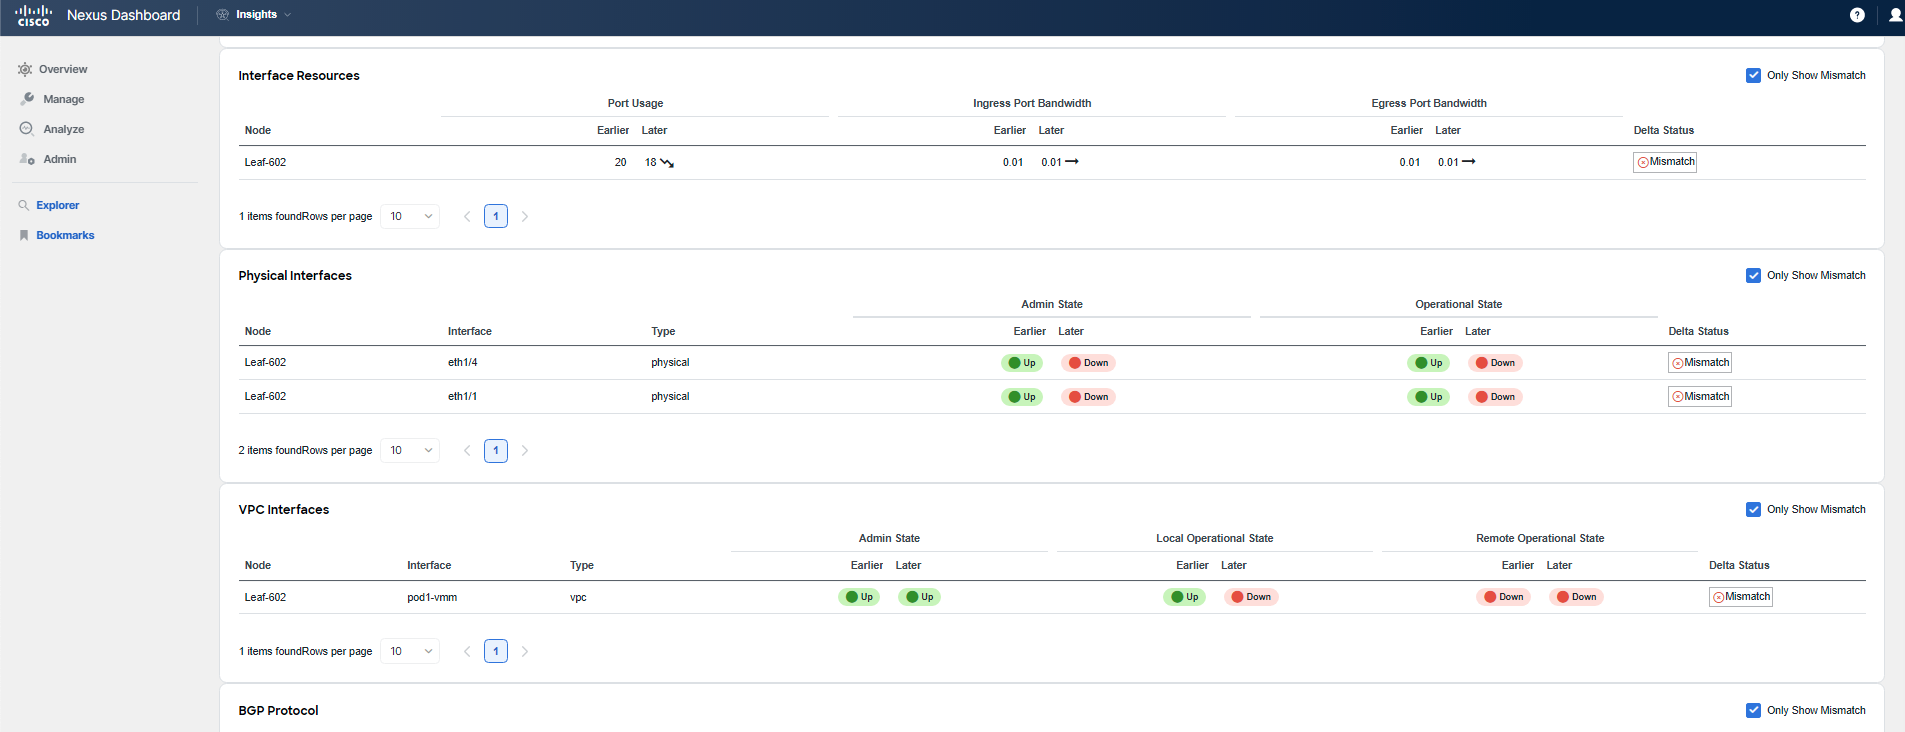
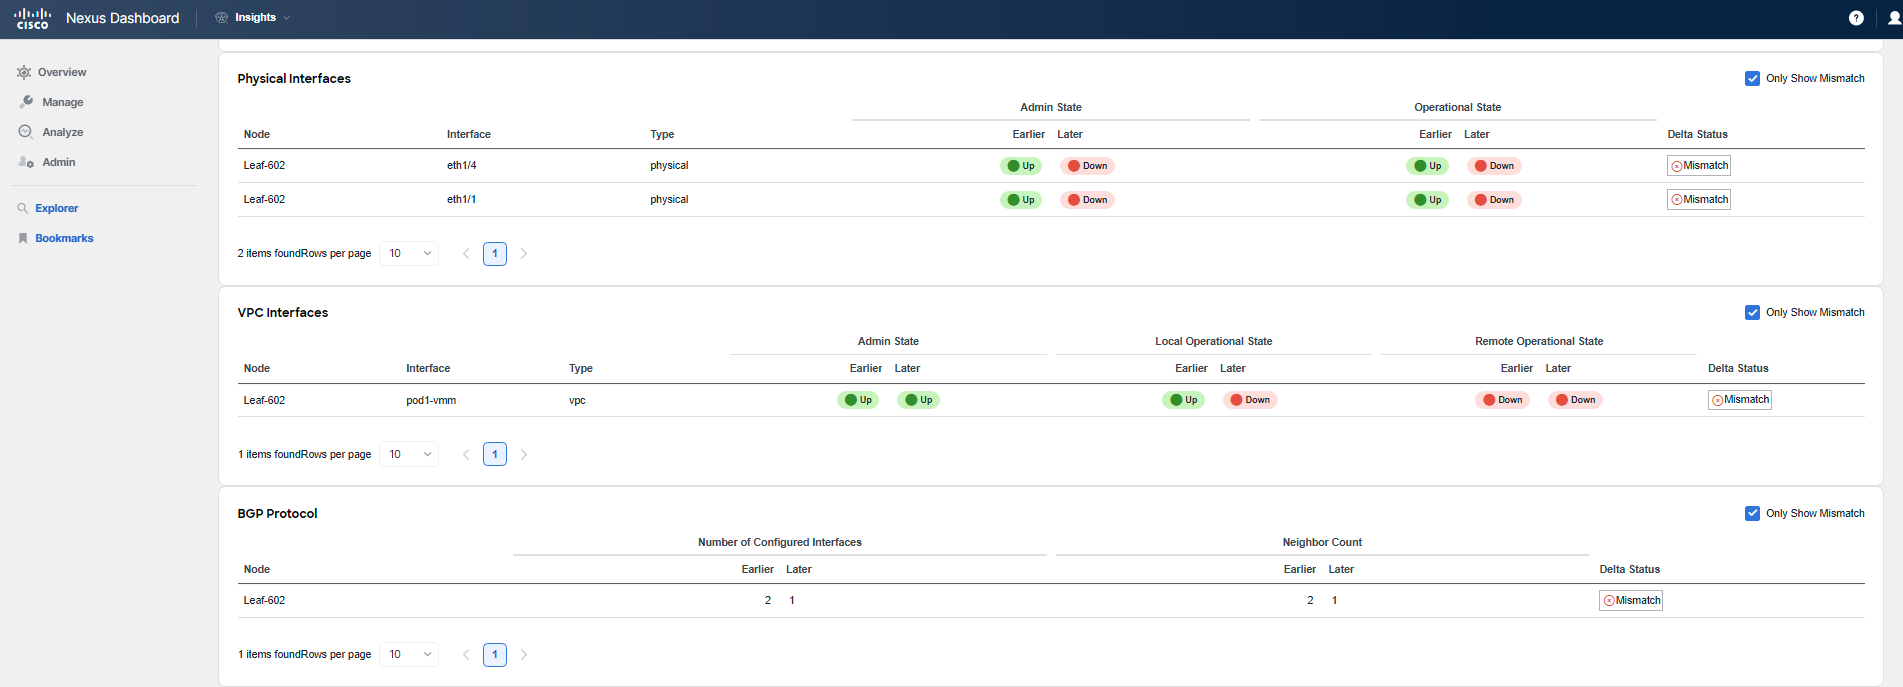
The subsequent screenshot in the Operational Delta tab focuses on mismatches related to interfaces or protocols. This is an important aspect to examine as it can reveal if any interfaces have gone down or if there have been any losses in neighbor relationships, which could lead to reachability issues within the network.
Specifically, this analysis will highlight:
- Differences in the count of operational interfaces, indicating whether any have become non-operational post-upgrade.
- Changes in protocol adjacencies, which are vital for routing and network communication.
- Any unexpected changes in protocol states or interface statuses that were not anticipated as part of the upgrade process.
Understanding these operational details is crucial for network stability. Any loss of interfaces or neighbor relationships may disrupt network traffic and could signal underlying issues that need to be addressed to restore full network functionality. It's important to use this information to verify that the network continues to operate as expected and to troubleshoot any anomalies that the upgrade may have introduced.
The final part of the Operational Delta tab will show you the impact of the firmware update on endpoints. This part of the analysis is crucial, as endpoints represent the devices (such as servers, workstations, and other network clients) that connect to your network.
This analysis will help you determine:
- If any endpoints have been added or removed from the network as a result of the upgrade or during the upgrade process.
- Whether the upgrade itself or anything during the upgrade has affected endpoint reachability or communication within the network.
Monitoring the status of endpoints is essential because they are critical for the services and applications that run on your network. Any disruption to endpoint connectivity could have a direct impact on business operations and service delivery. It is important to ensure that all endpoints are functioning correctly after the upgrade and to quickly address any issues that may have arisen.
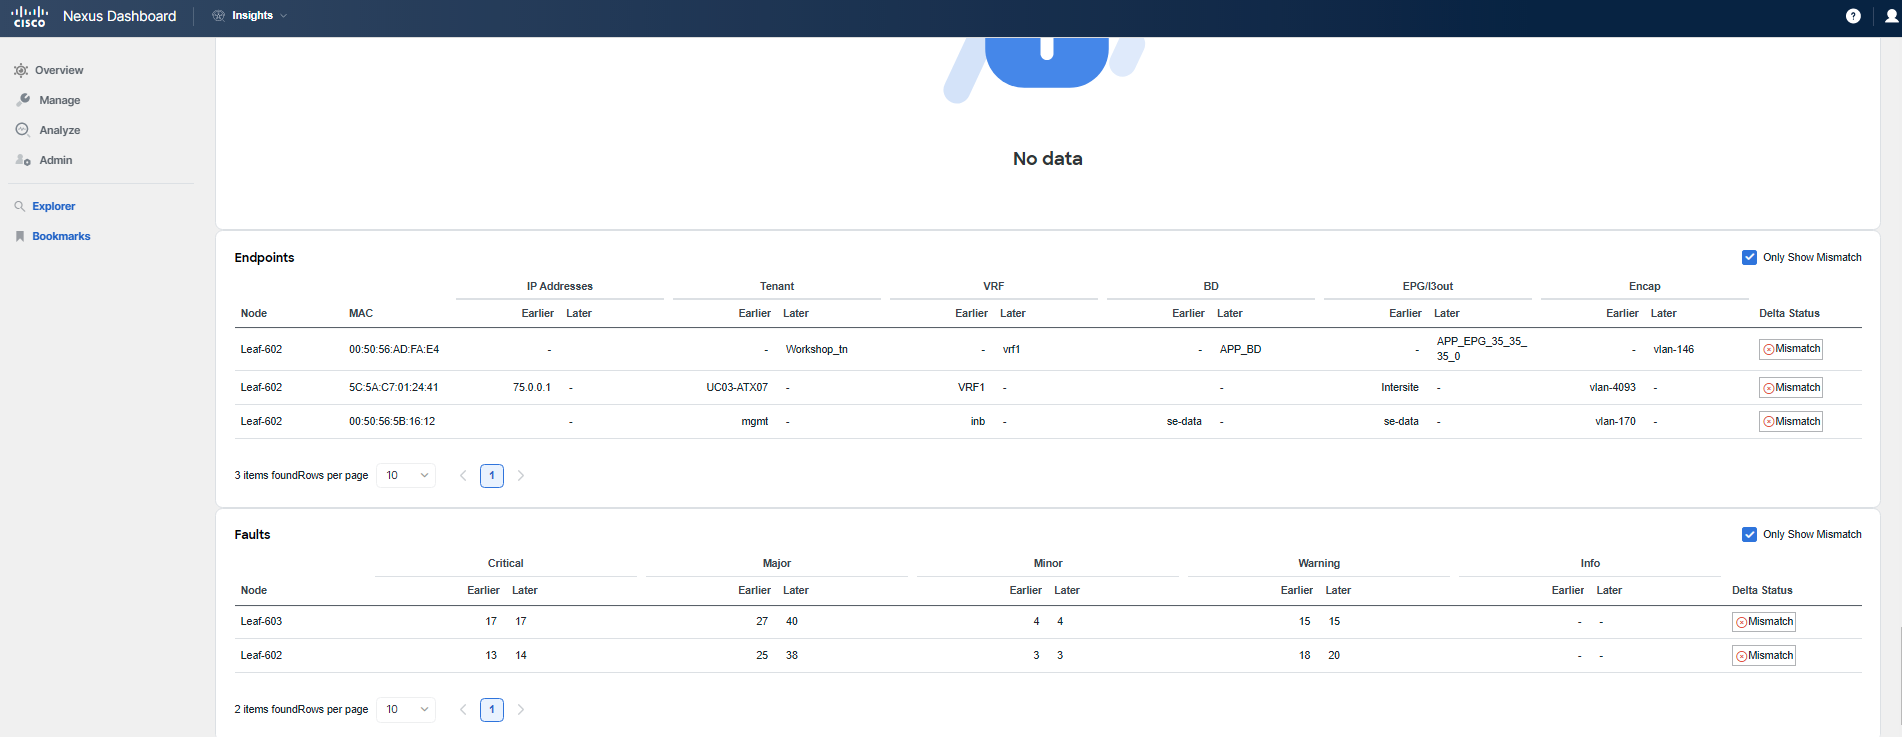
There are also other checks performed which are related to Operational Delta. However, as you could see, in this particular upgrade example, they are displayed with message "No Data". It means that there was no change for these categories during the process.
You have completed the analysis of the post-upgrade state of your fabrics. Through the process, you've identified changes and noted some discrepancies between the states before and after the upgrade. Normally, the next step would be to address any discovered issues and make necessary corrections. The Firmware Update Analysis feature of Nexus Dashboard Insights has provided you with comprehensive data to make this process more efficient.
Note
To shed light on the intentional changes made during the upgrade maintenance window, which you may have identified during your analysis, here are the specific actions that were taken: a new tenant was added with several objects such as EPGs or a contract, a subnet on an existing BD in a different tenant was deleted, some interfaces on one leaf were disabled, and a VM was shut down to affect EP learning.
Now that you have completed this lab, it is worthwhile to refer to the last section of the guide when you have time. This section contains how-to instructions, including the steps to create Pre/Post-Upgrade Analysis in your own environment.
With this use-case concluded, you are ready to proceed to the next one.